what does a city have to see about itself before it can promise net zero?
A city audited ward by ward, then given a pathway to net zero it could adopt.
Ahmedabad's Climate Resilient City Action Plan is a 200-page book built for one municipality: a ward-level audit of how the city works and where it breaks, a greenhouse-gas inventory that puts a number on it, and a pathway from that number to net zero by 2070, sector by sector, action by action. Published by the Ahmedabad Municipal Corporation with the Government of Gujarat under CapaCities (SDC), with ICLEI South Asia, South Pole, econcept and NIUA. I co-authored the sector strategies and designed the book.
- (role)
- co-author · sector strategies · book design
- (period)
- 2022–2023
- (context)
- ahmedabad · capacities · iclei south asia
- (status)
- published · july 2023
One municipality, 2021–22
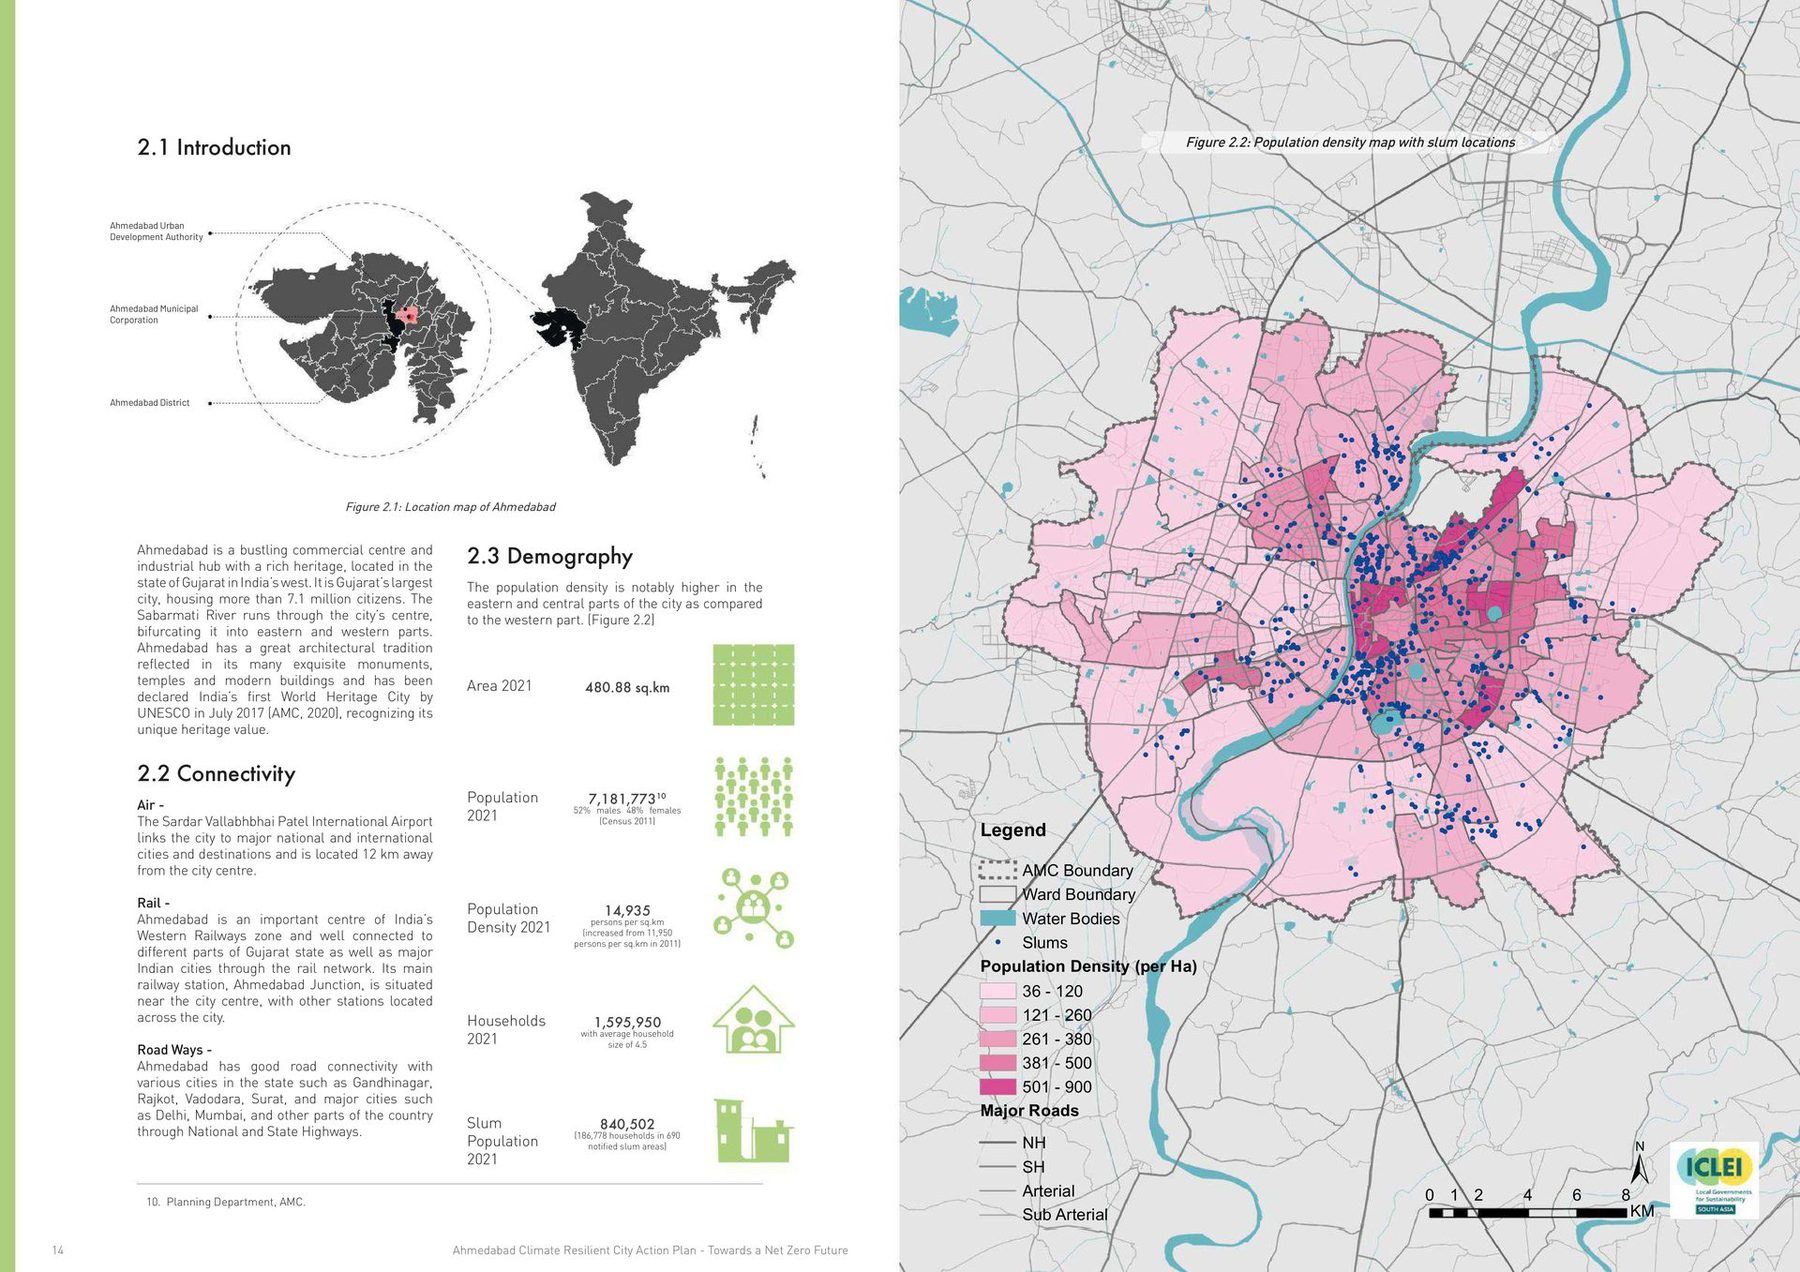
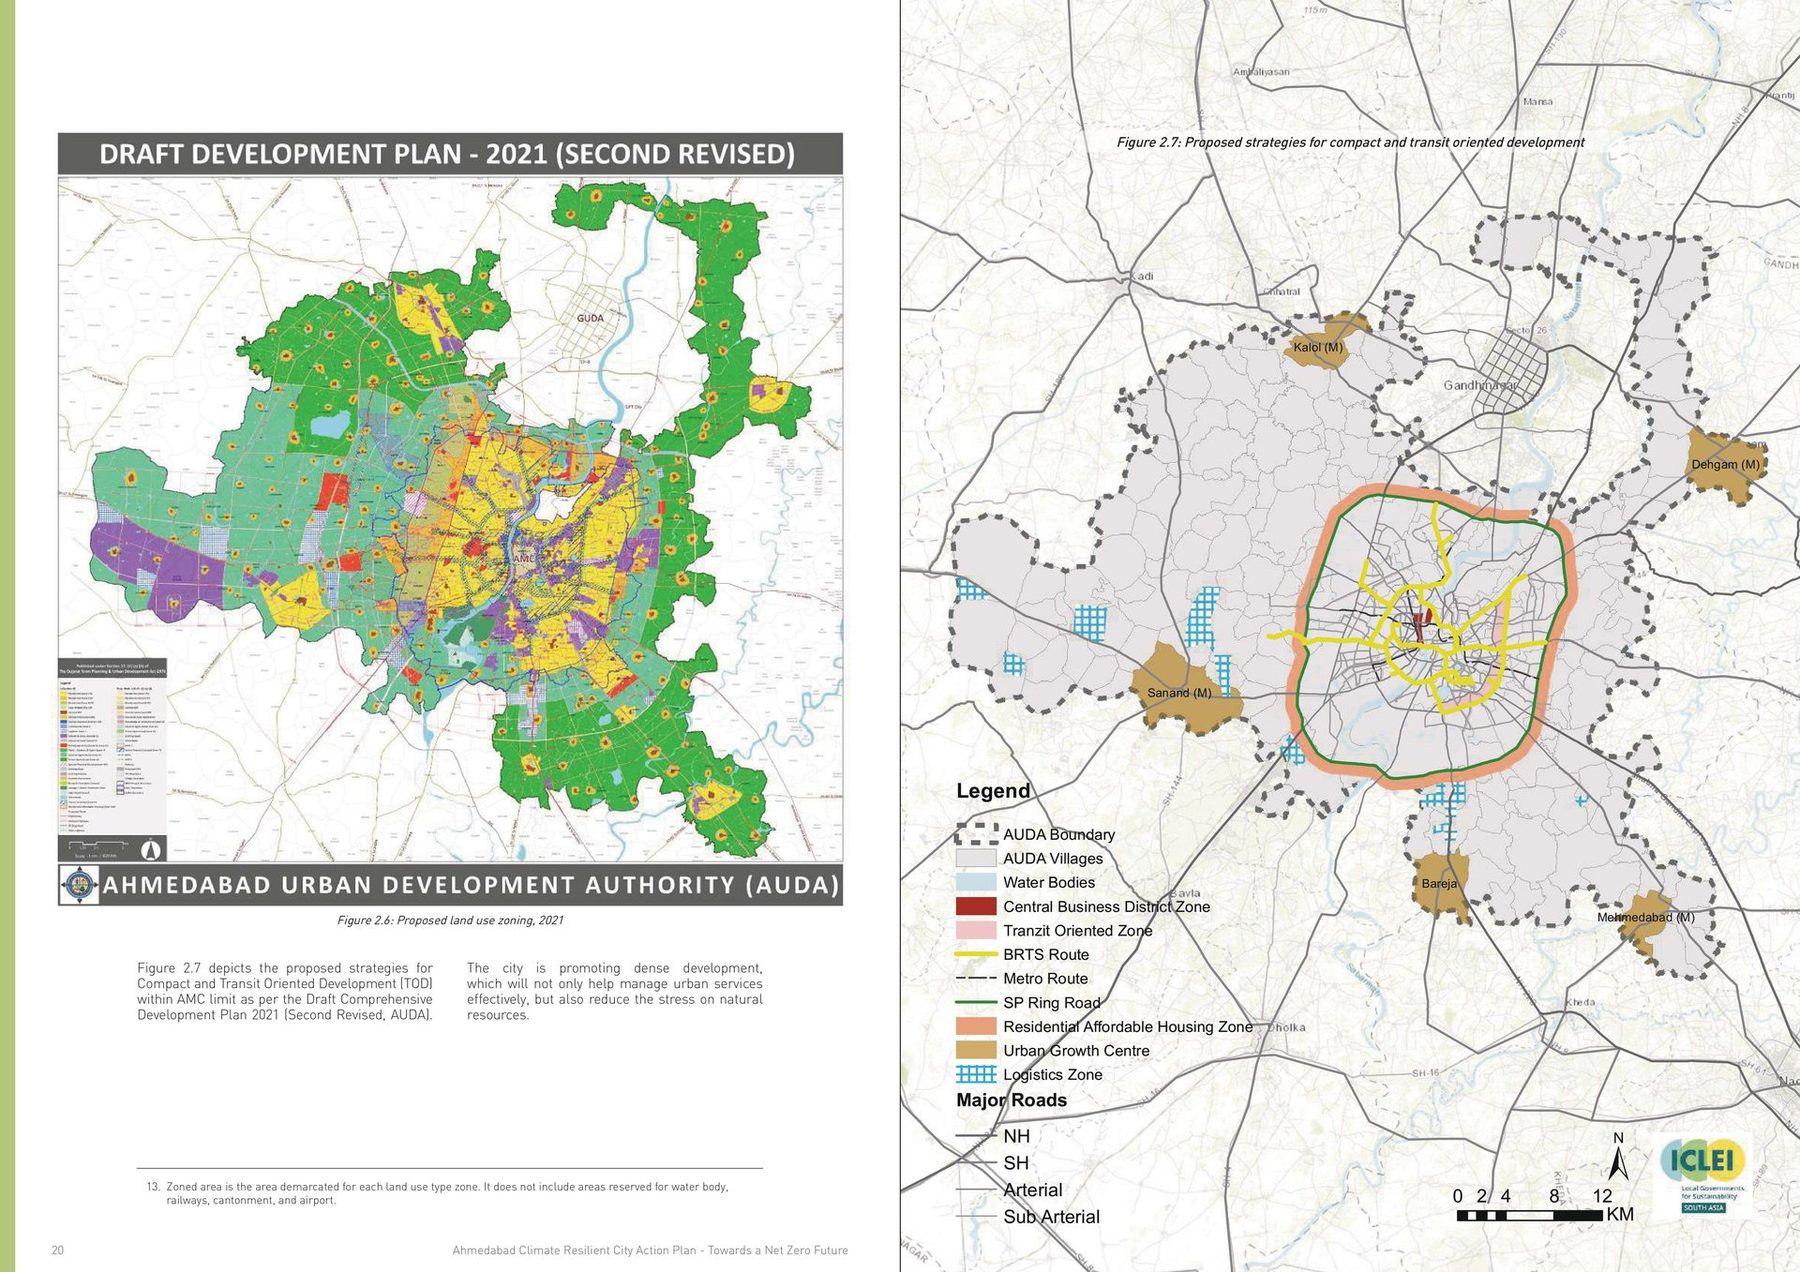
A climate action plan is only as good as the picture of the city it starts from. This one starts from a single municipality in a single year, Ahmedabad, 2021–22, and refuses to generalise beyond it. Population, wards, the development plan already in force, the utilities that keep the city running: the plan is written for the people who run those things, in the units they use.
The book is one of three in the CapaCities series, with Surat and Vadodara: the same method, applied here to a city of seven million.
The city, drawn one layer at a time
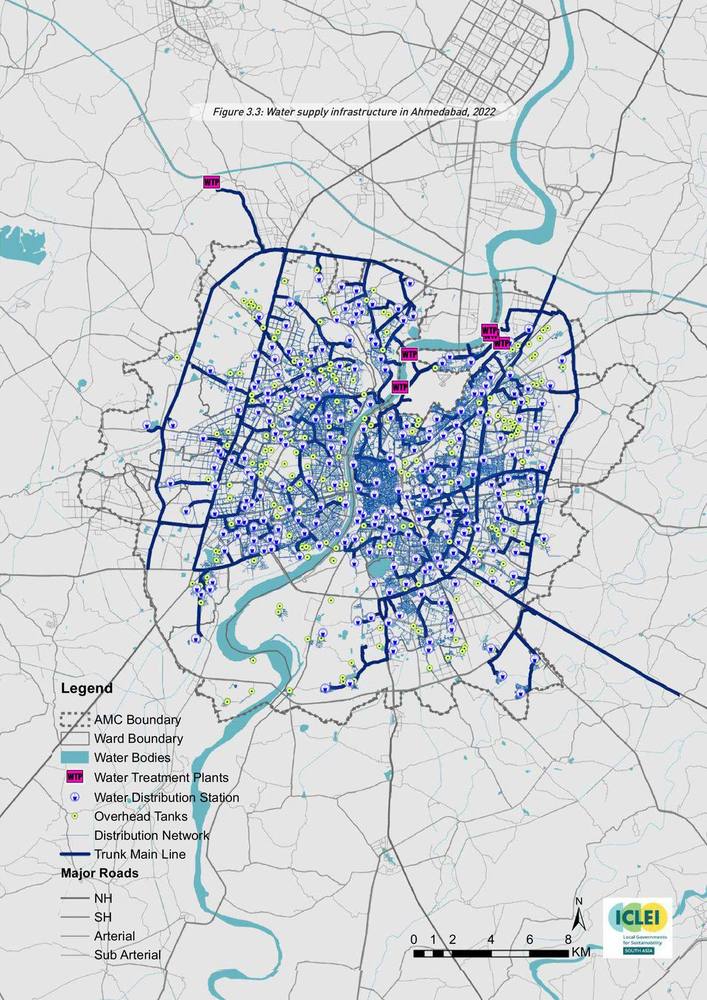
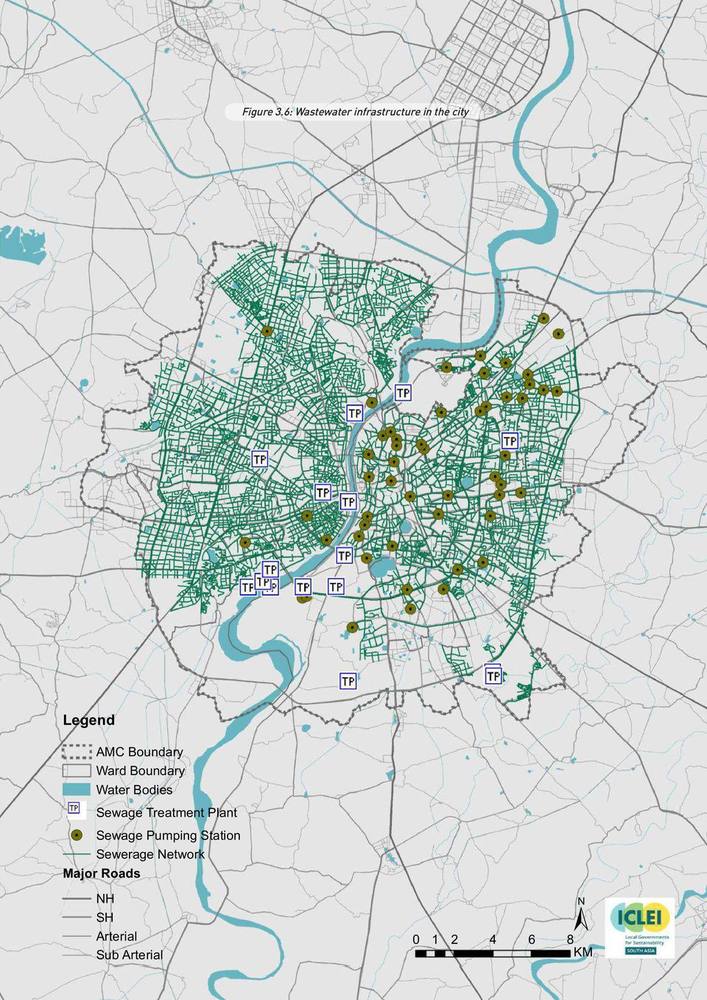
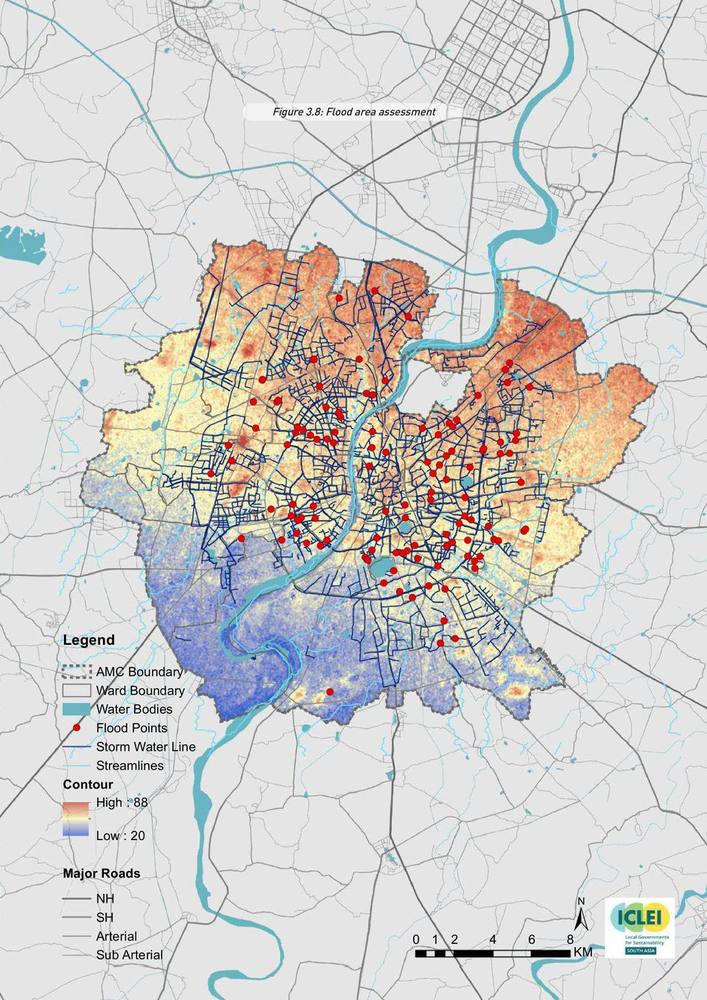
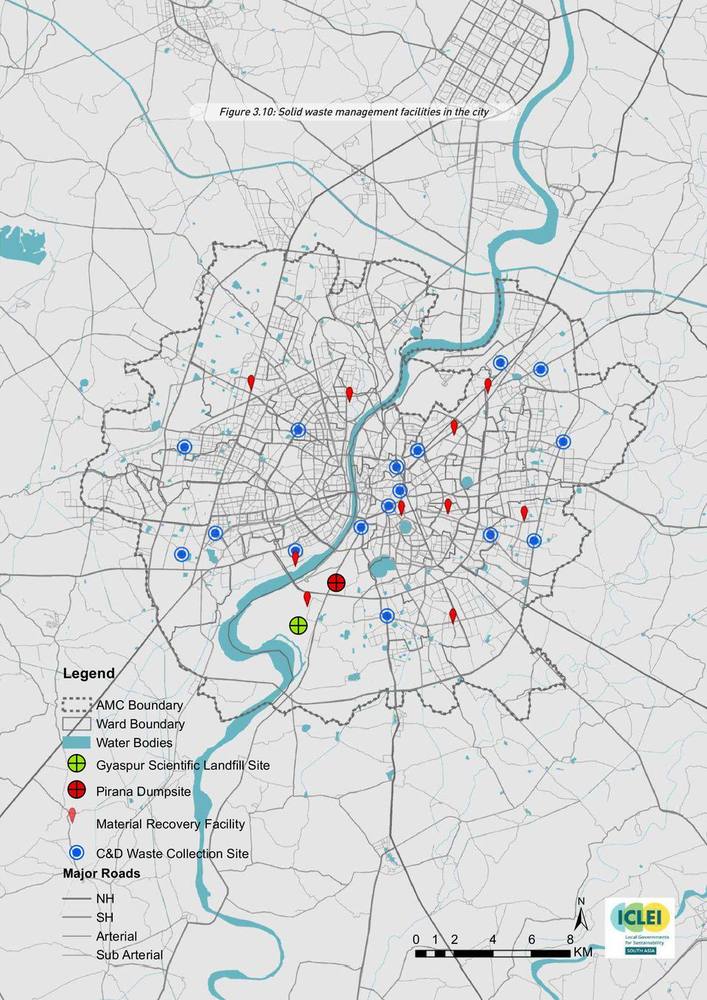
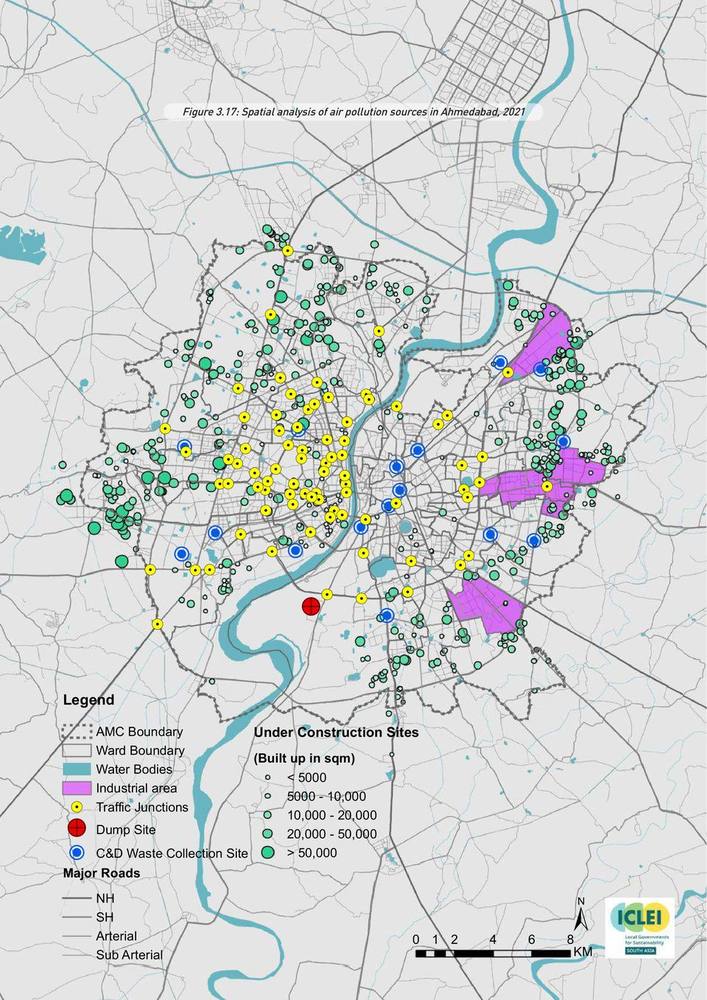
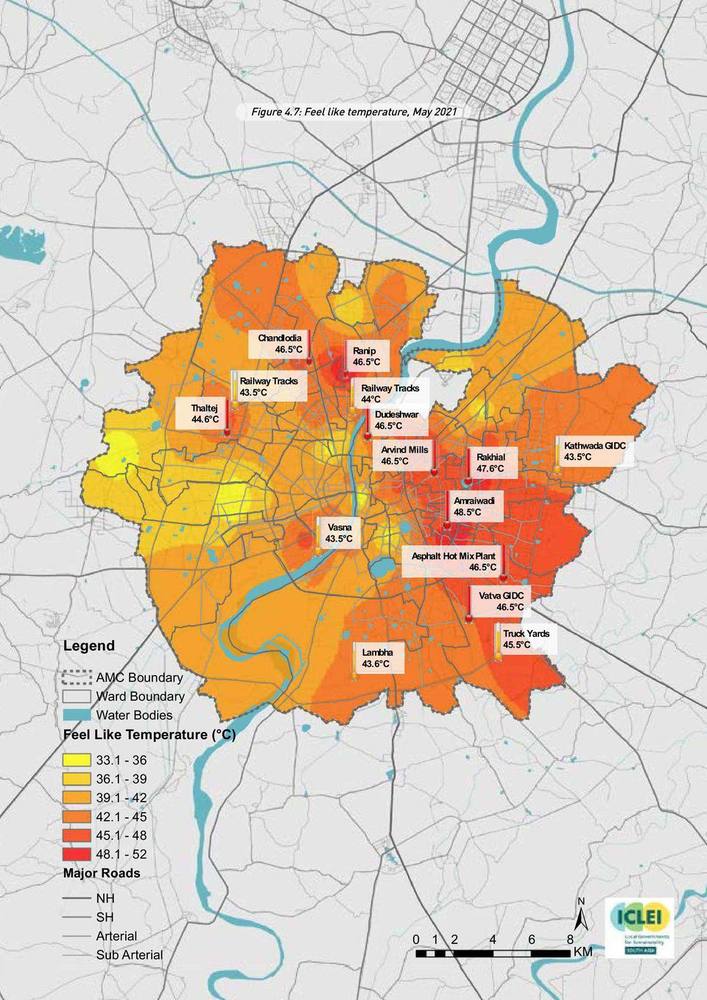
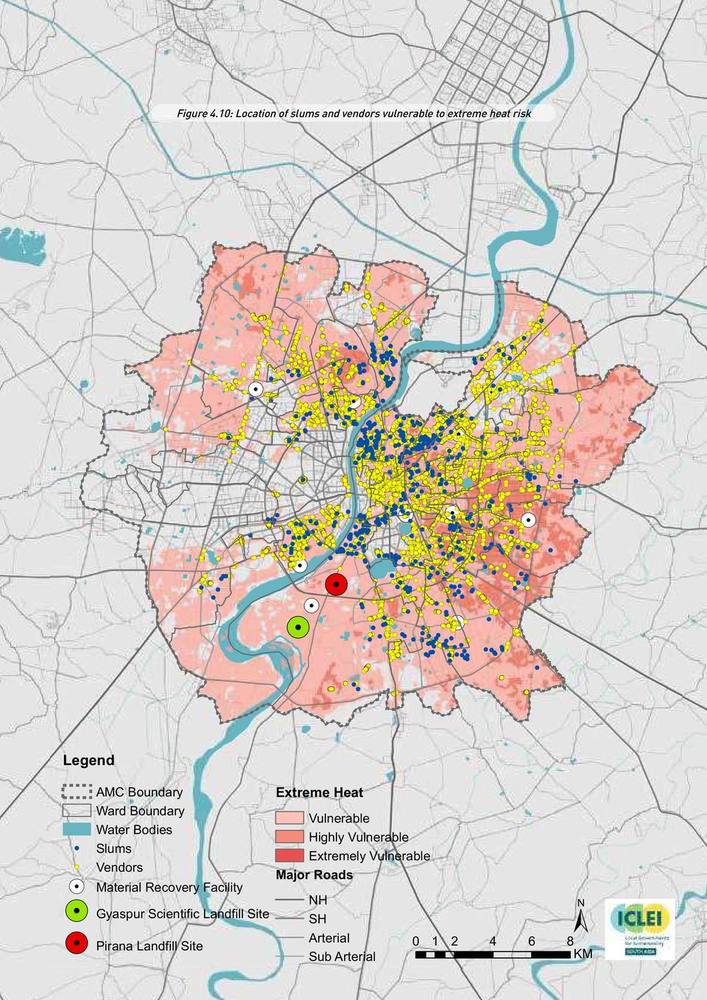
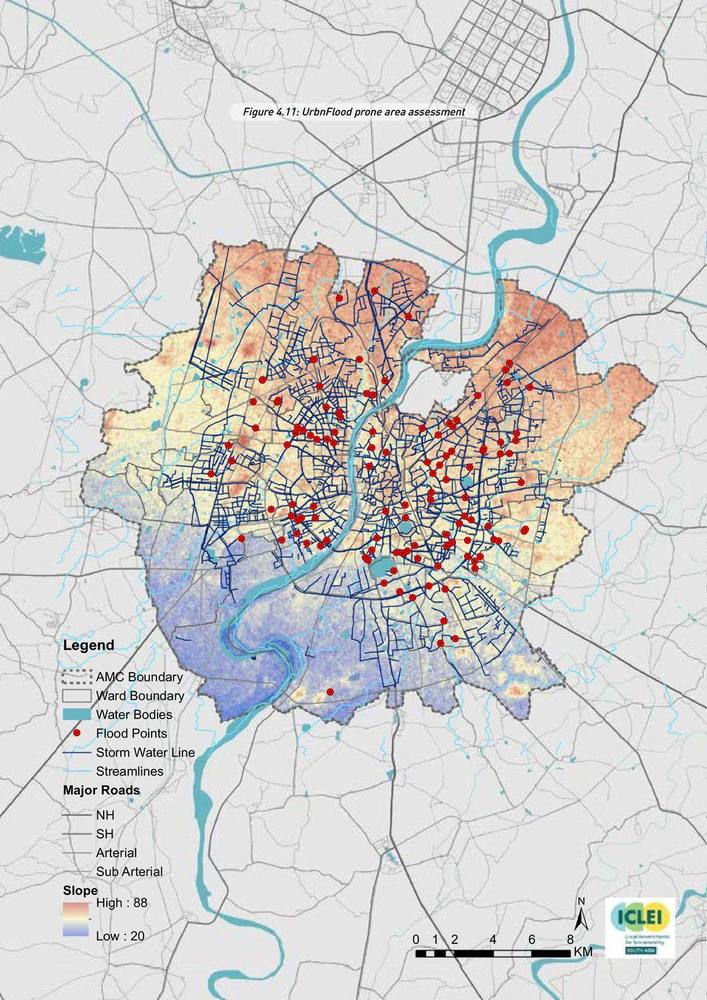
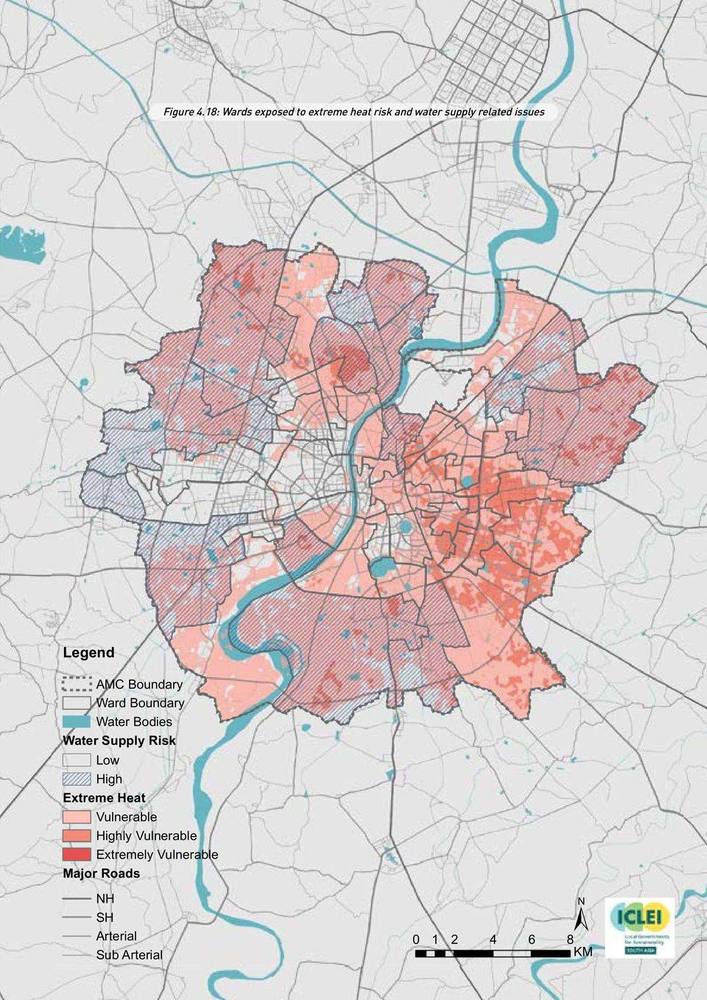
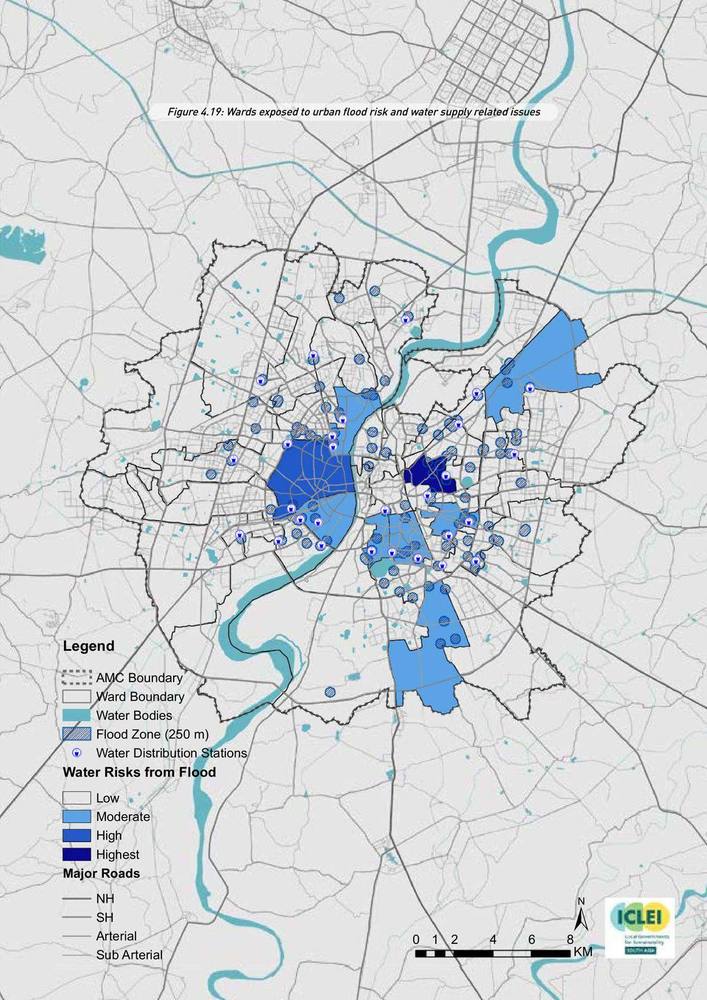
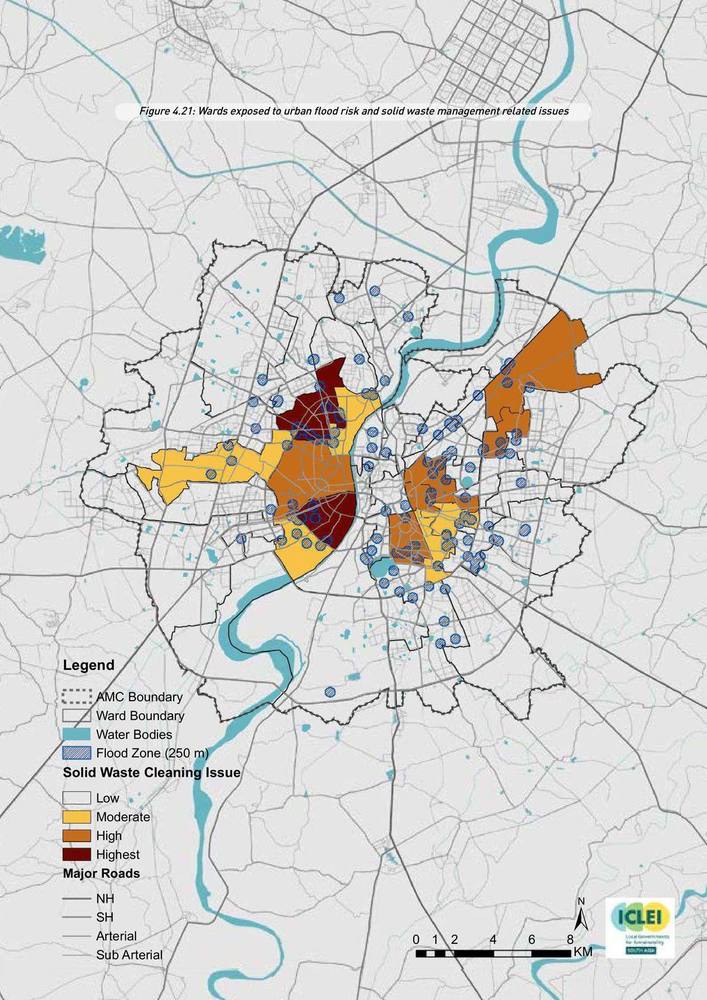
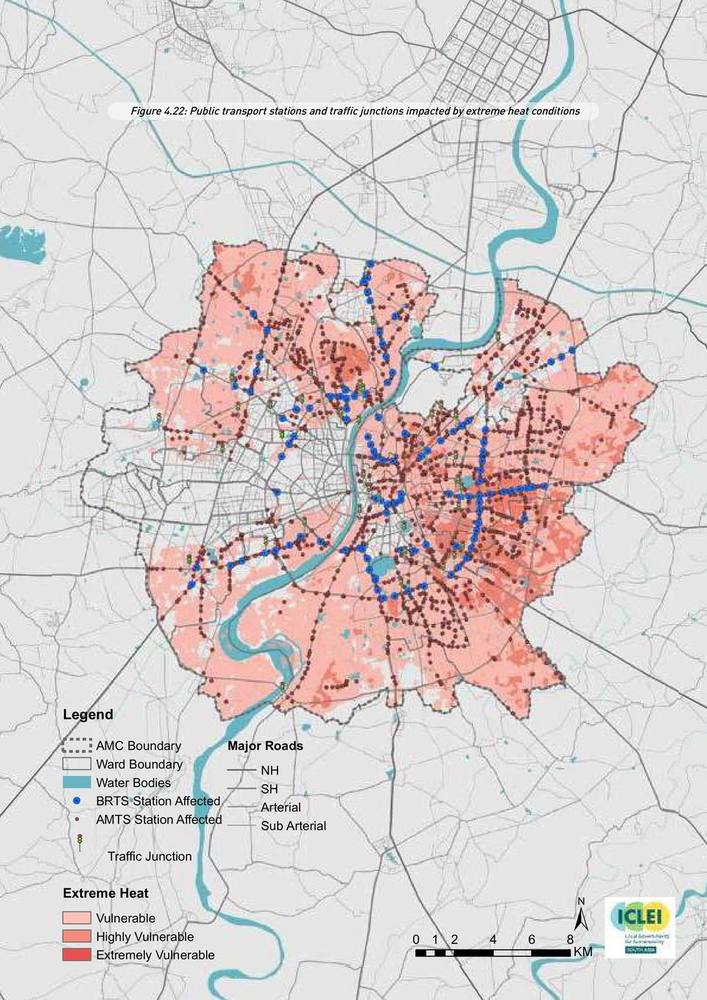
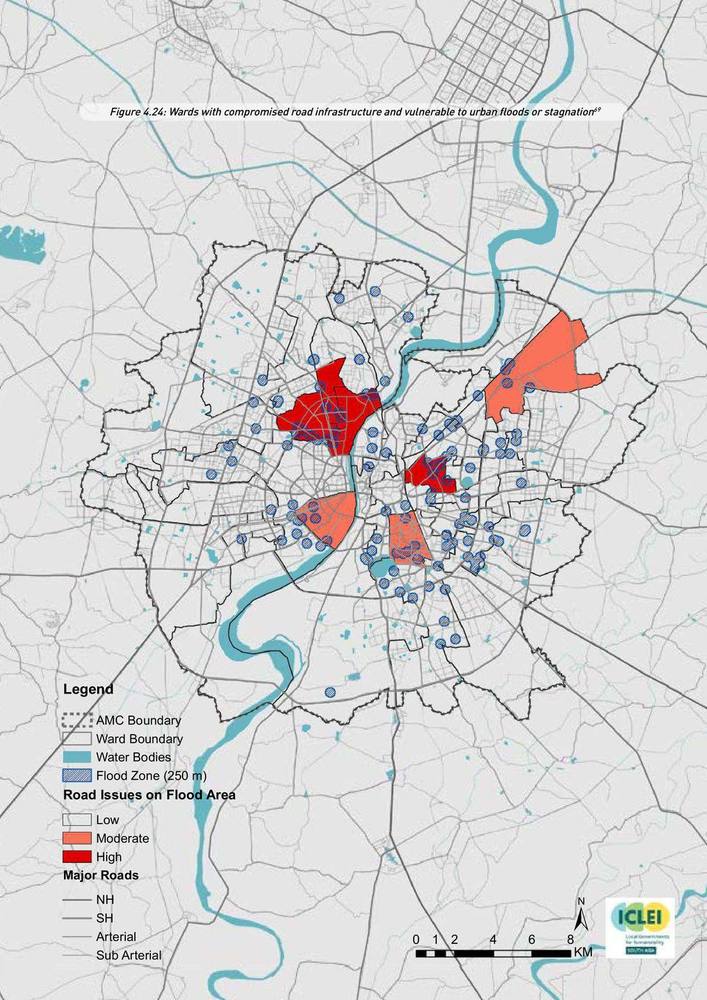
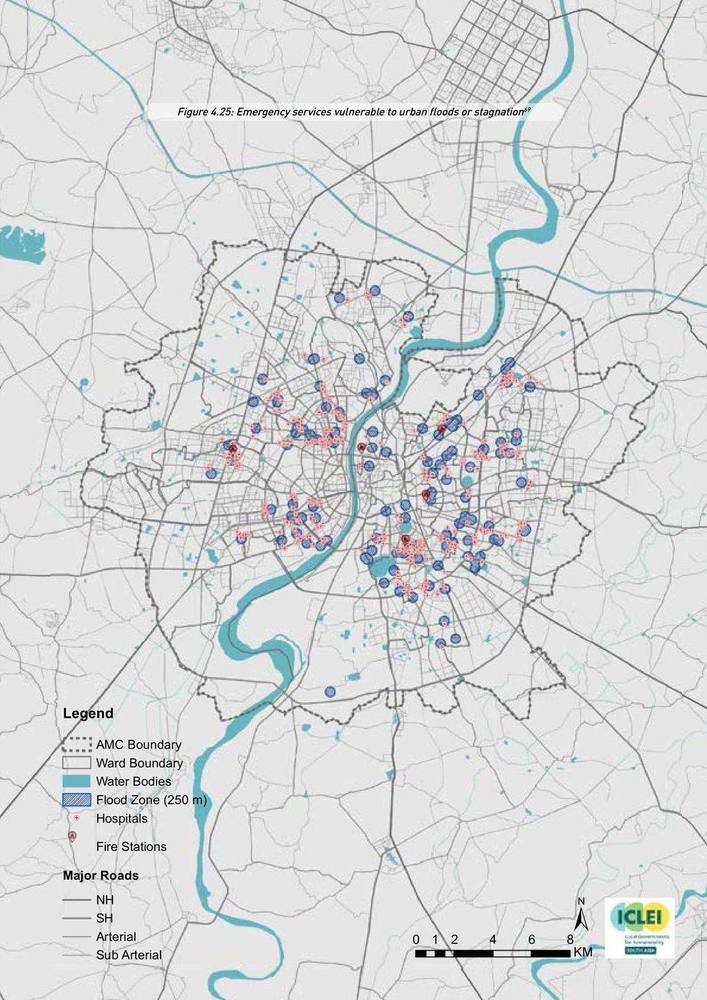
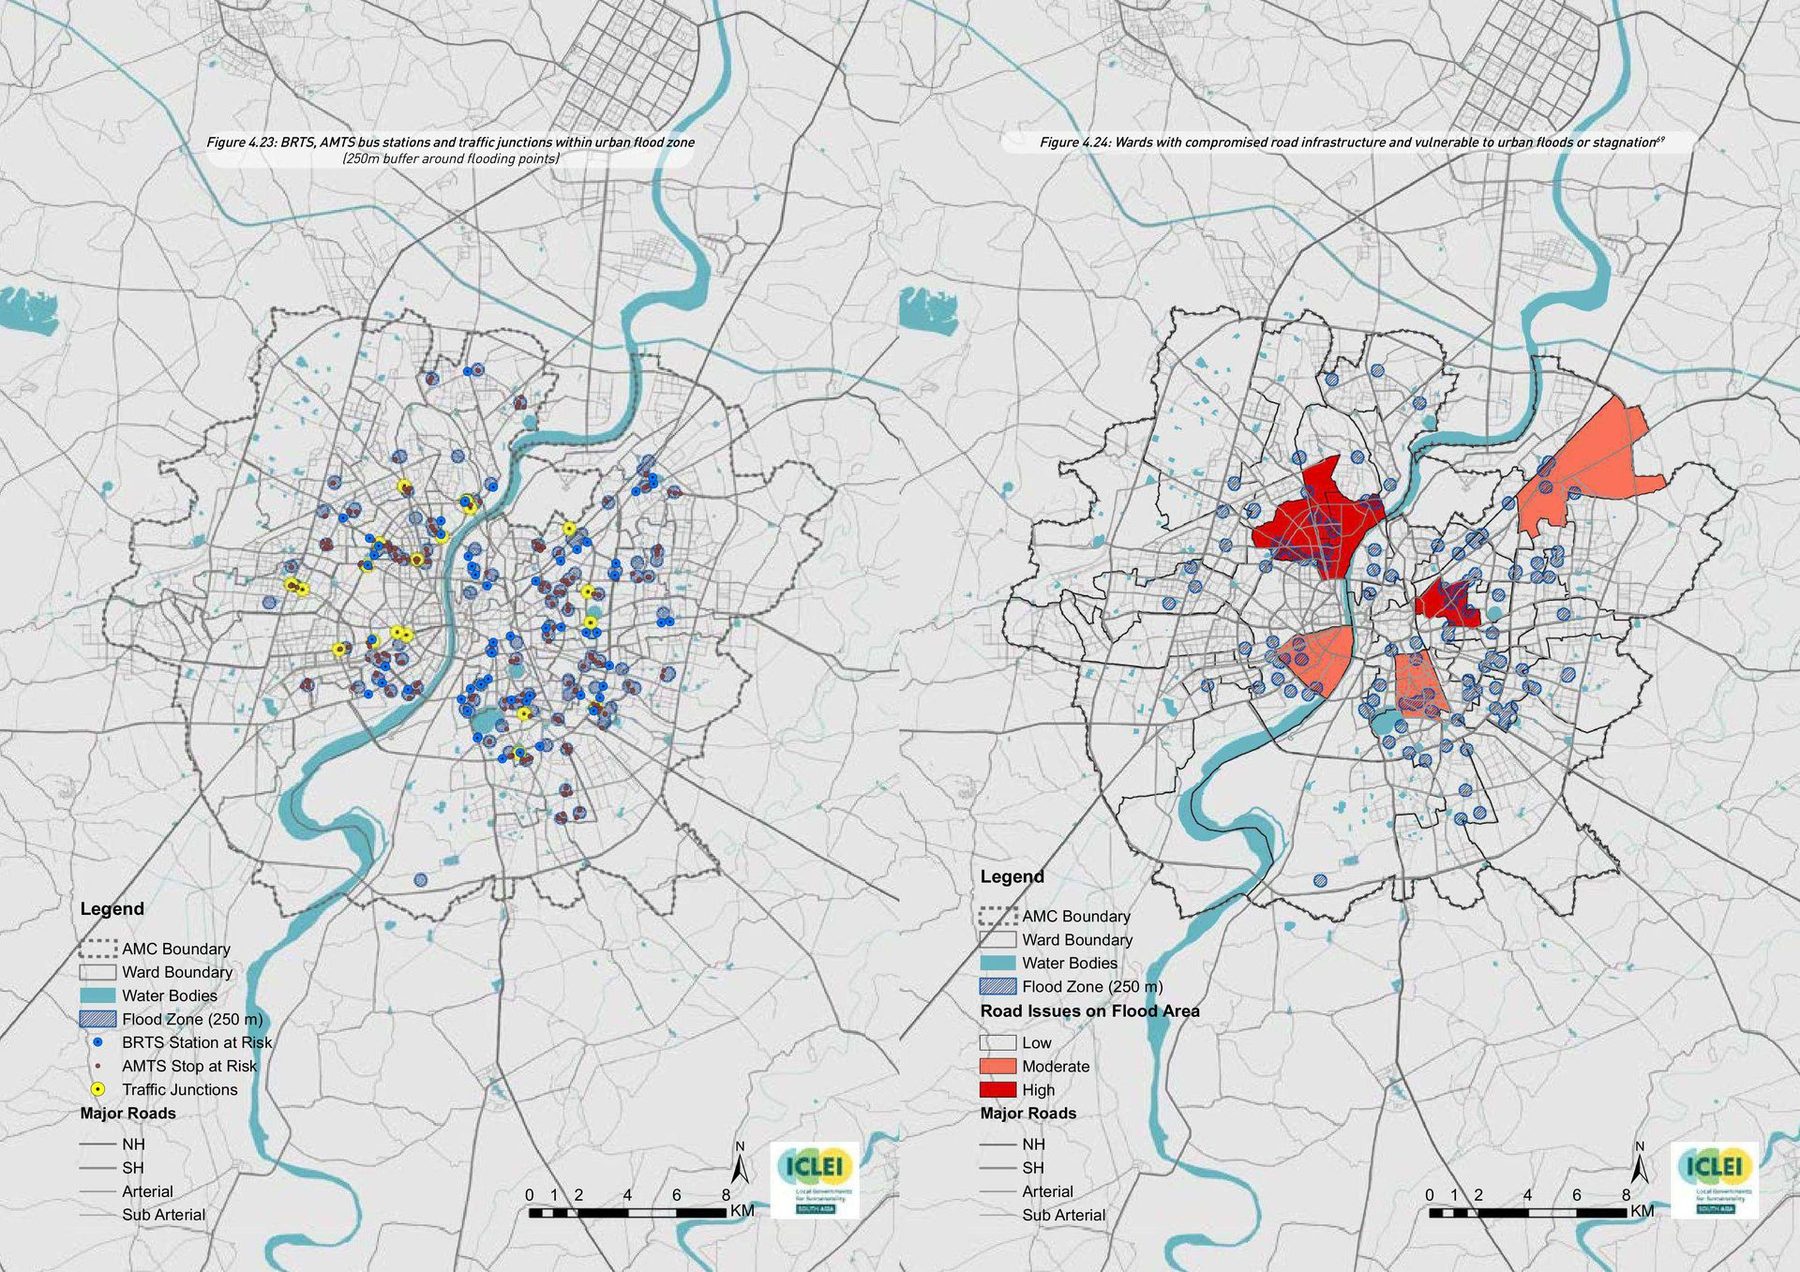
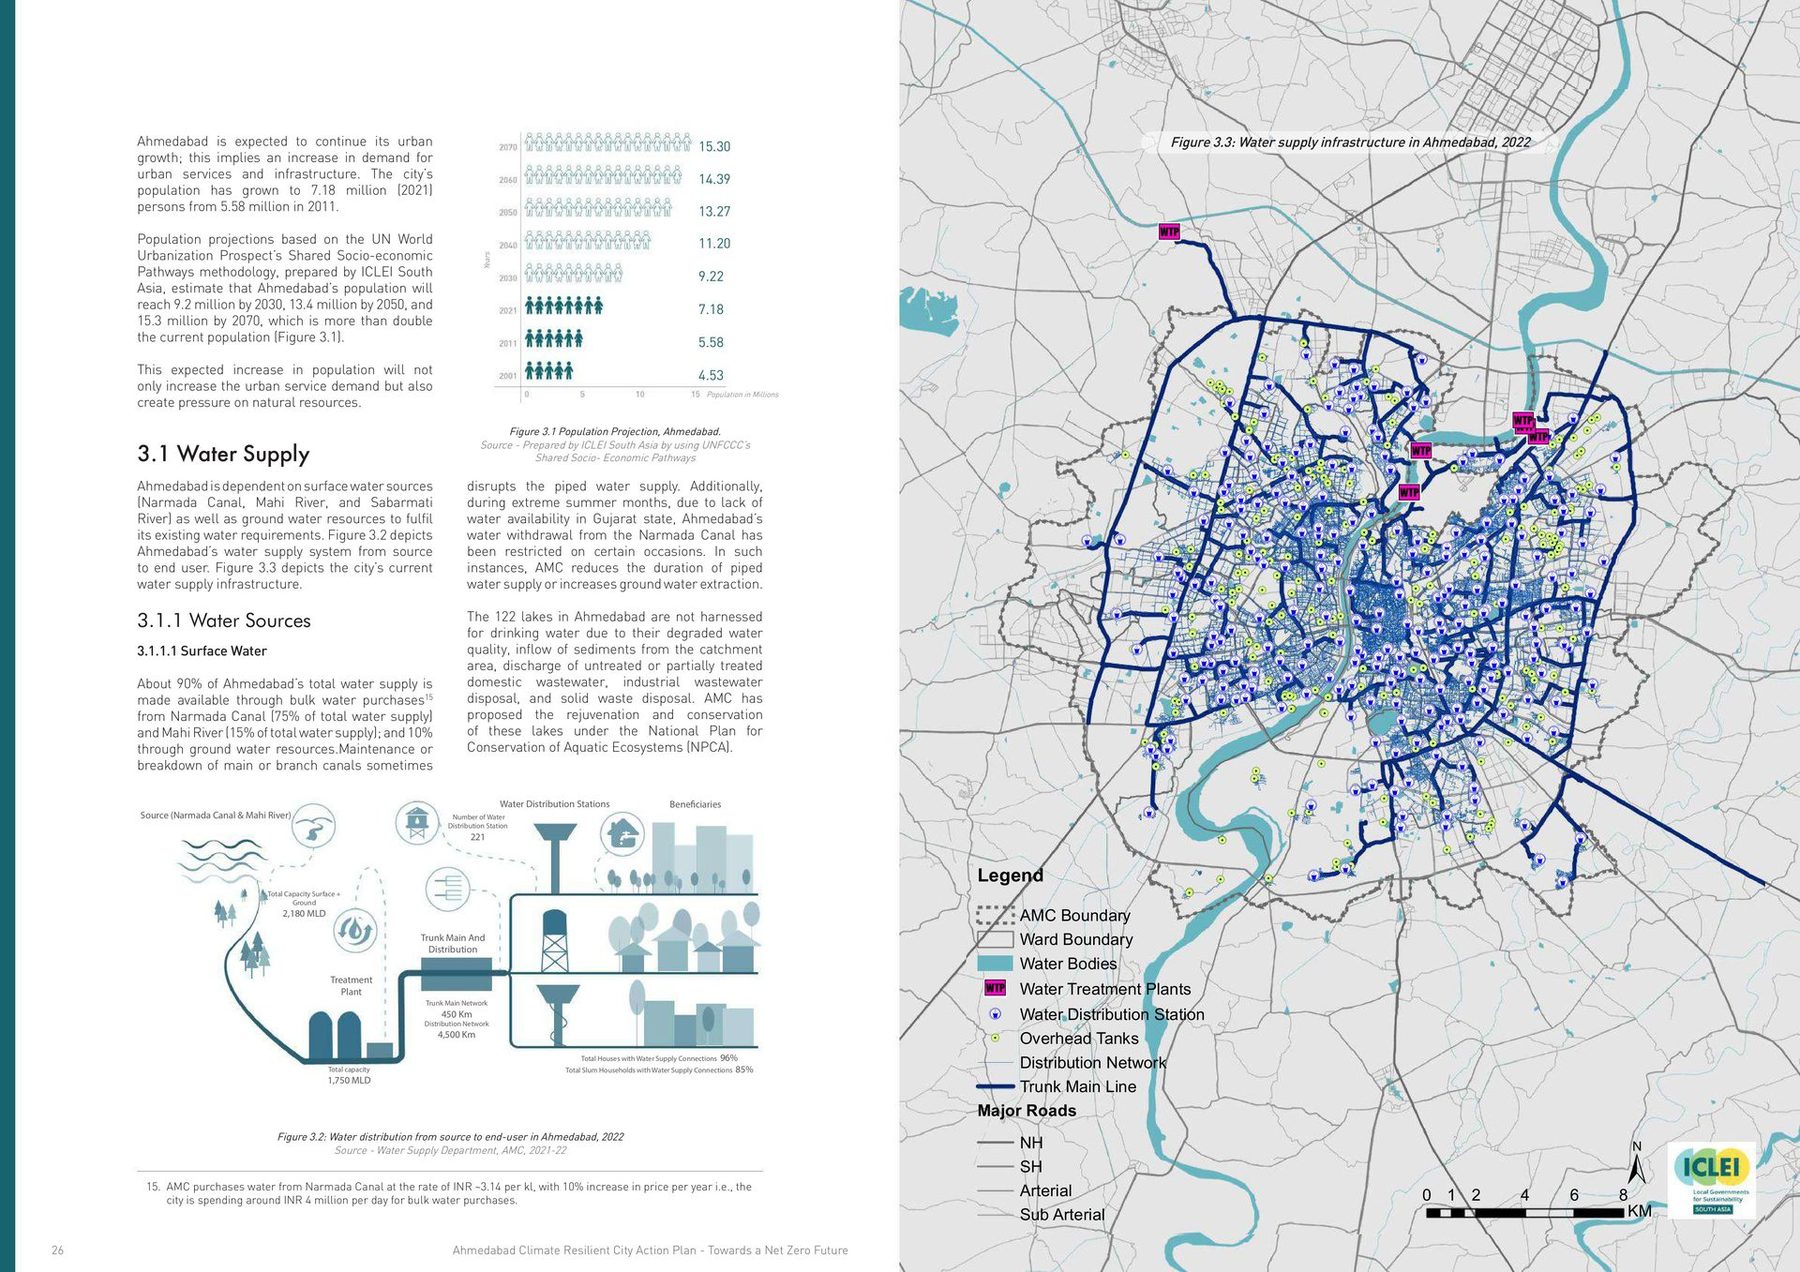
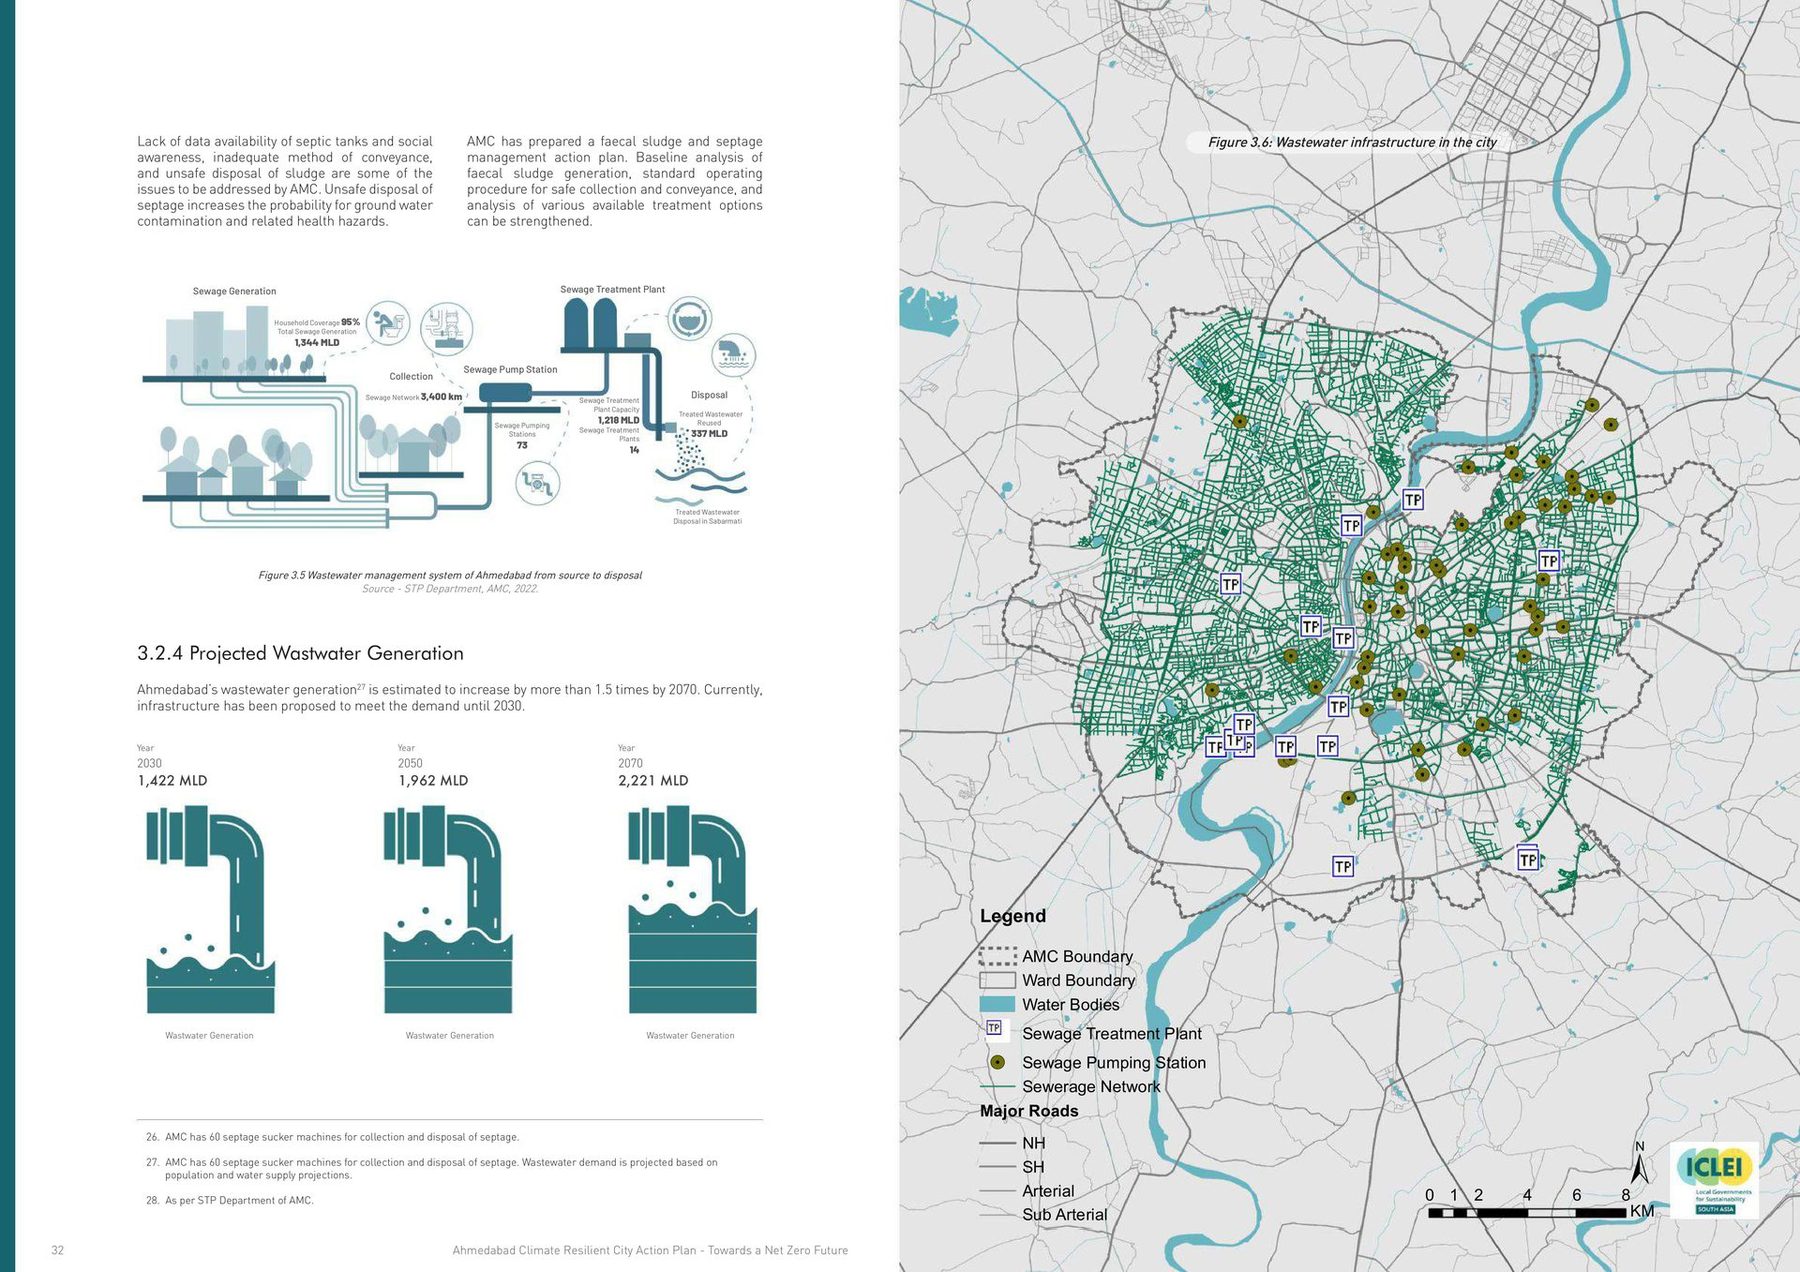
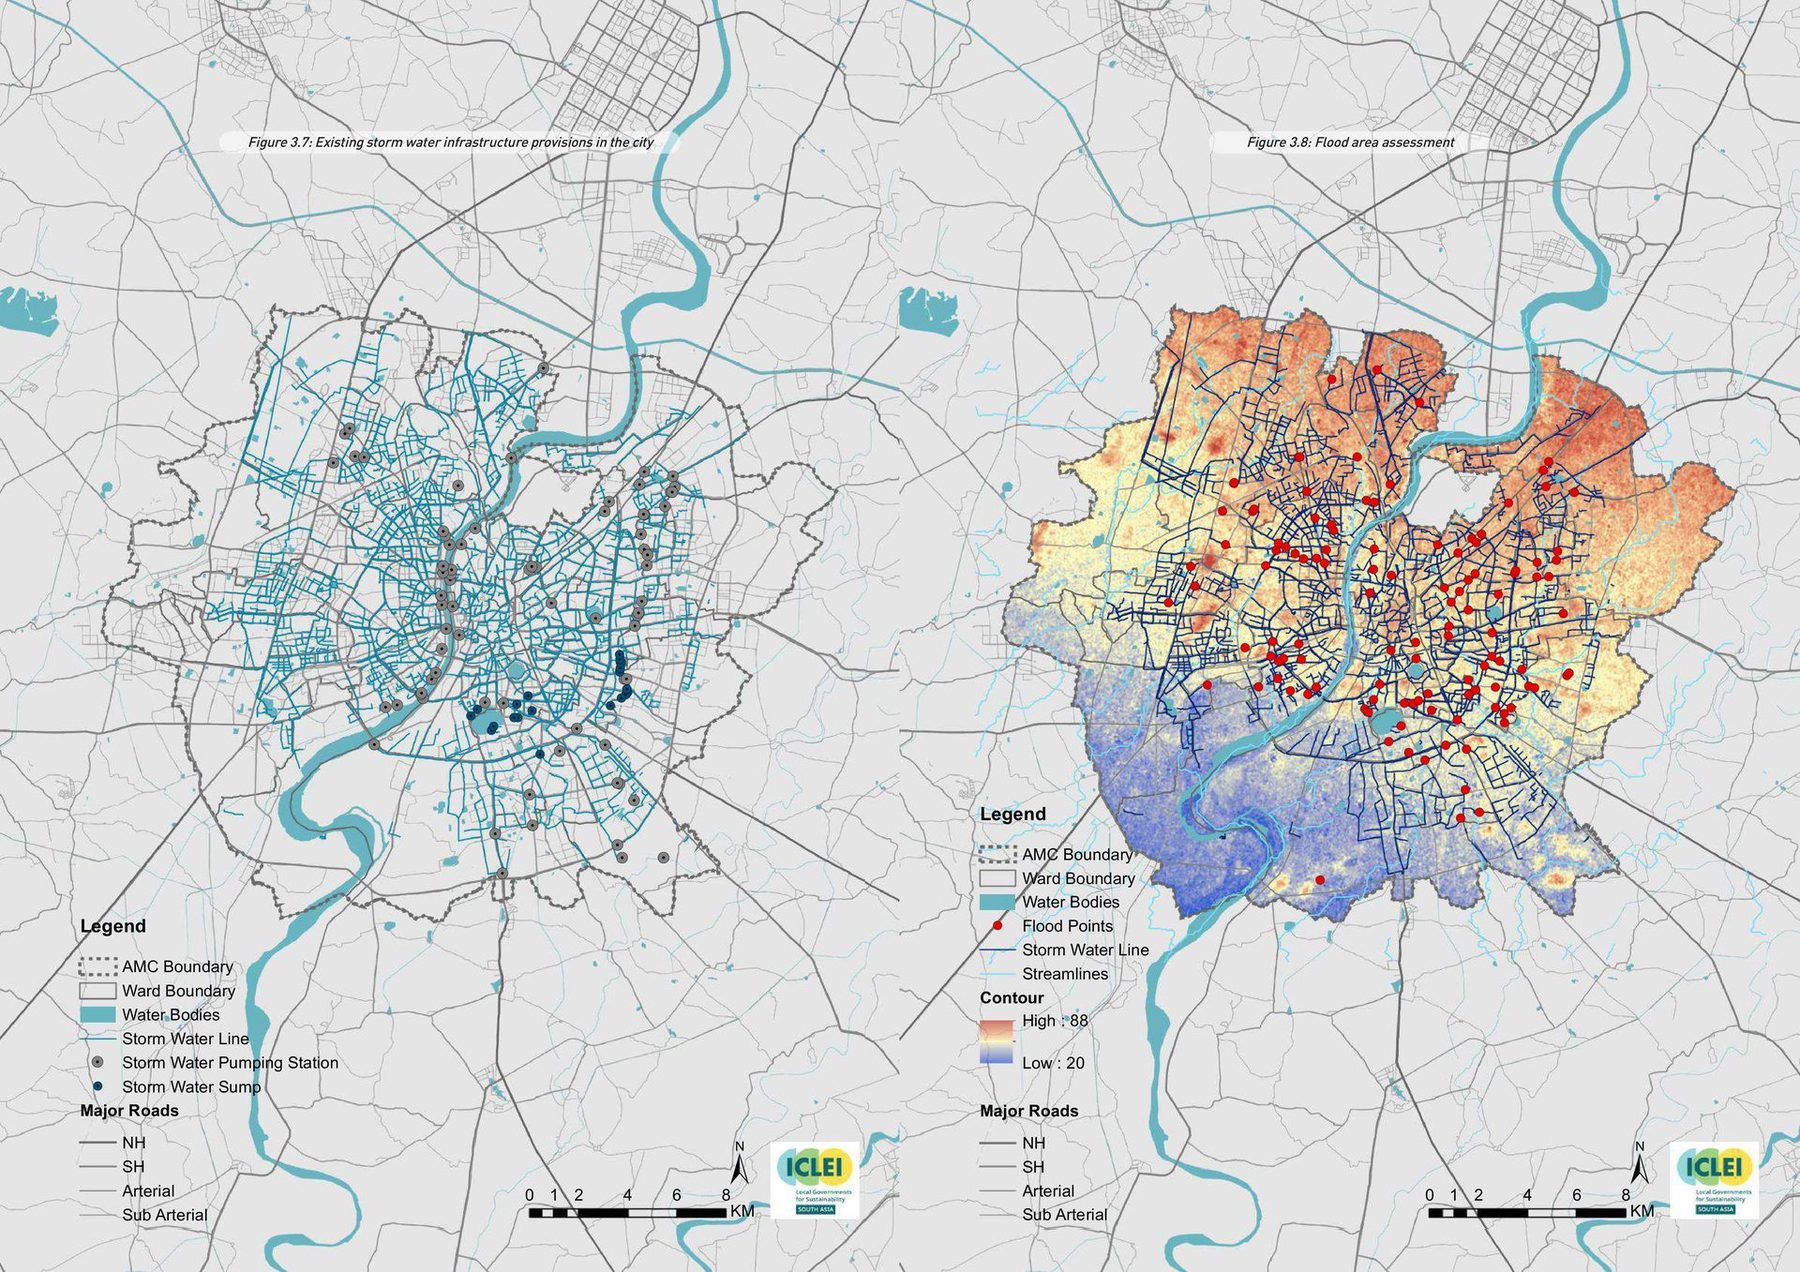
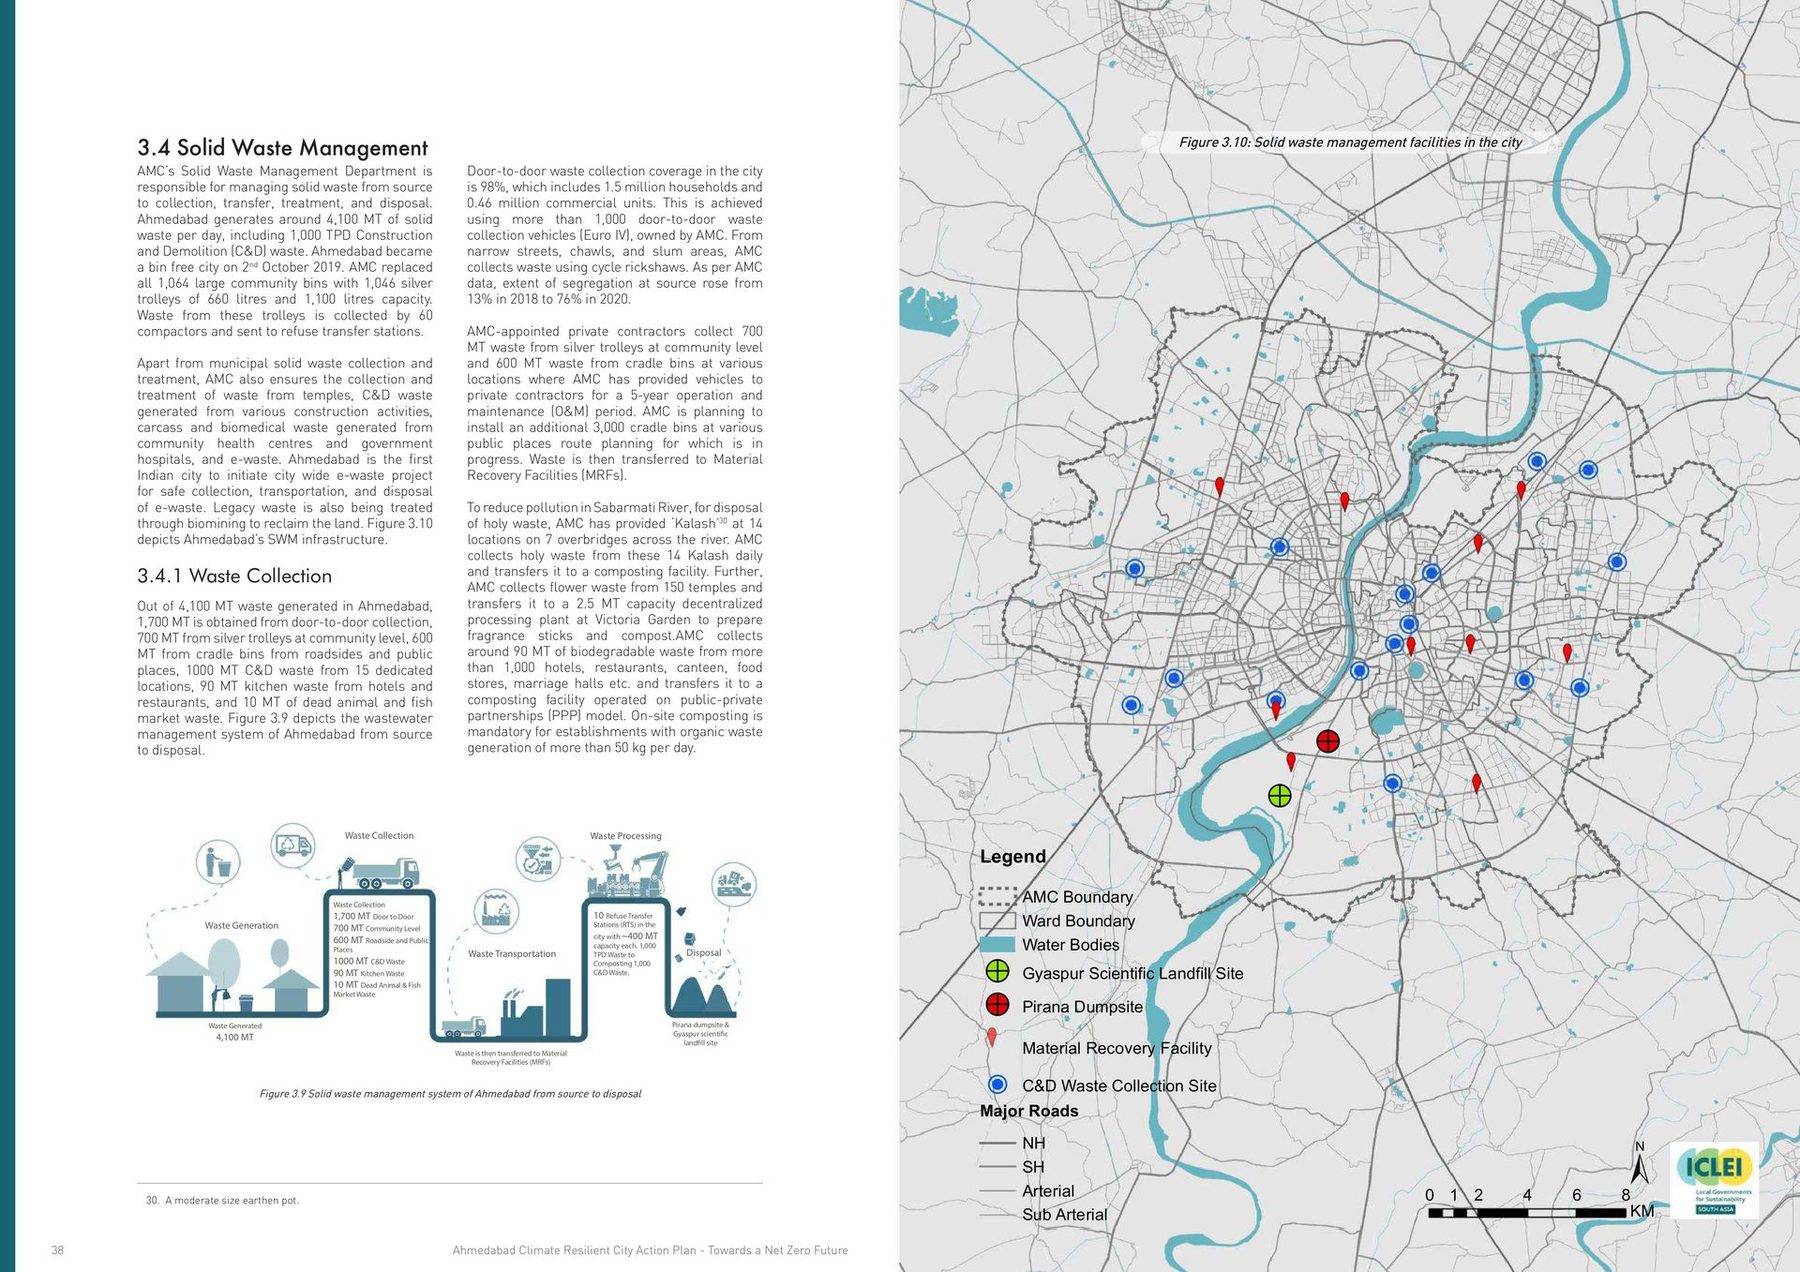
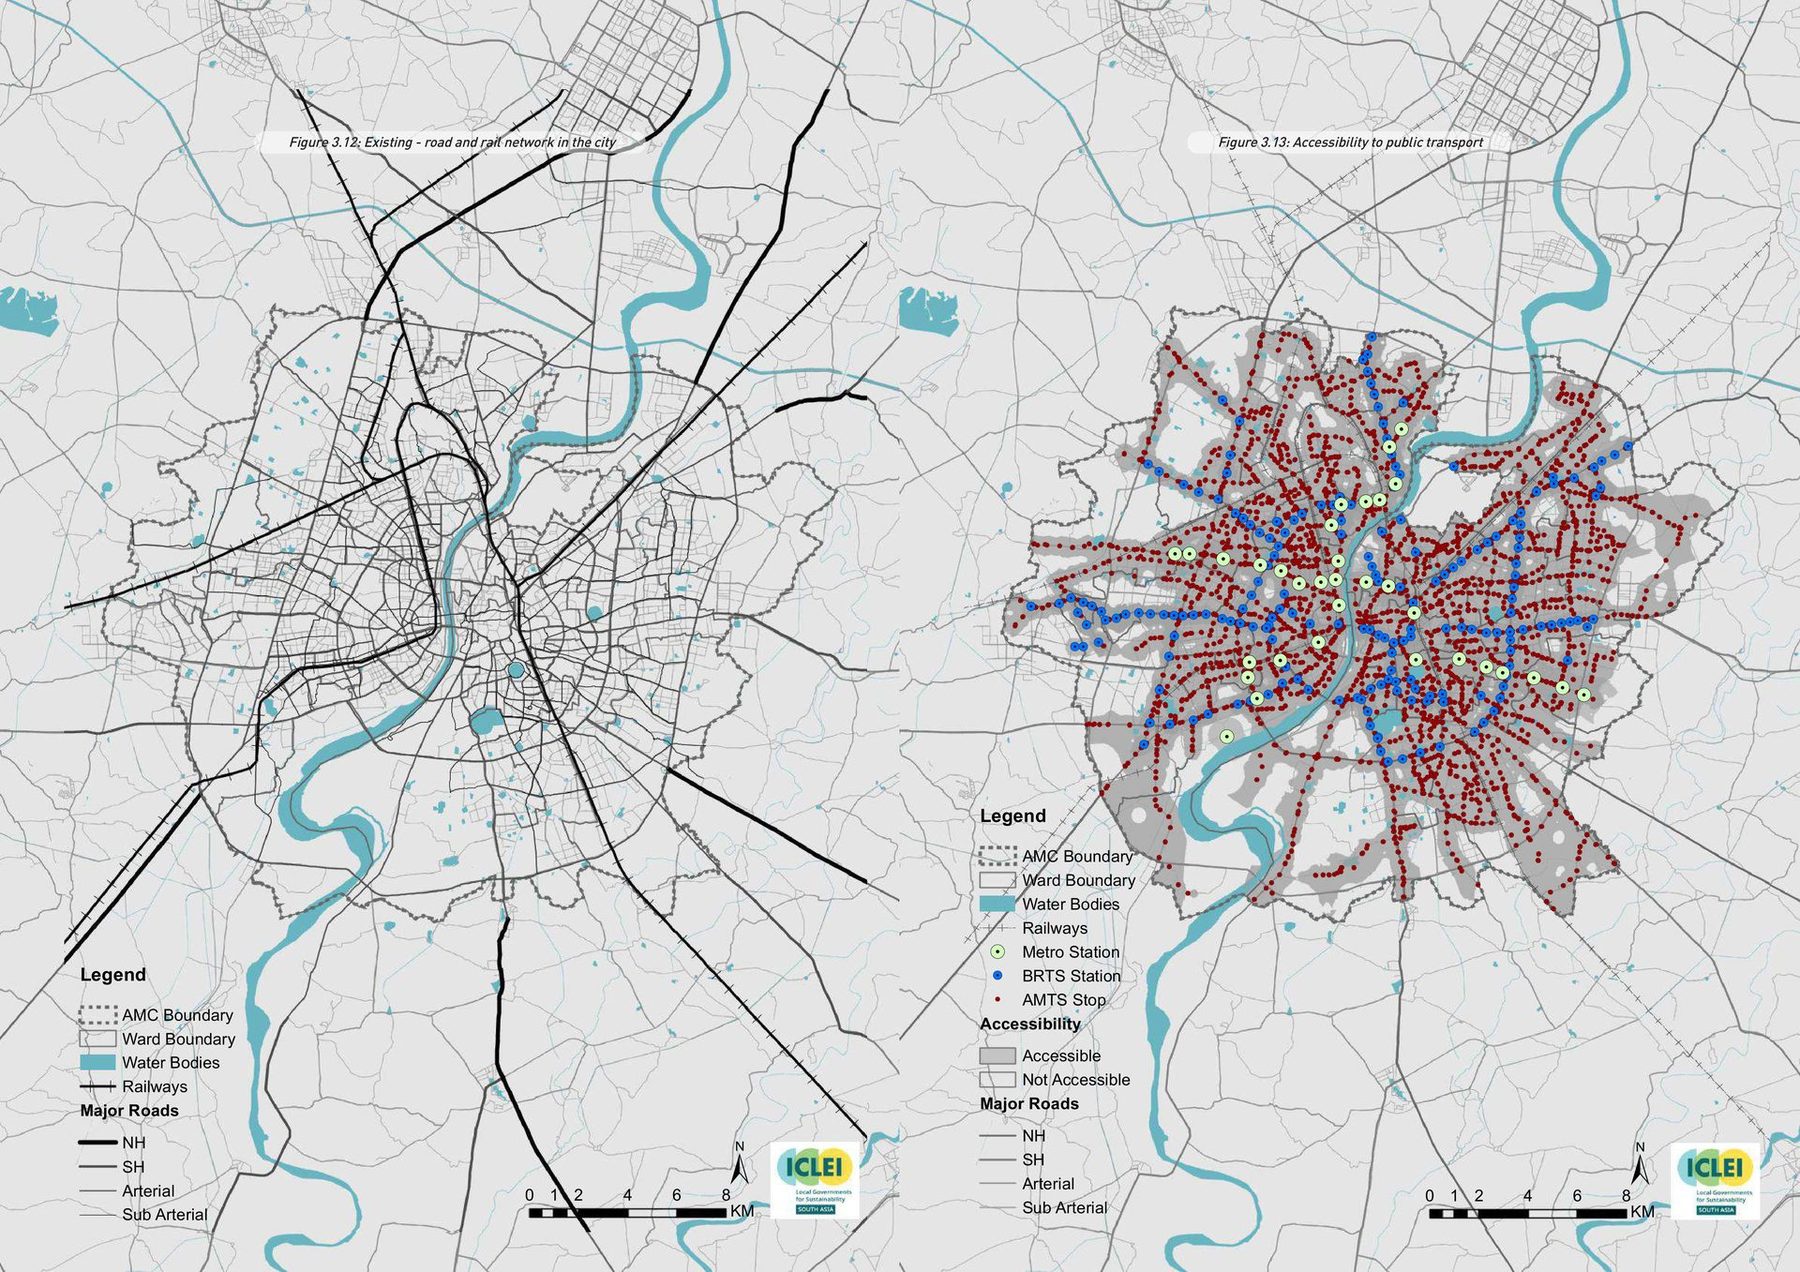
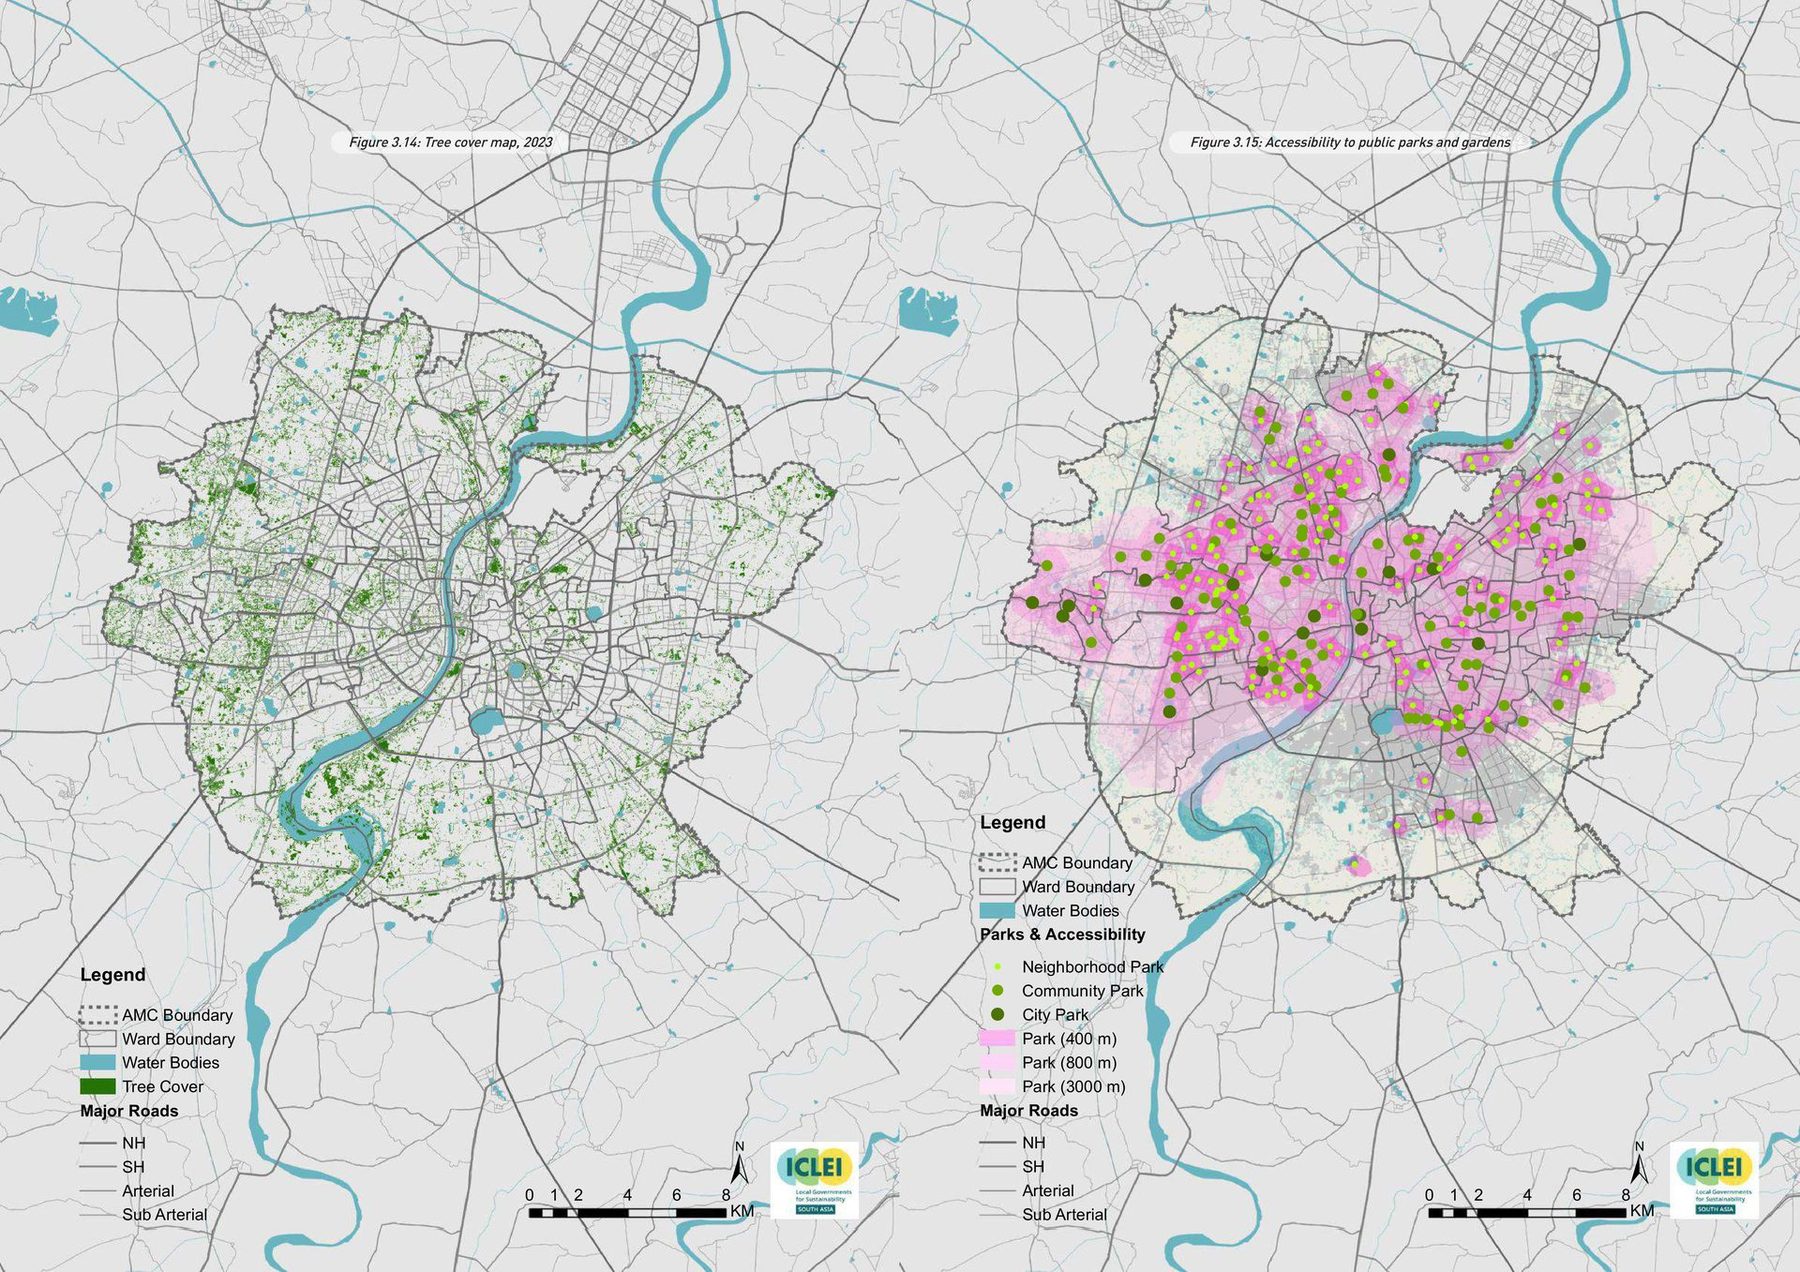
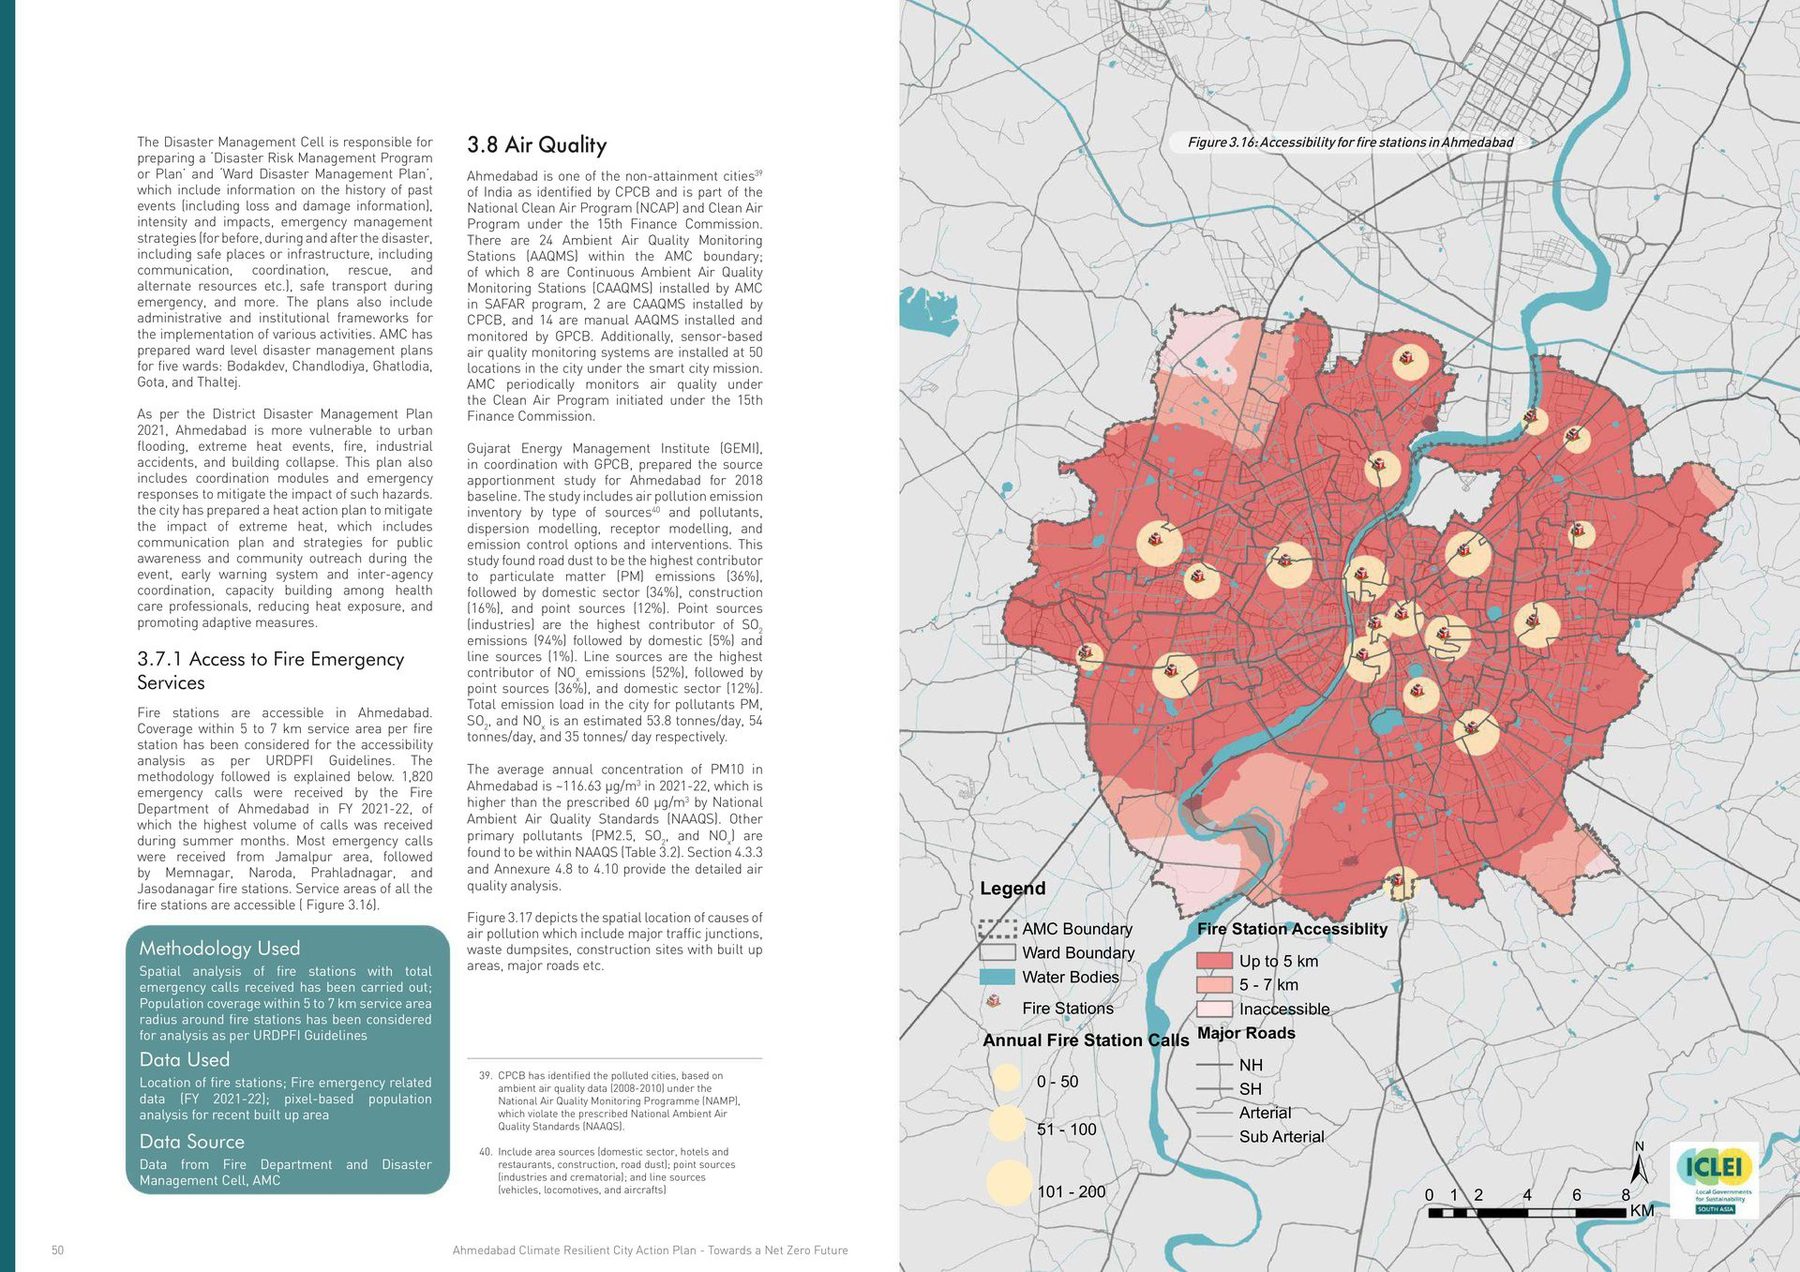
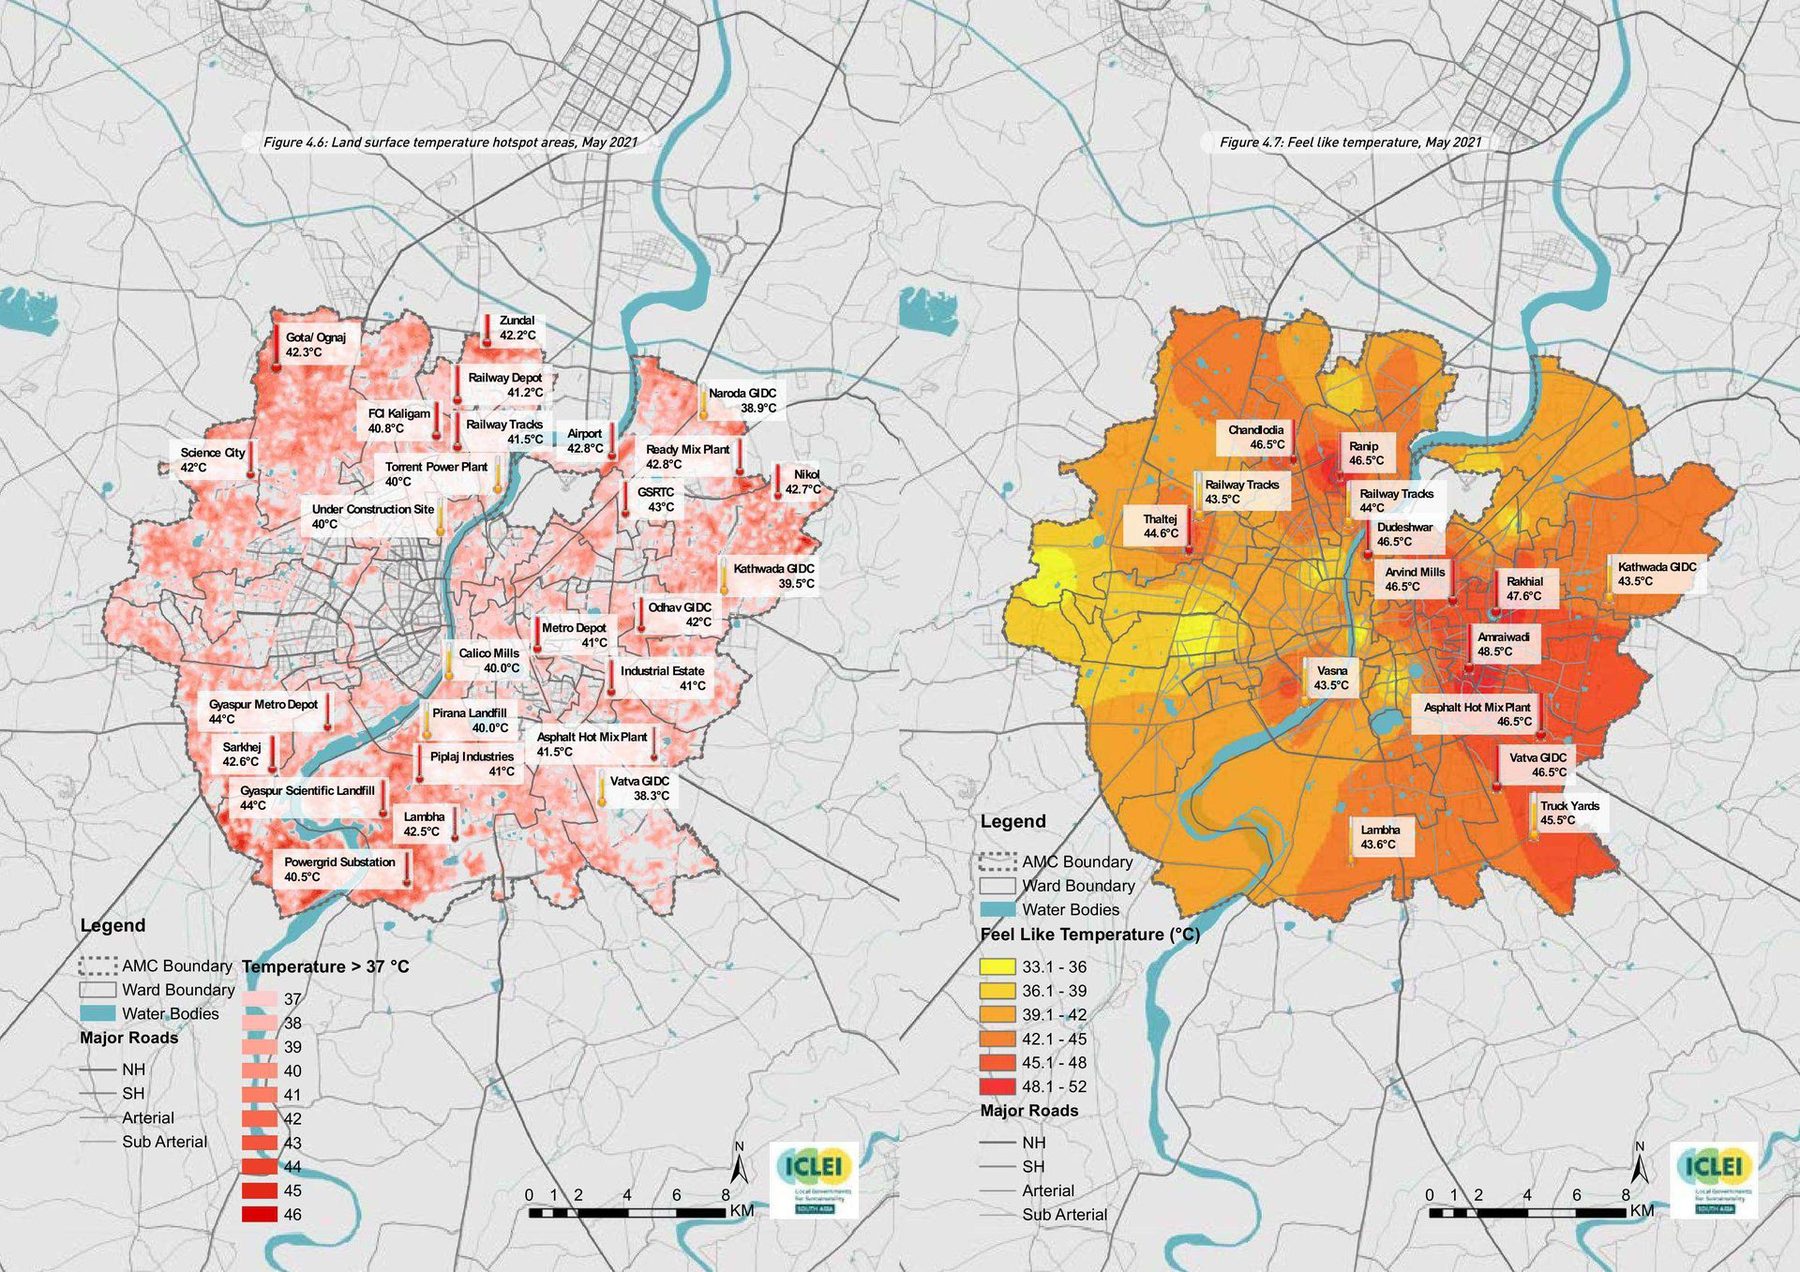
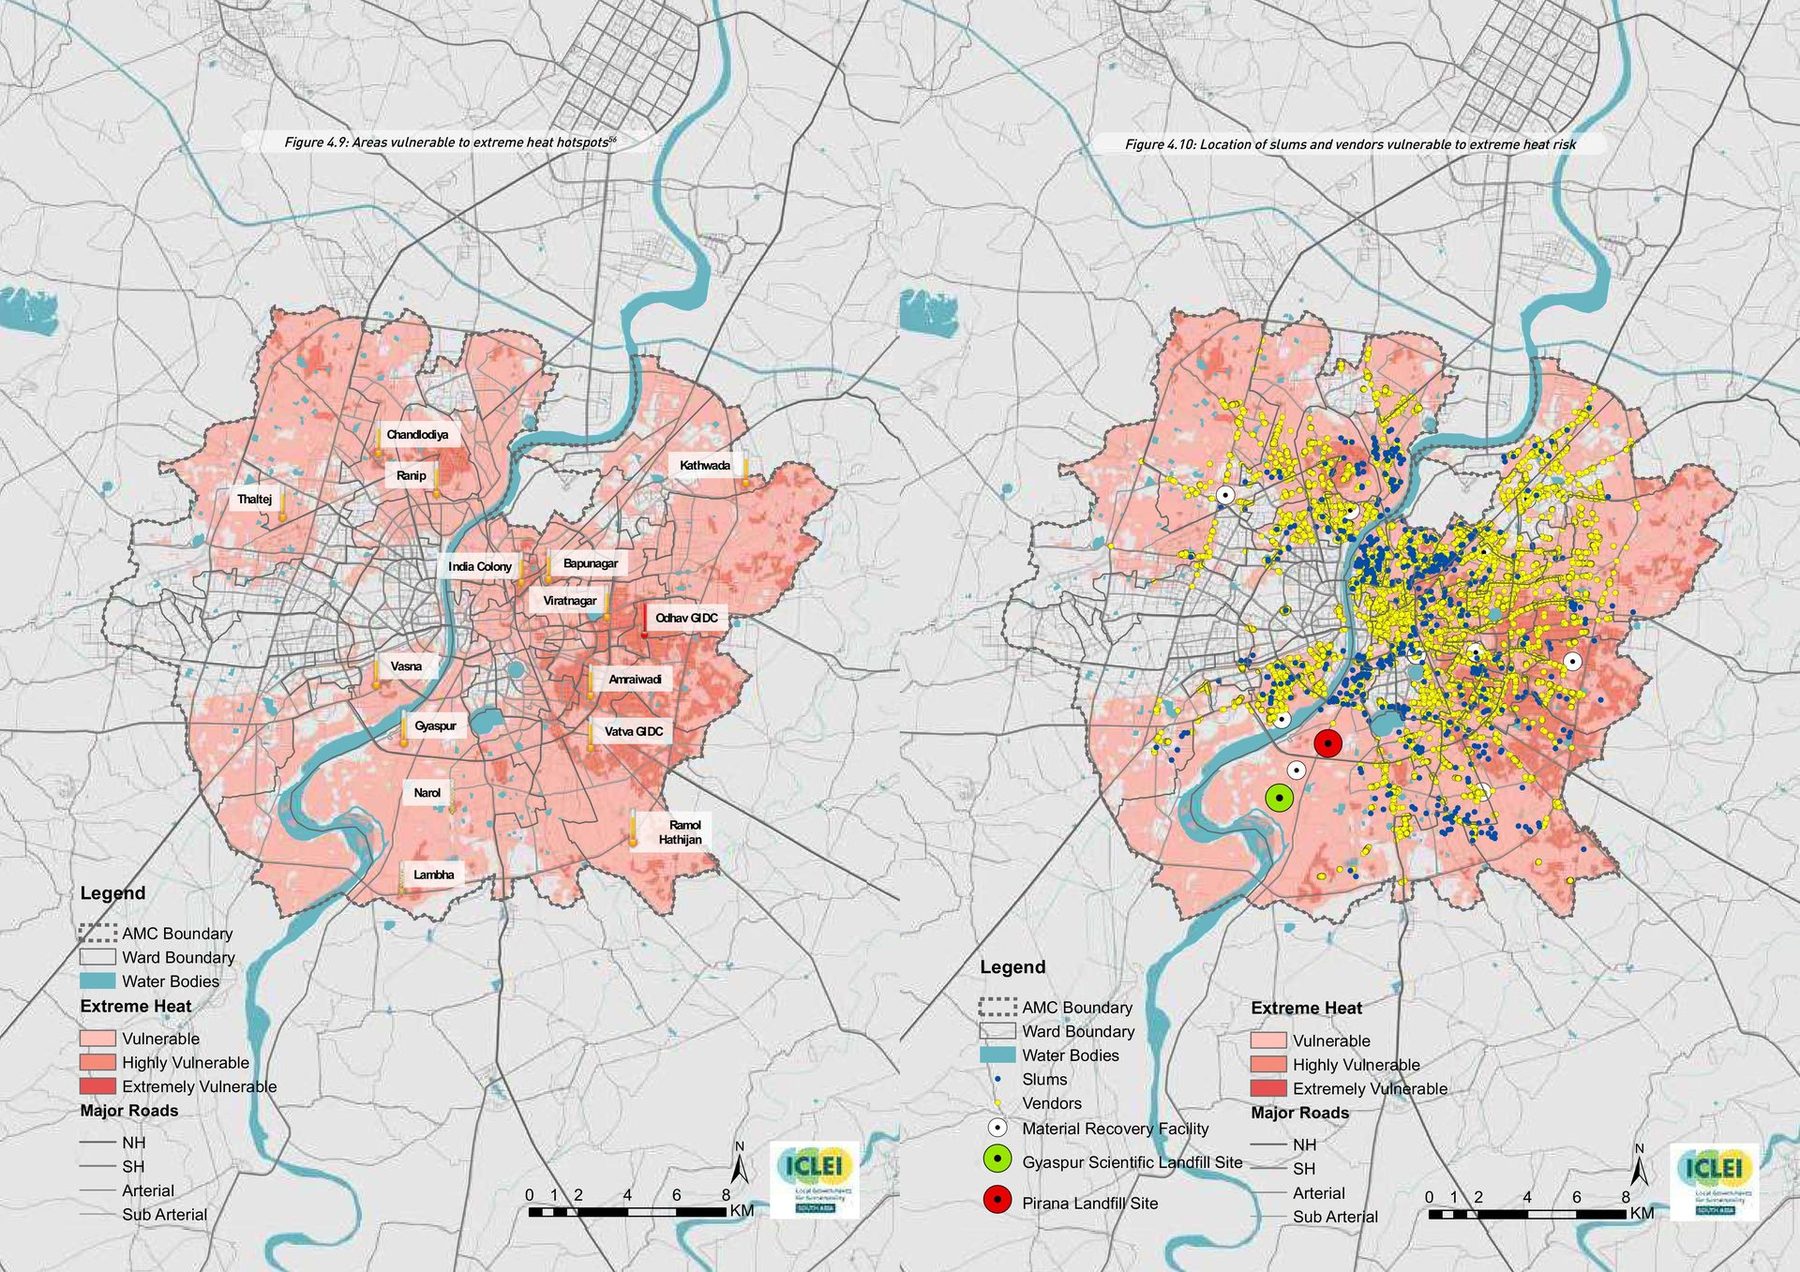
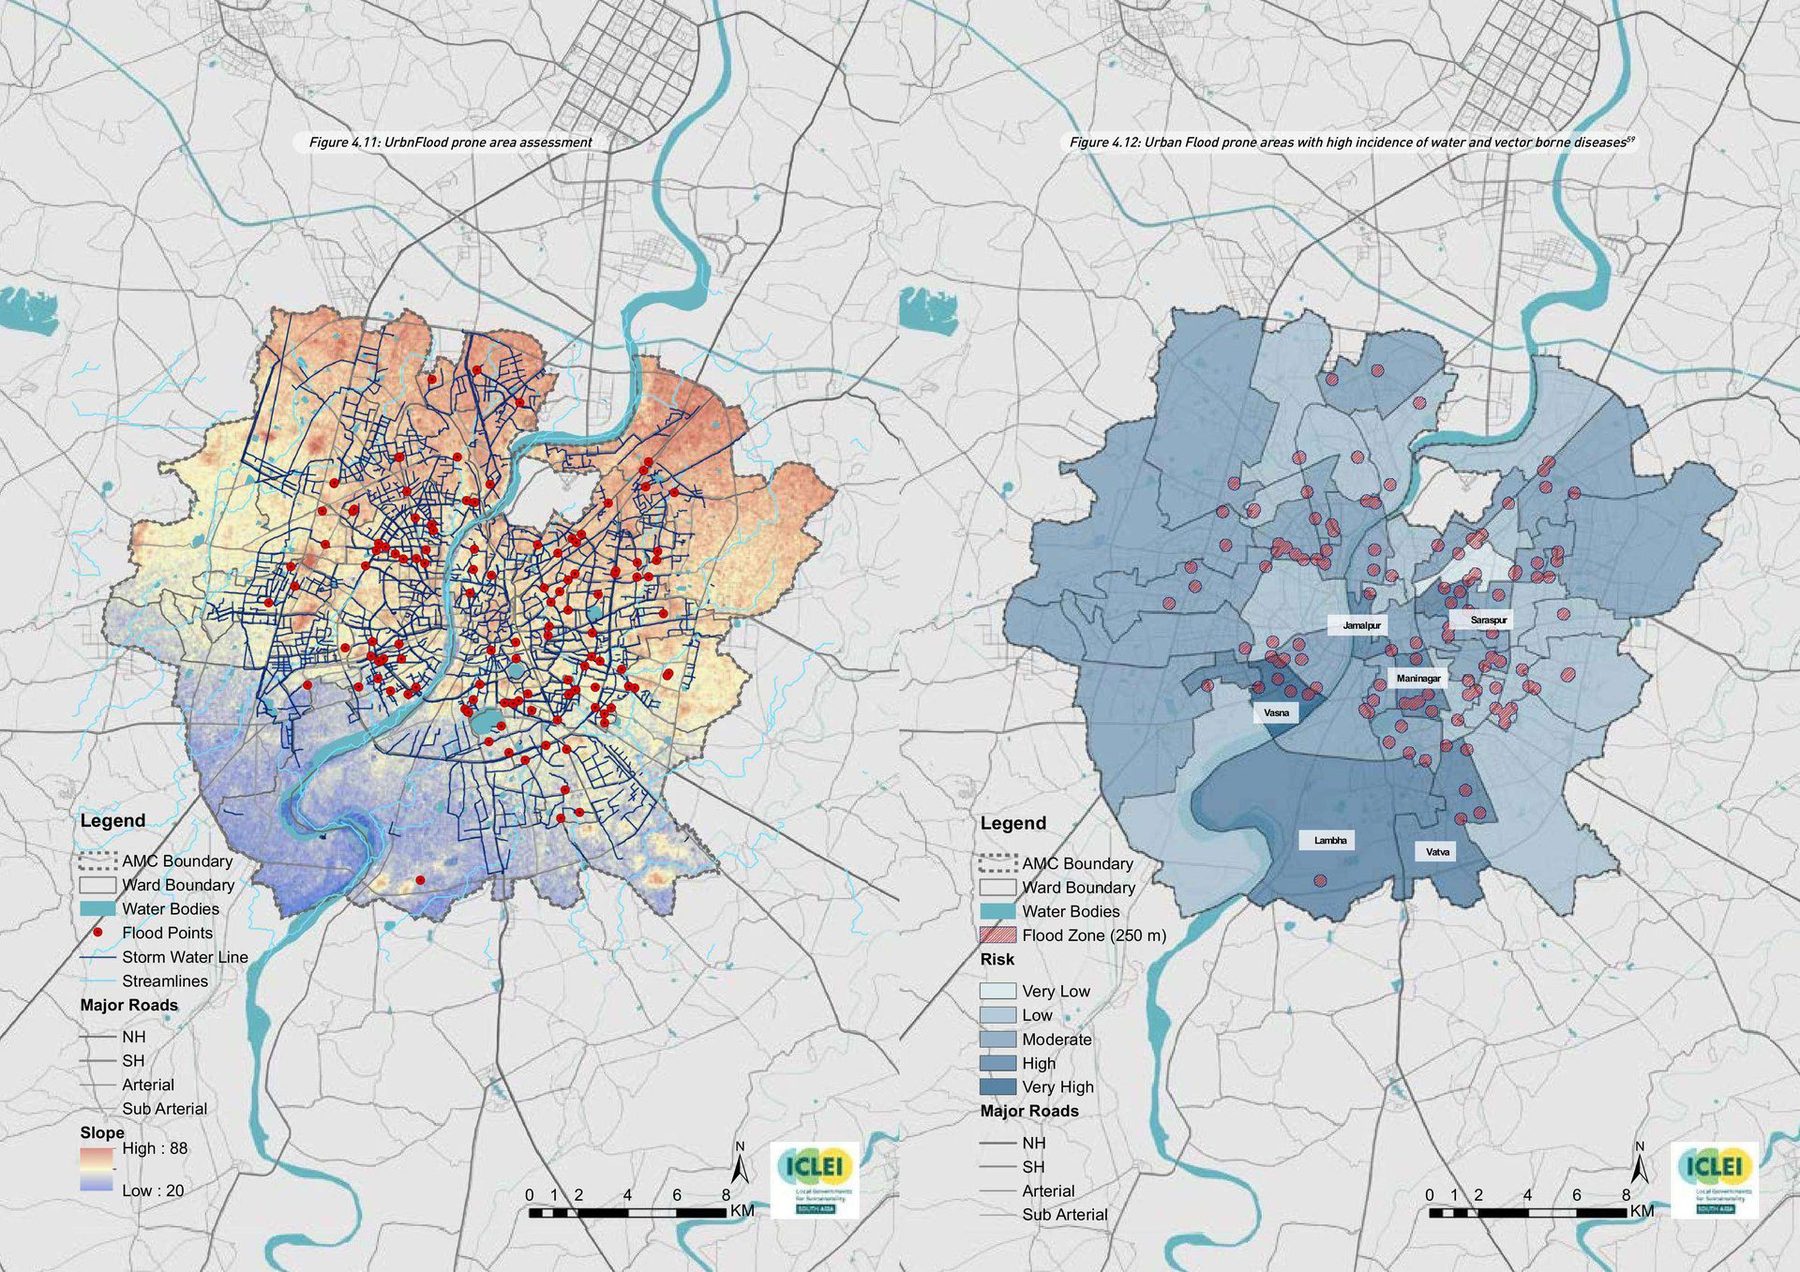
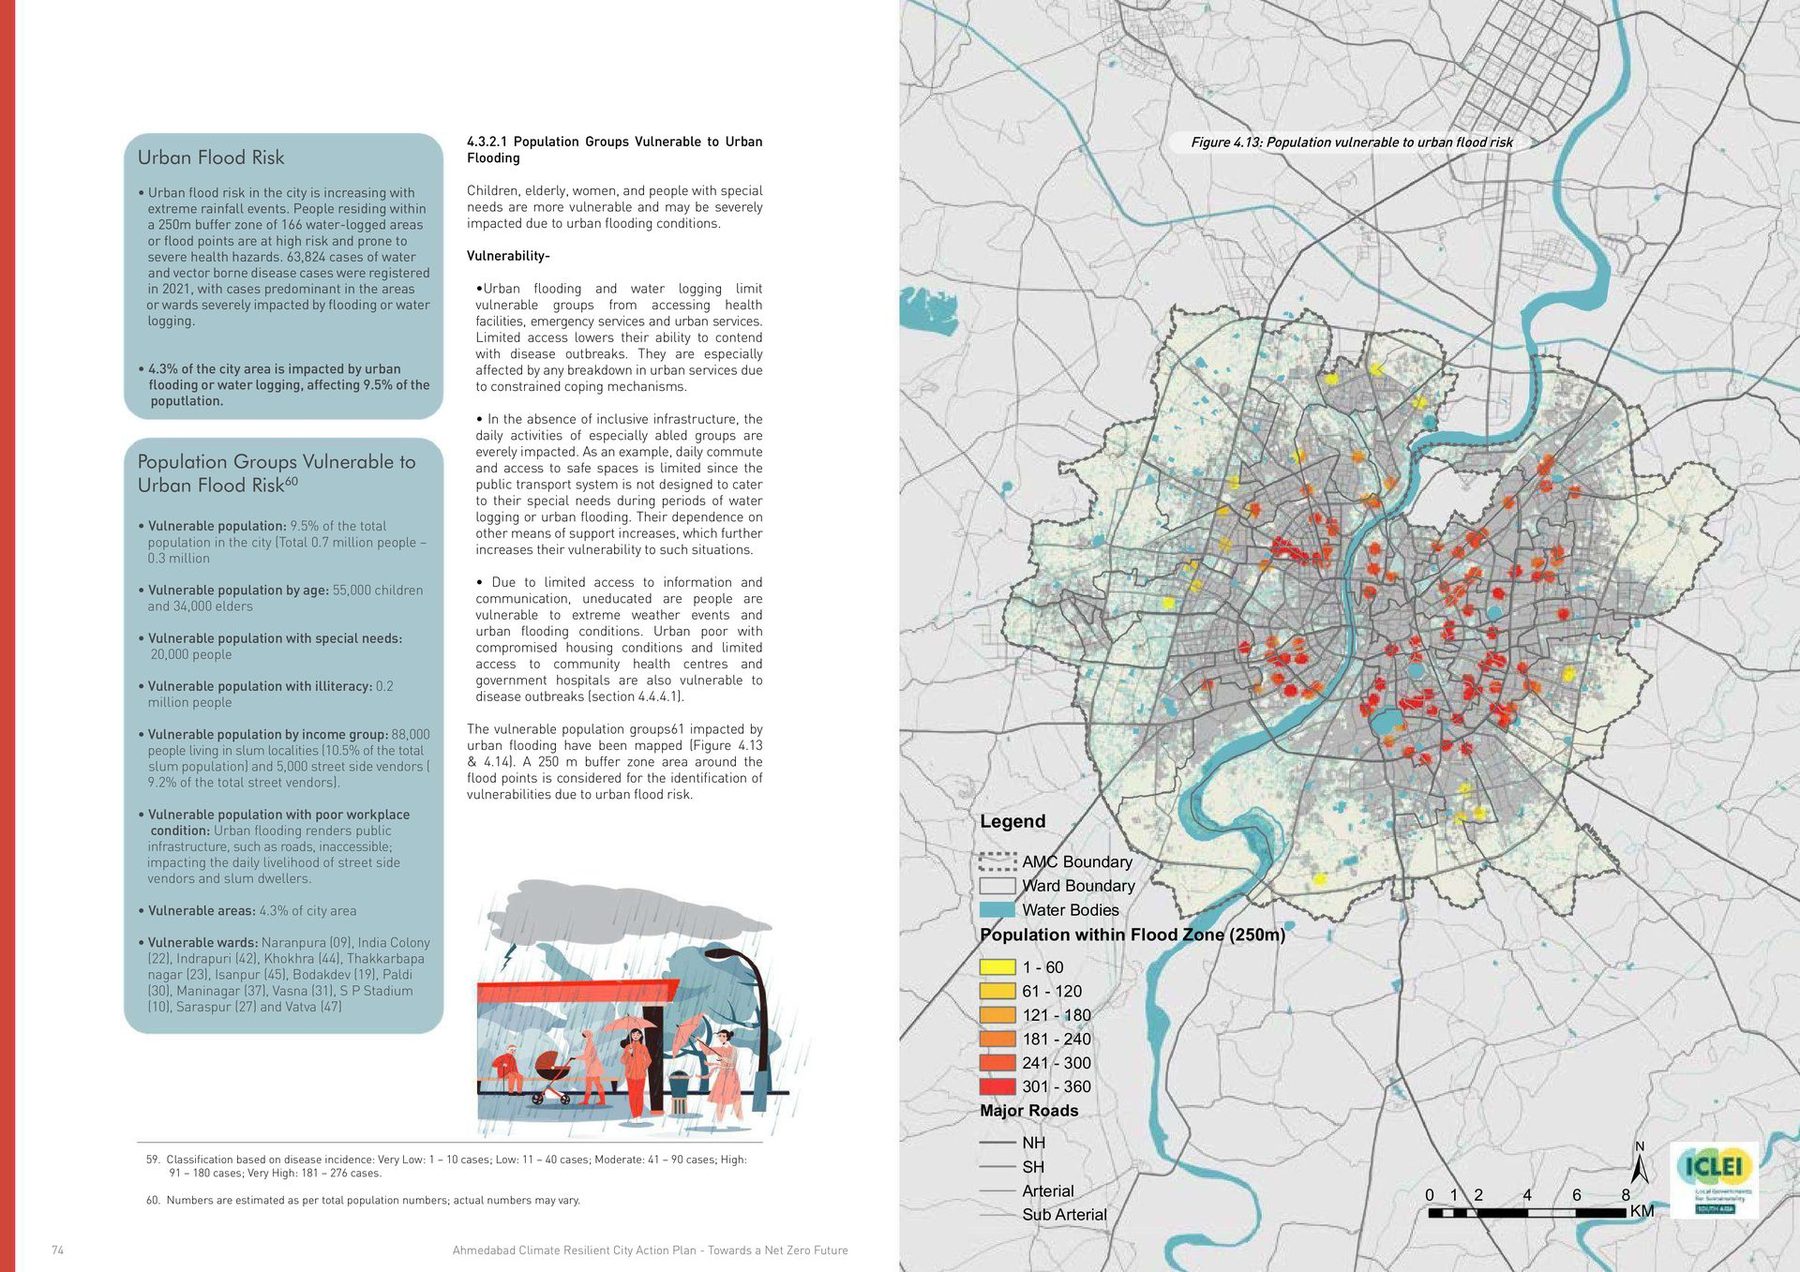
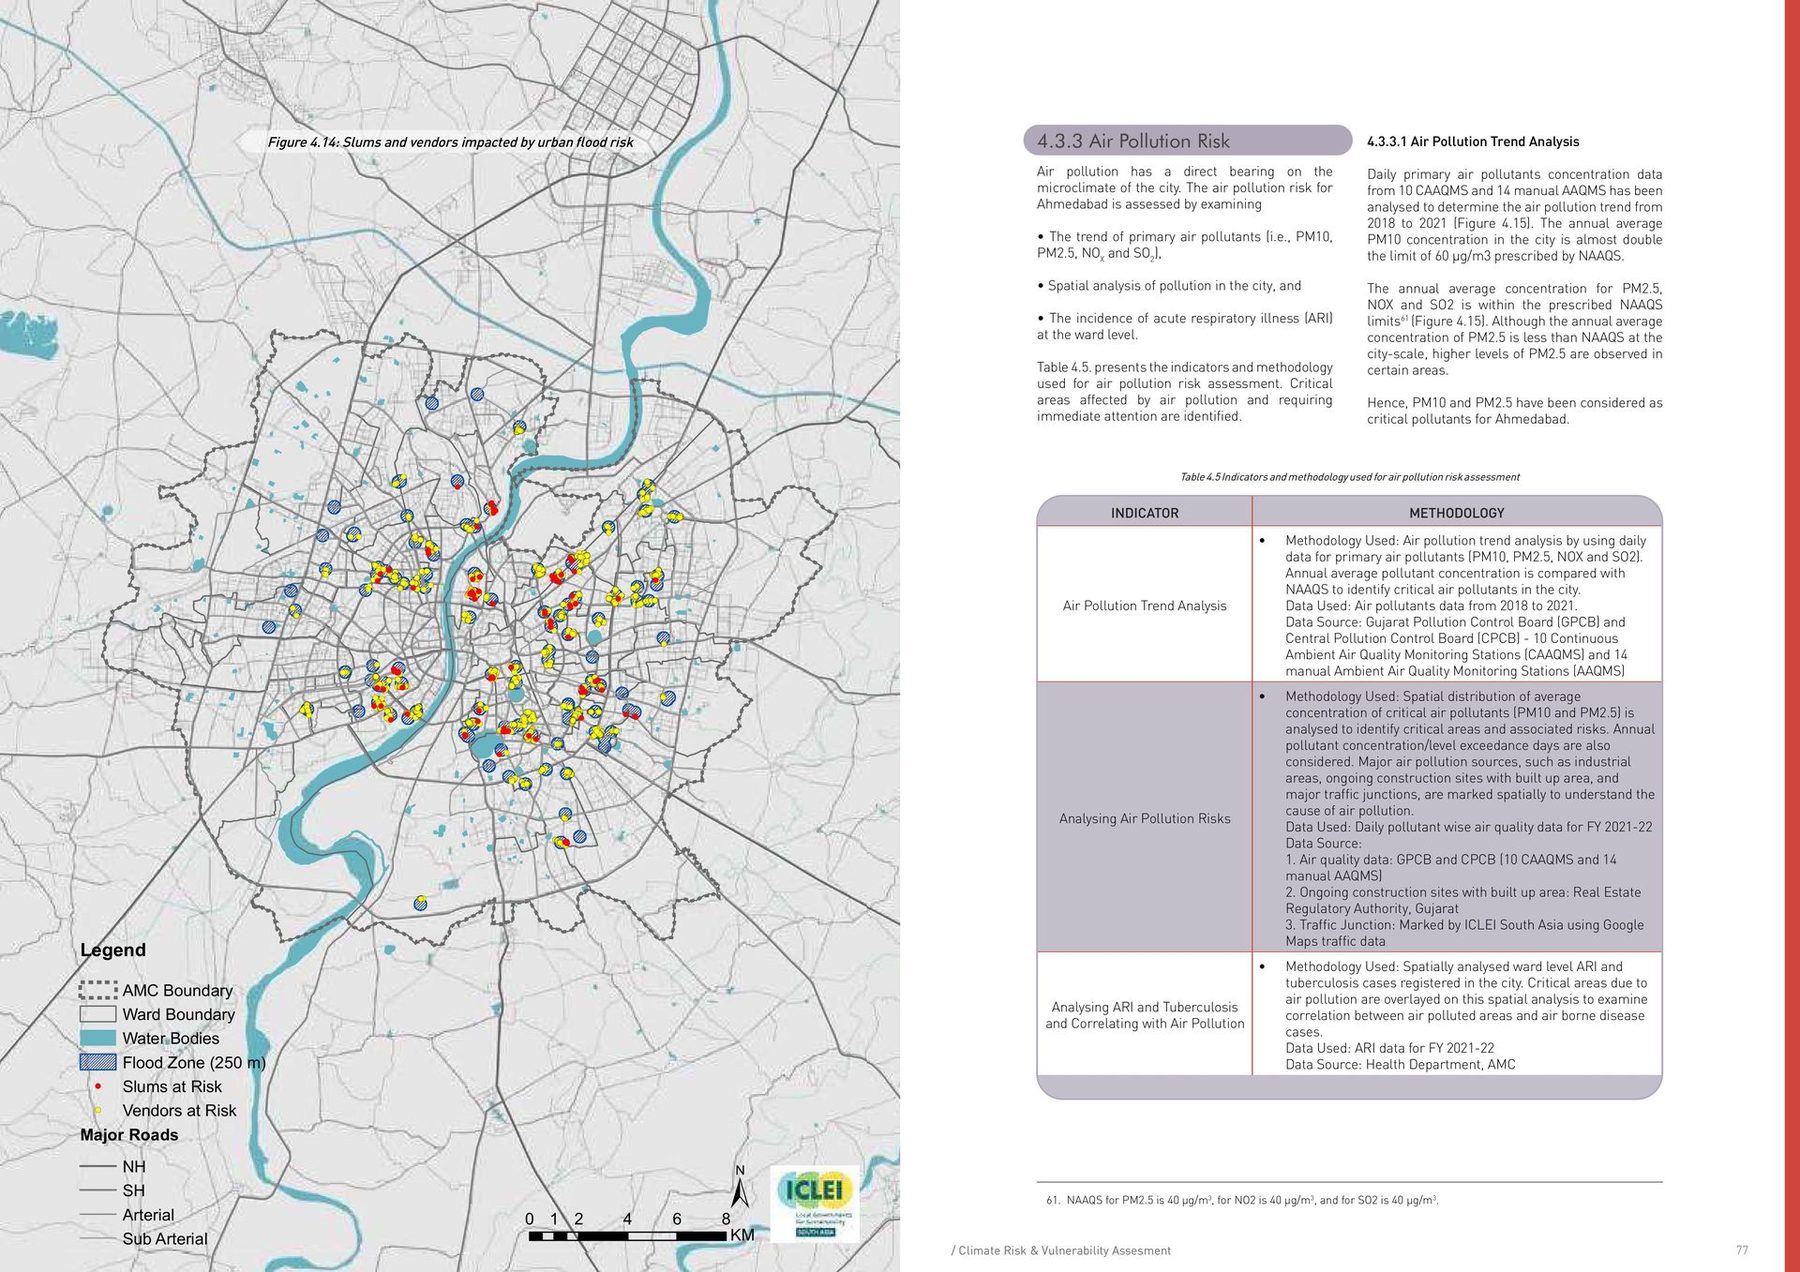
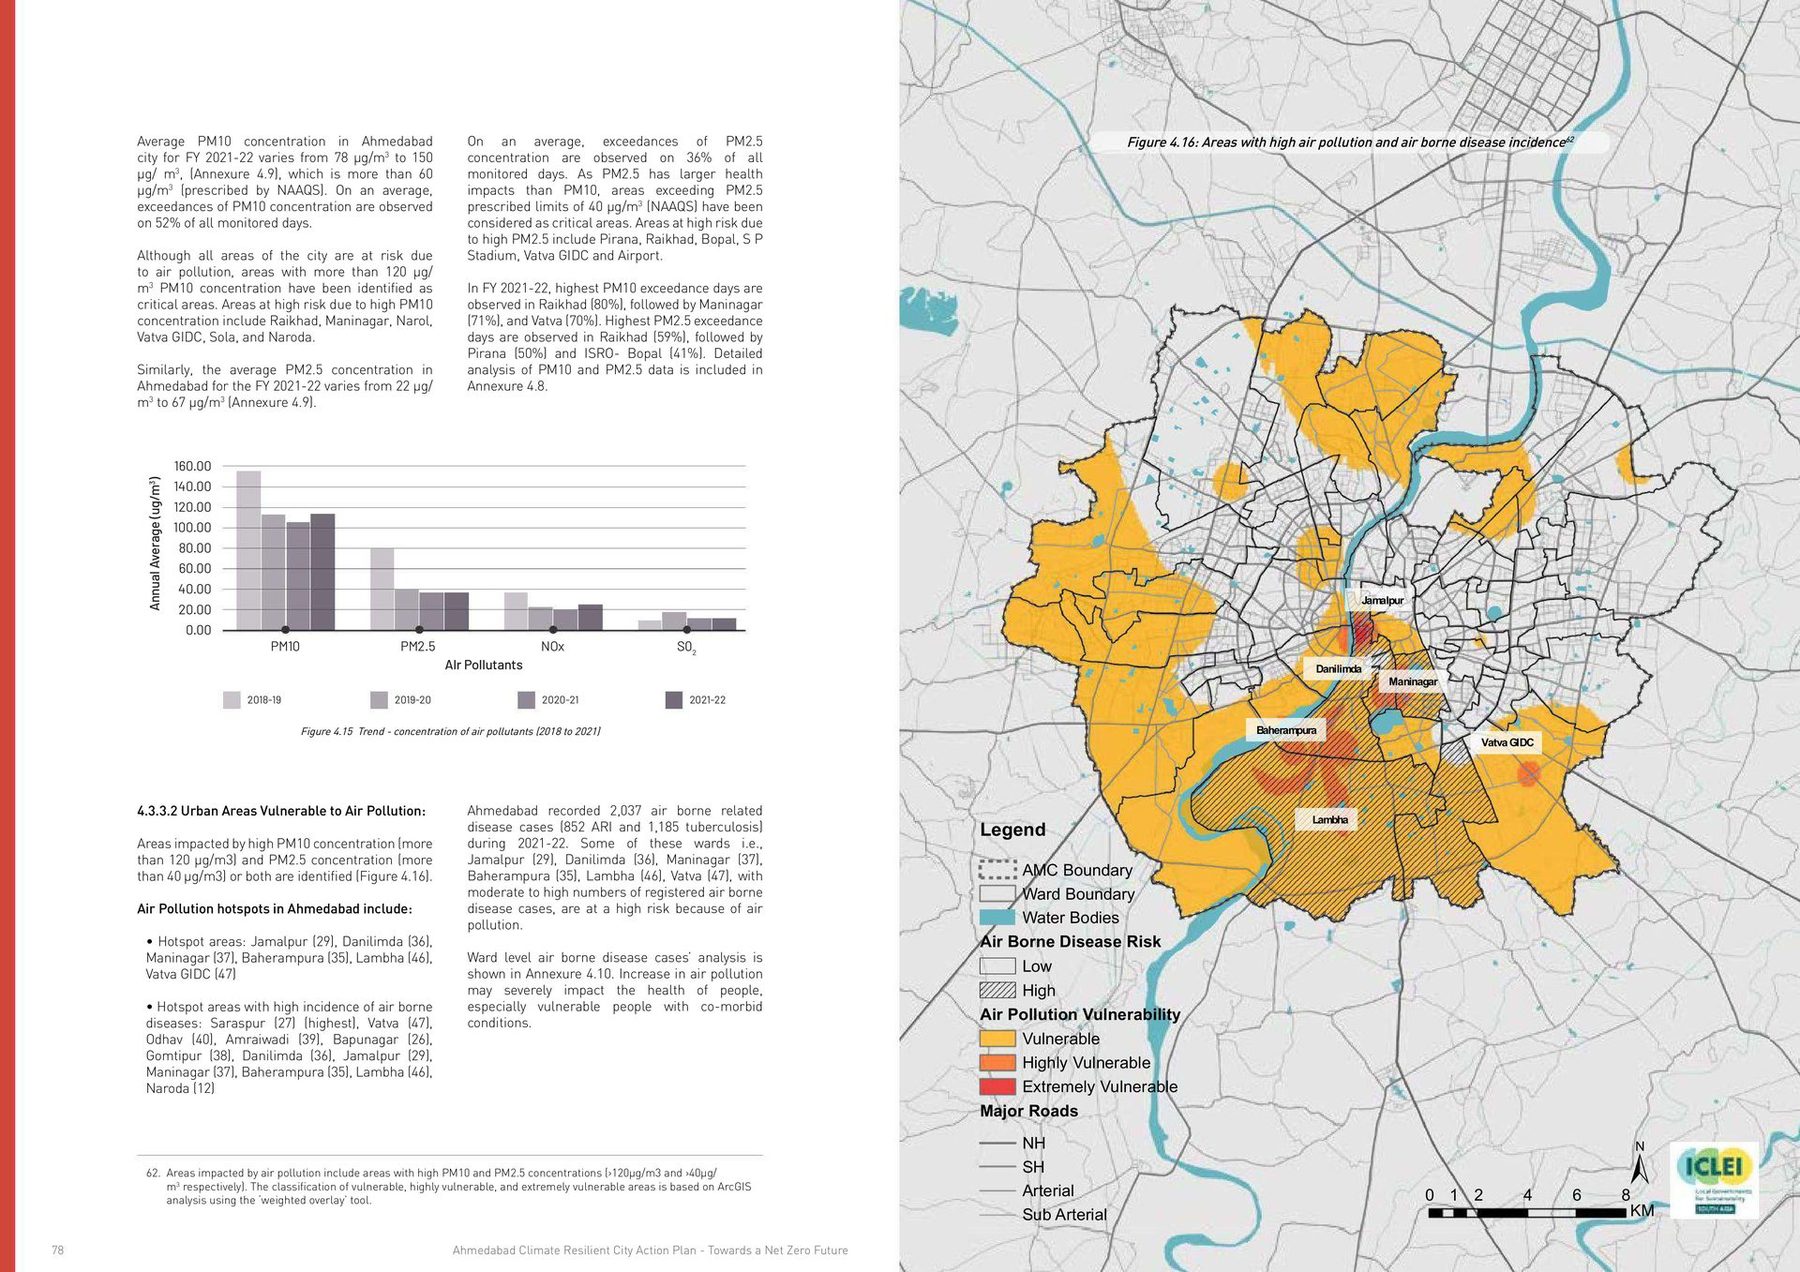
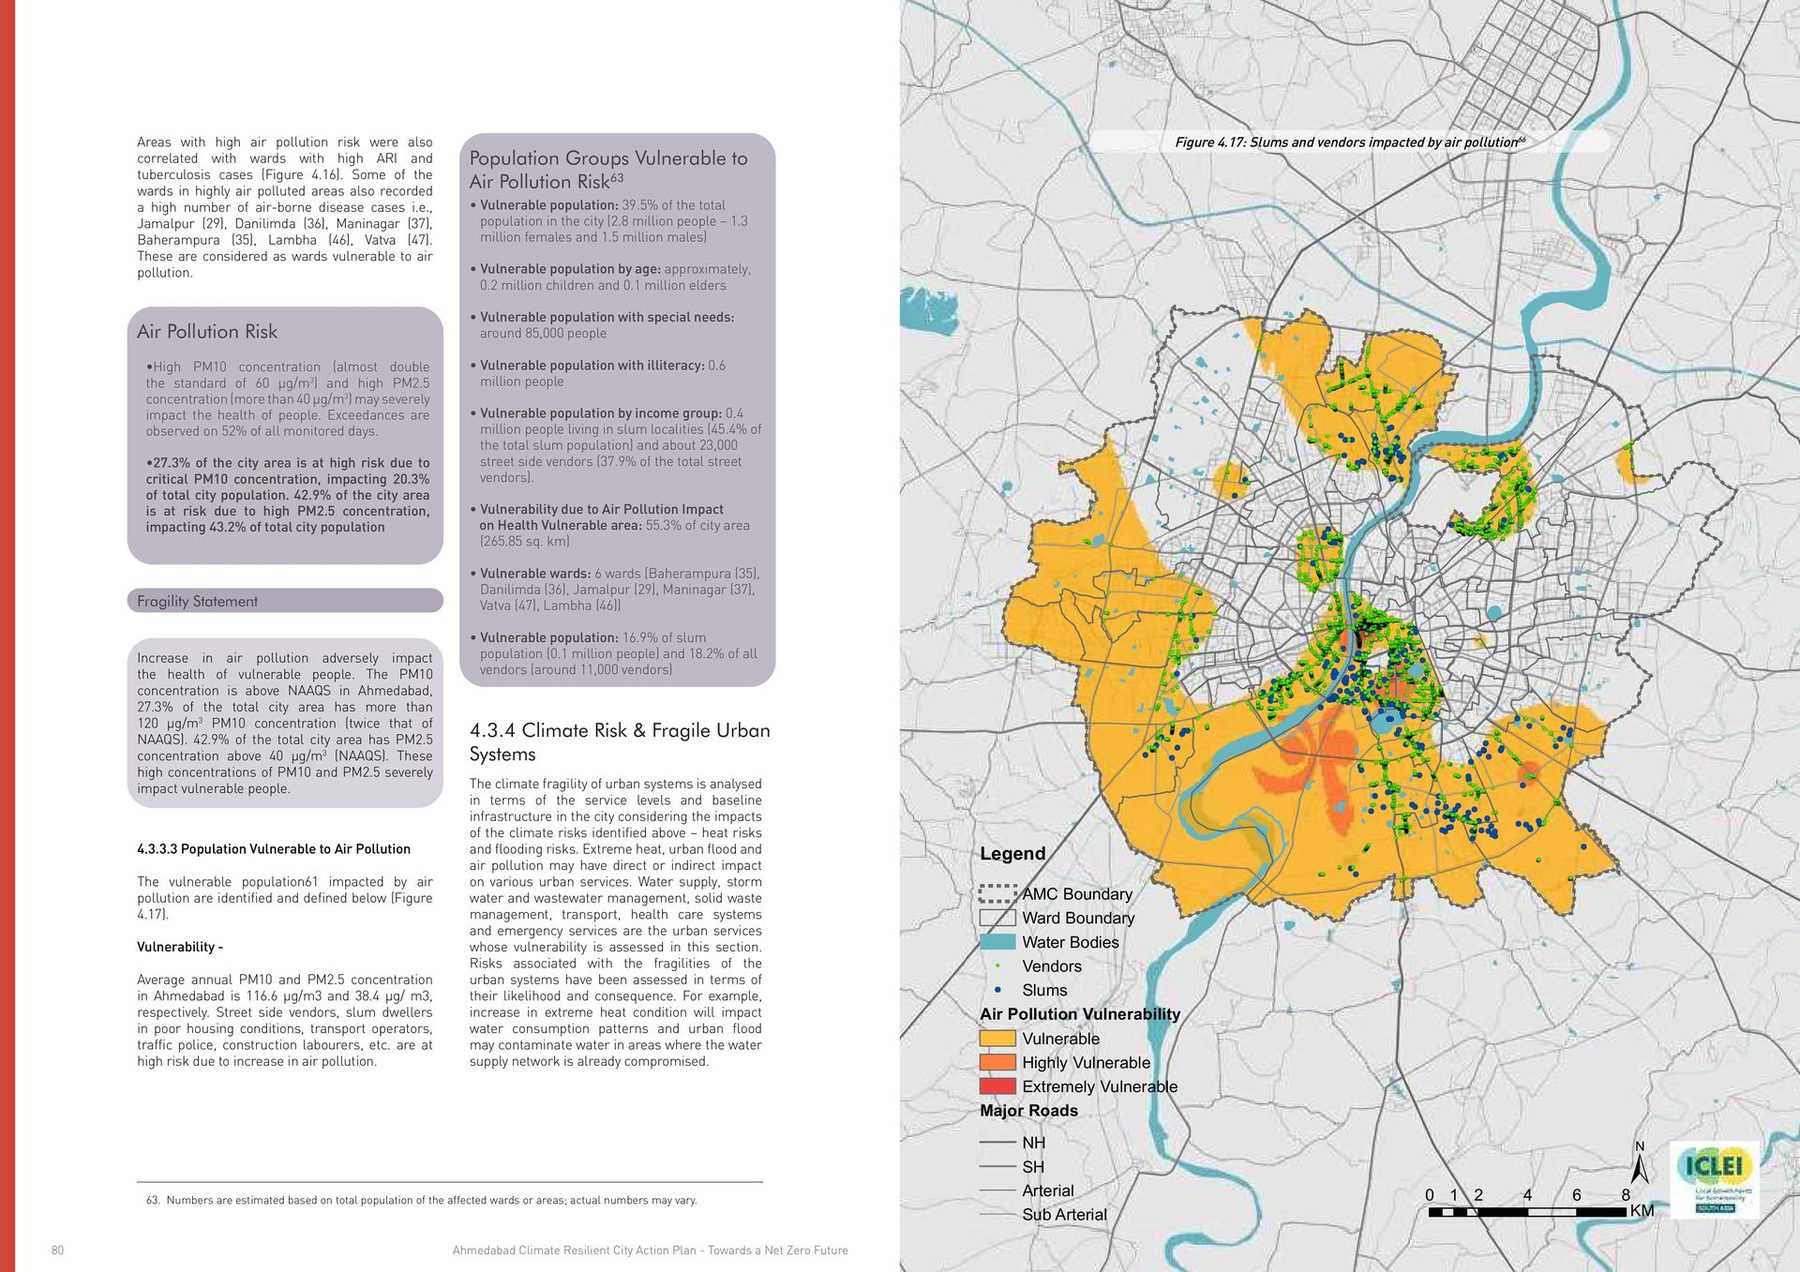
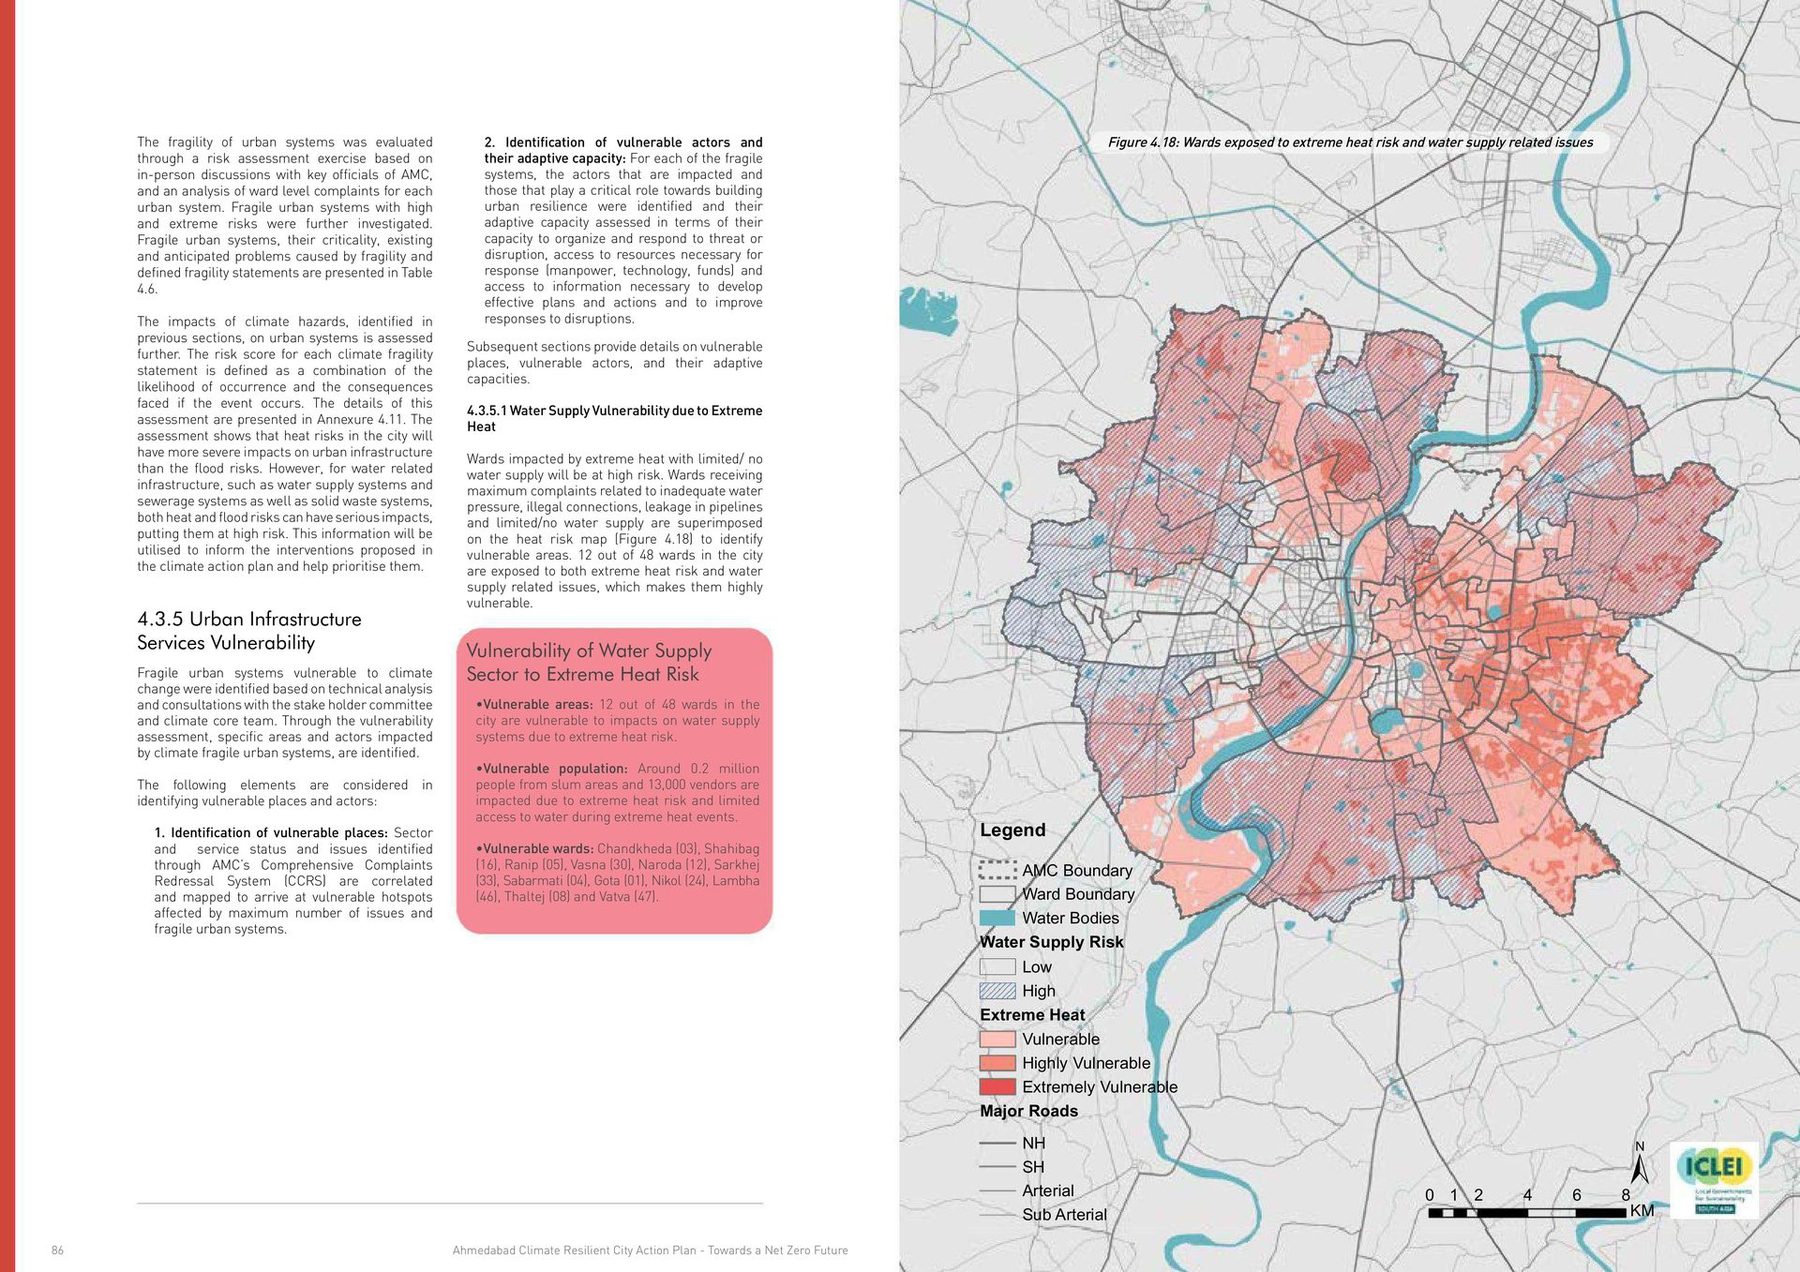
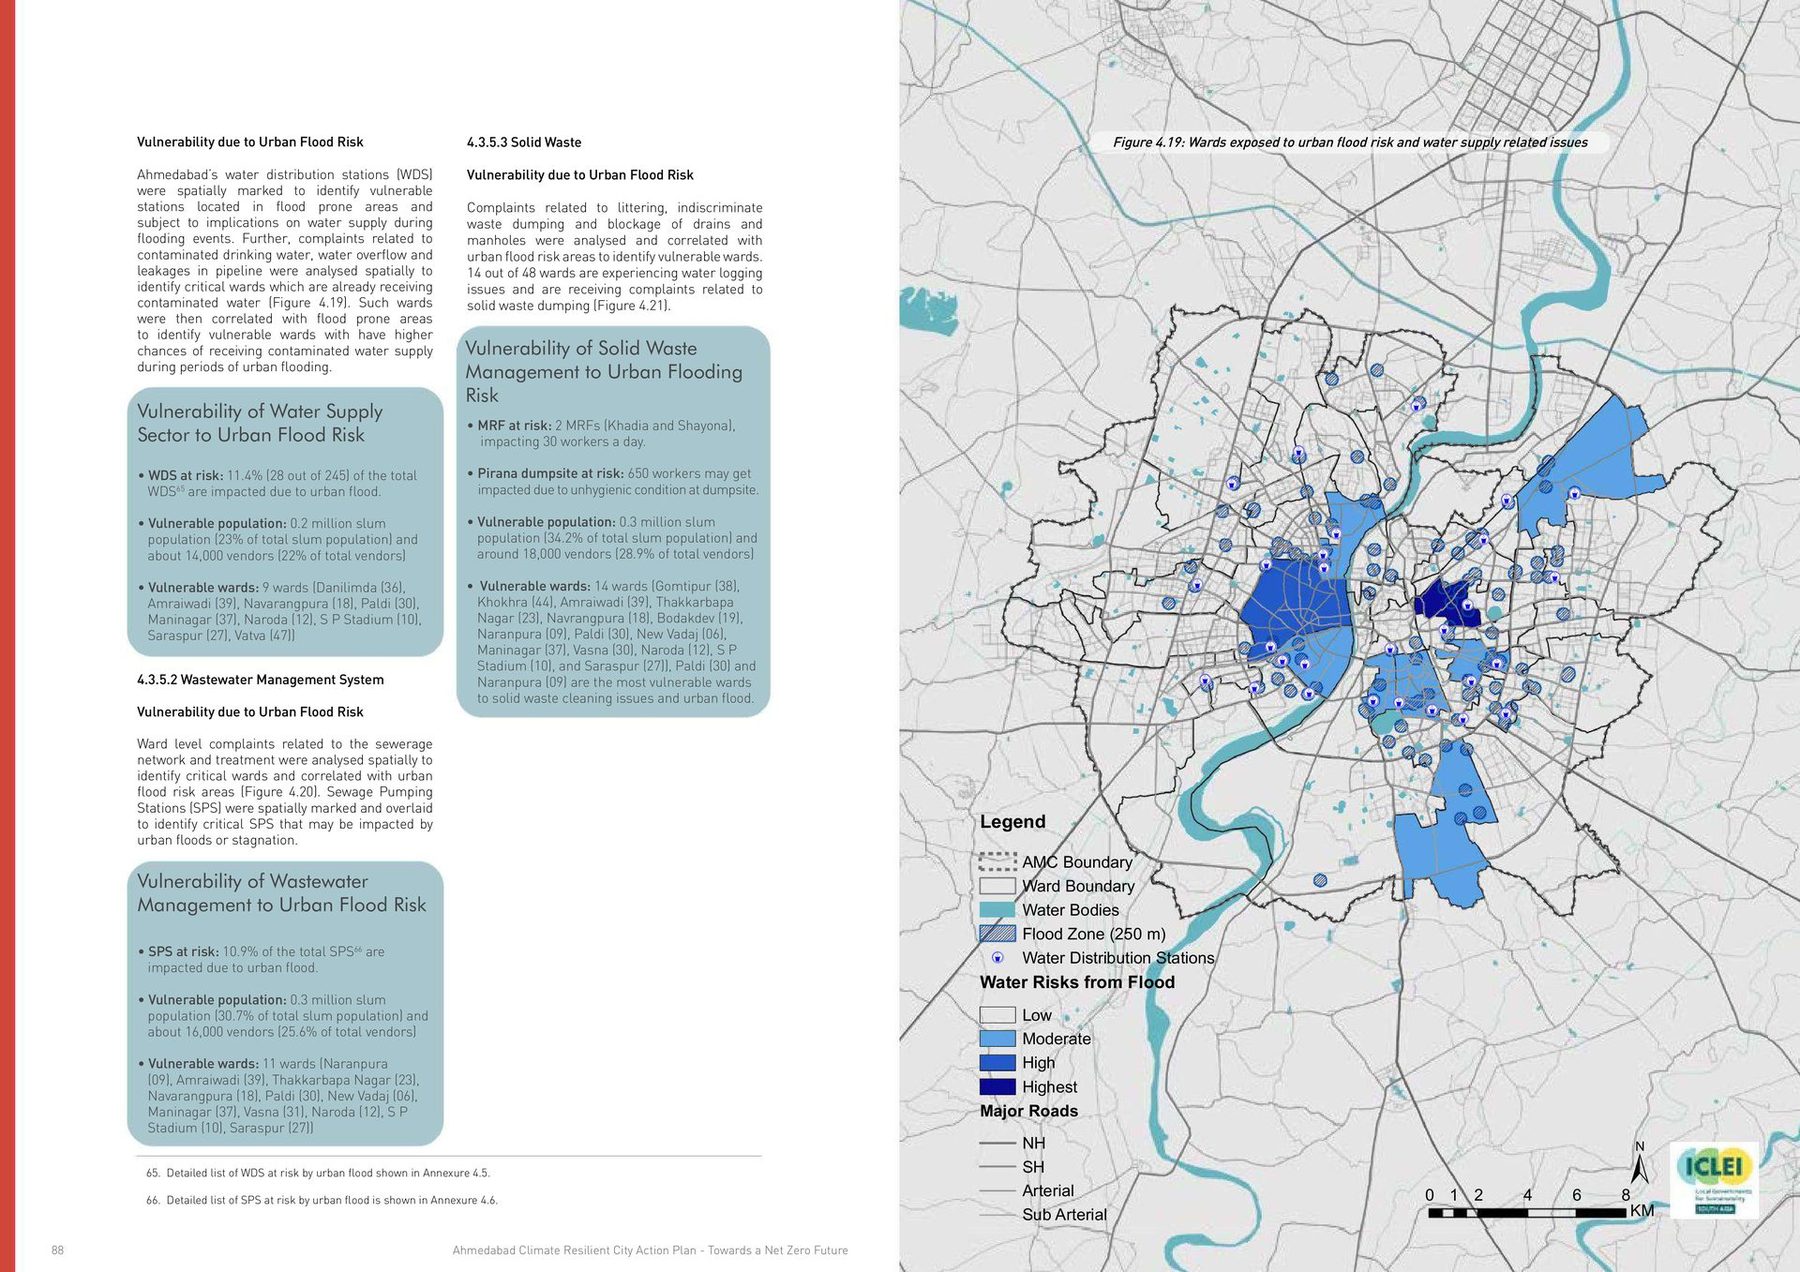
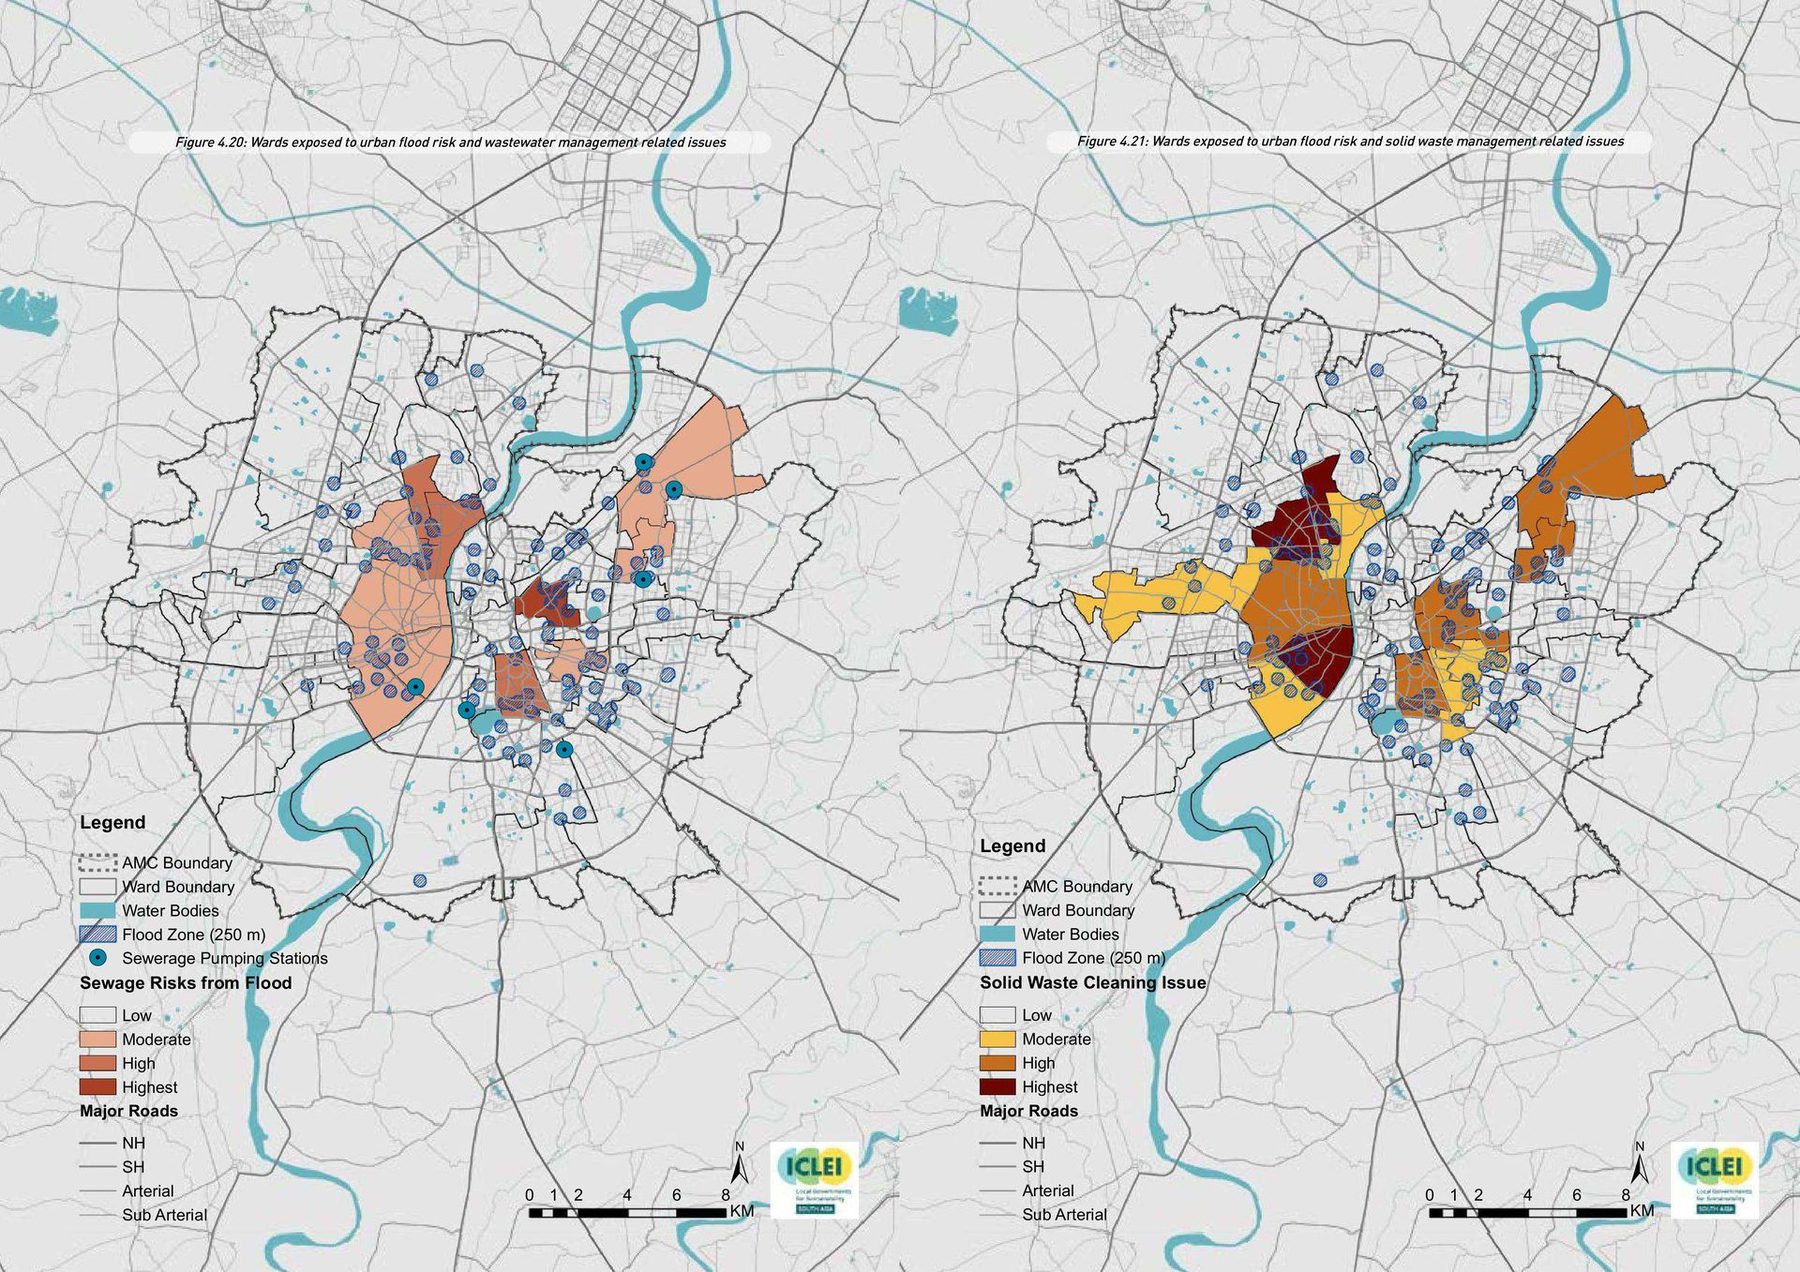
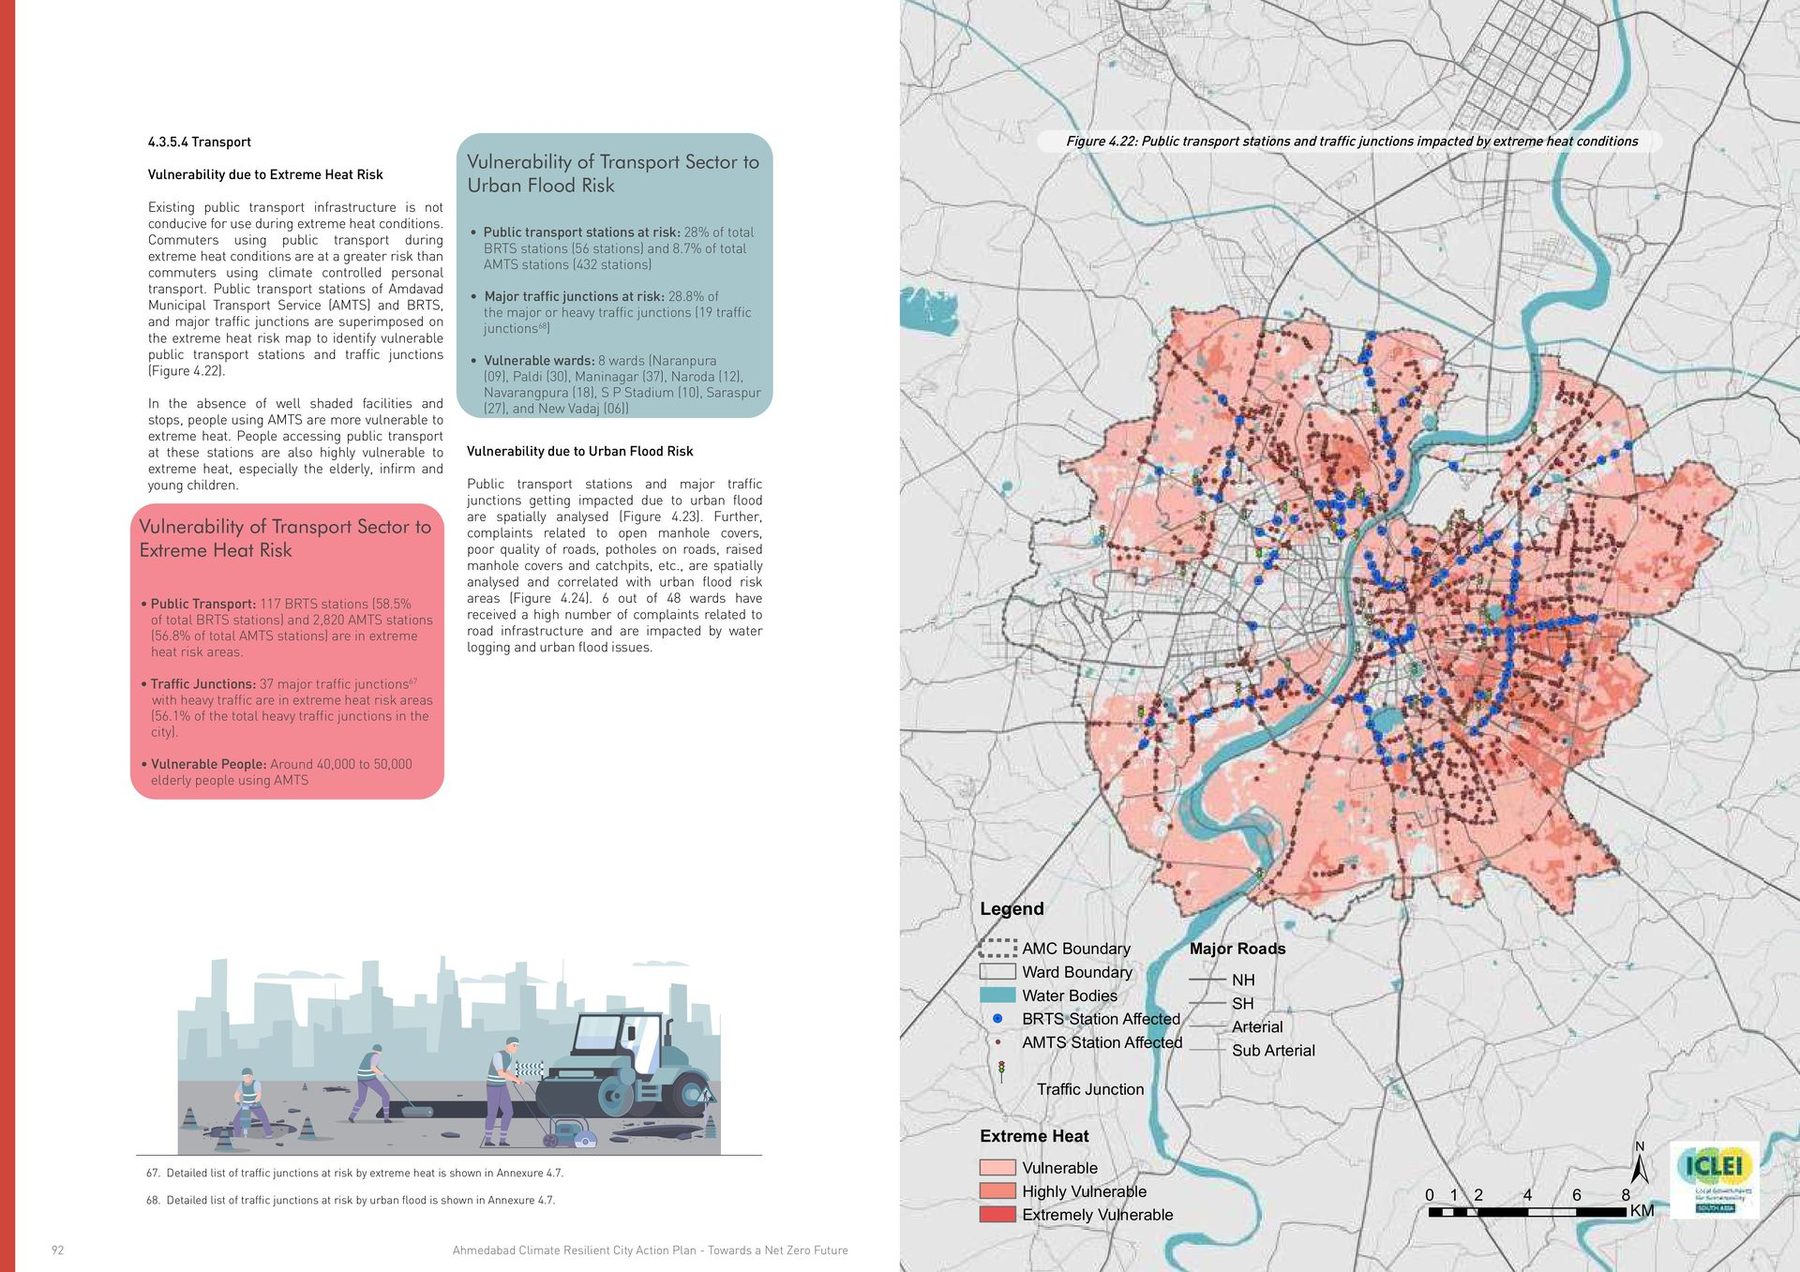
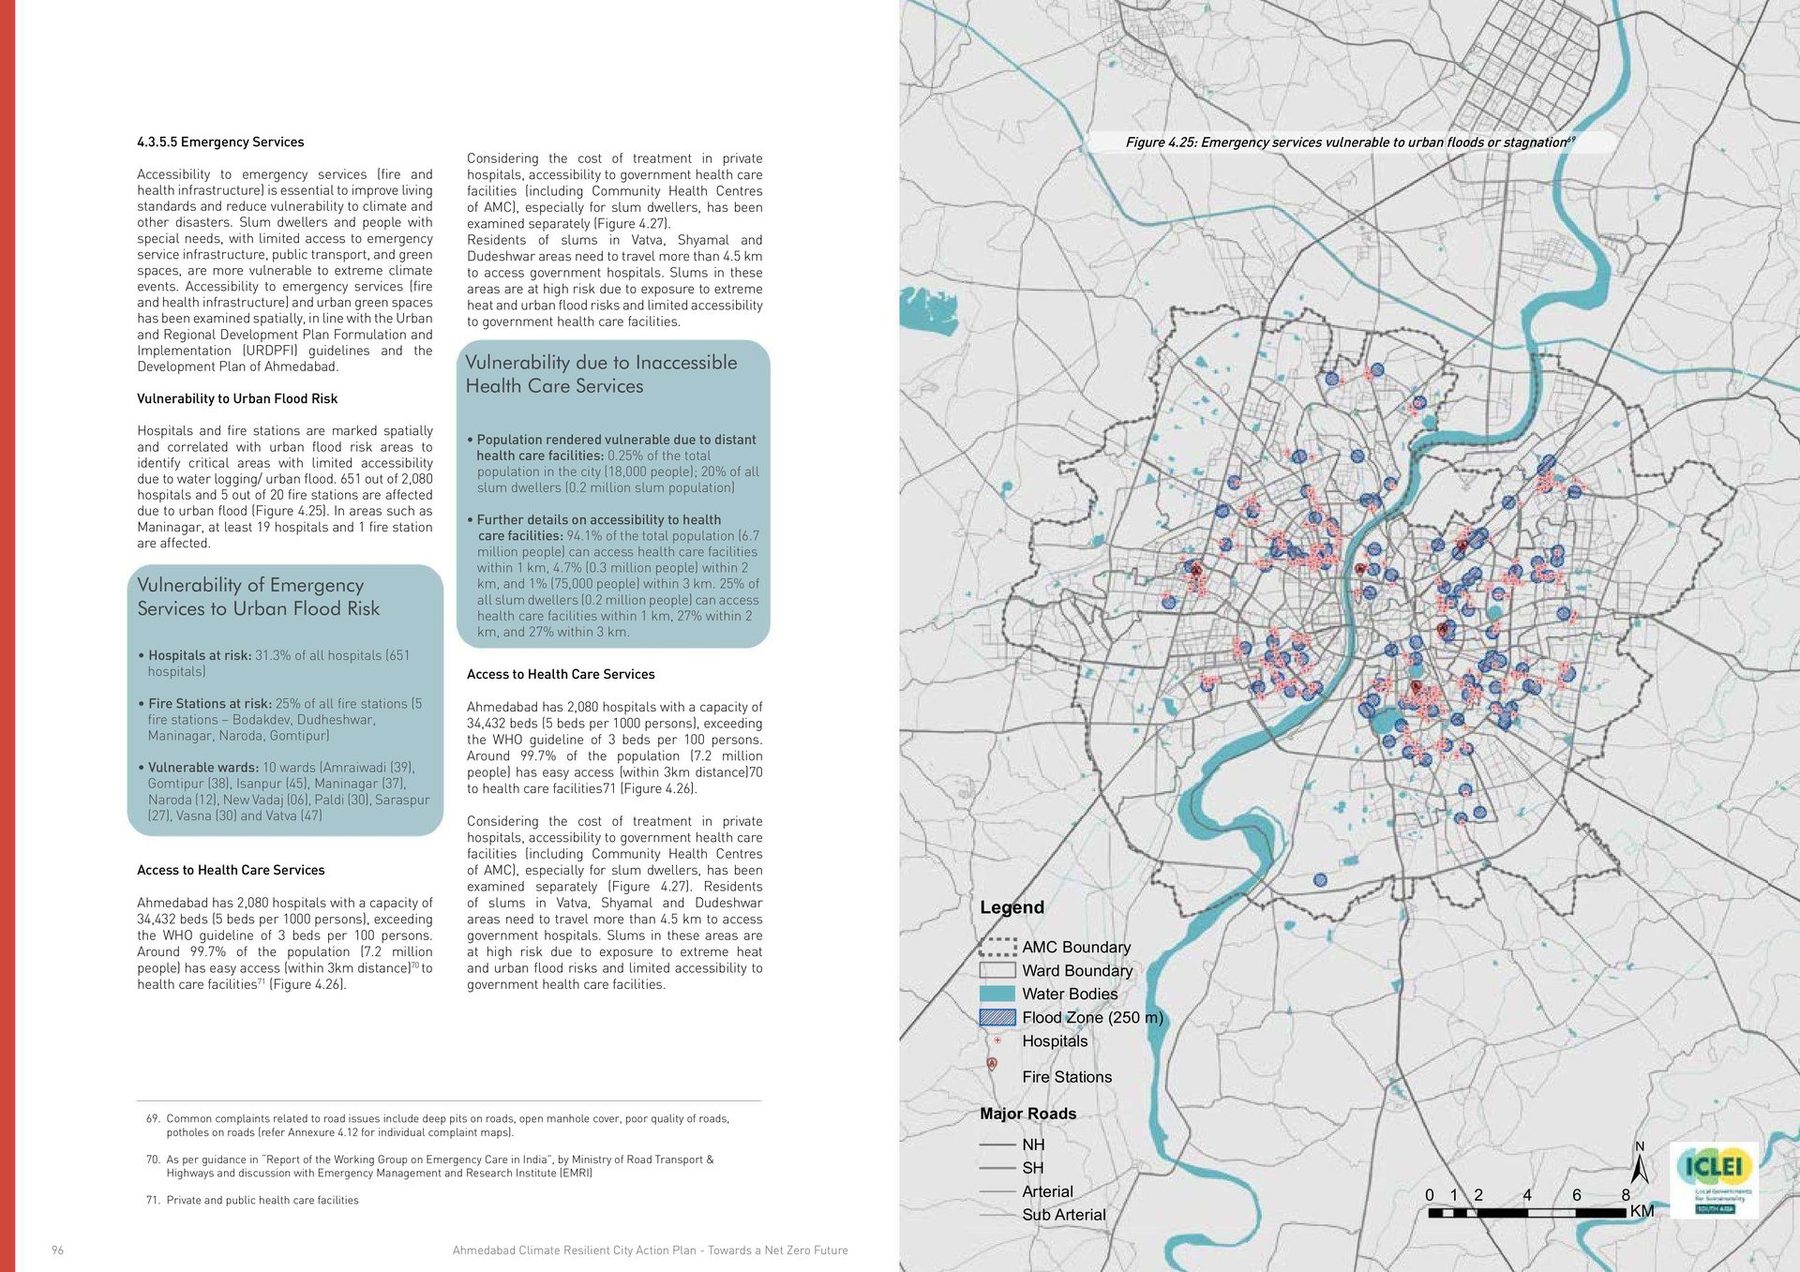
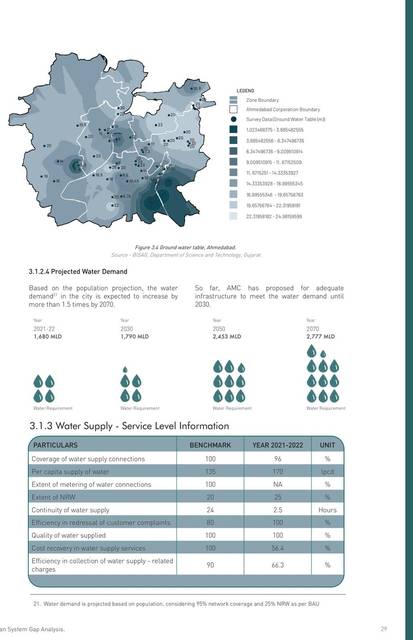
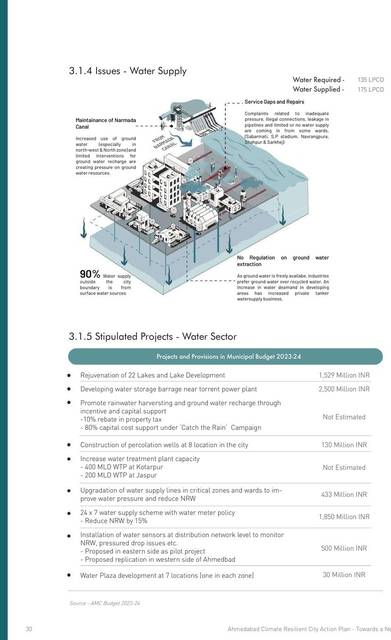
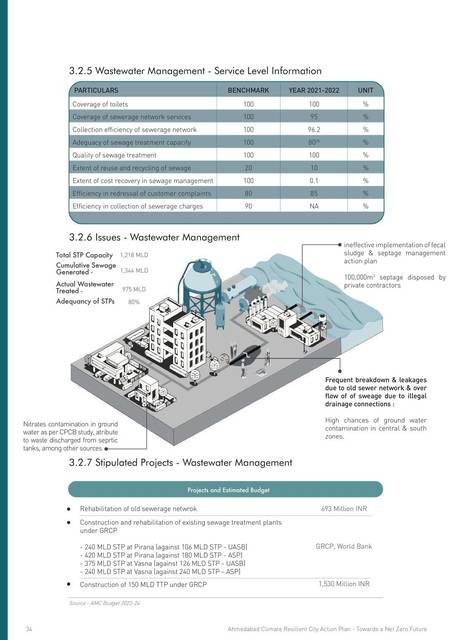
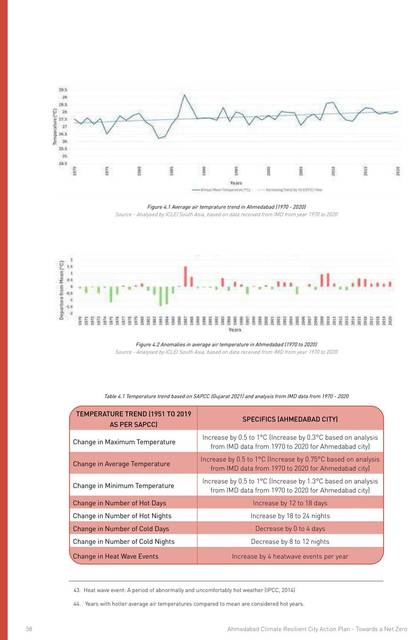
Before the plan proposes anything, it draws. Twenty-two maps at ward level, in three passes. First the infrastructure as it stands: water, wastewater, stormwater, waste. Then what a ward can reach: transport, parks, fire cover, health. Then the hazards: air, the heat map for May, the flood zone, the pollution hotspots, and the slums and vendors sitting inside each. Then the cross: hazard laid over infrastructure, ward by ward, to find where a heatwave meets a water shortage, where a flood meets a broken road, where an emergency service is itself inside the flood zone.
They are one drawing, not twenty-two. The ward boundaries, the Sabarmati, the ring road and the river's green edge sit in the same place on every sheet, so the atlas belongs on one stage rather than in a grid: step through it and what moves is the question, not the city.
The atlas is the analytical core of the plan. Everything that follows, the targets, the actions, the costs, points back to a ward on one of these maps.
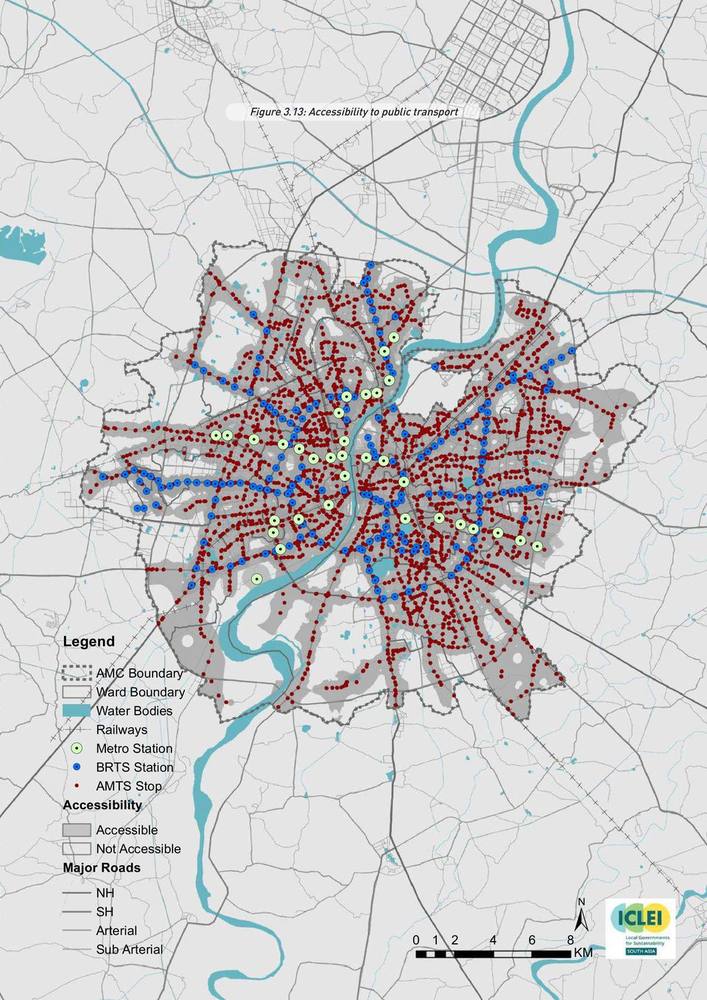
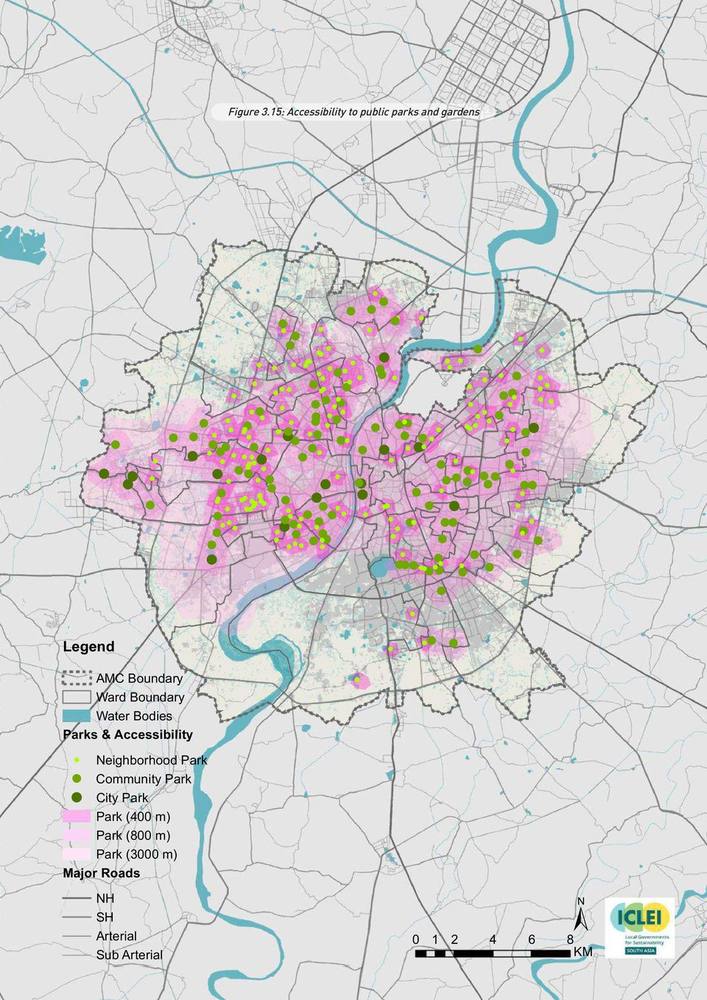
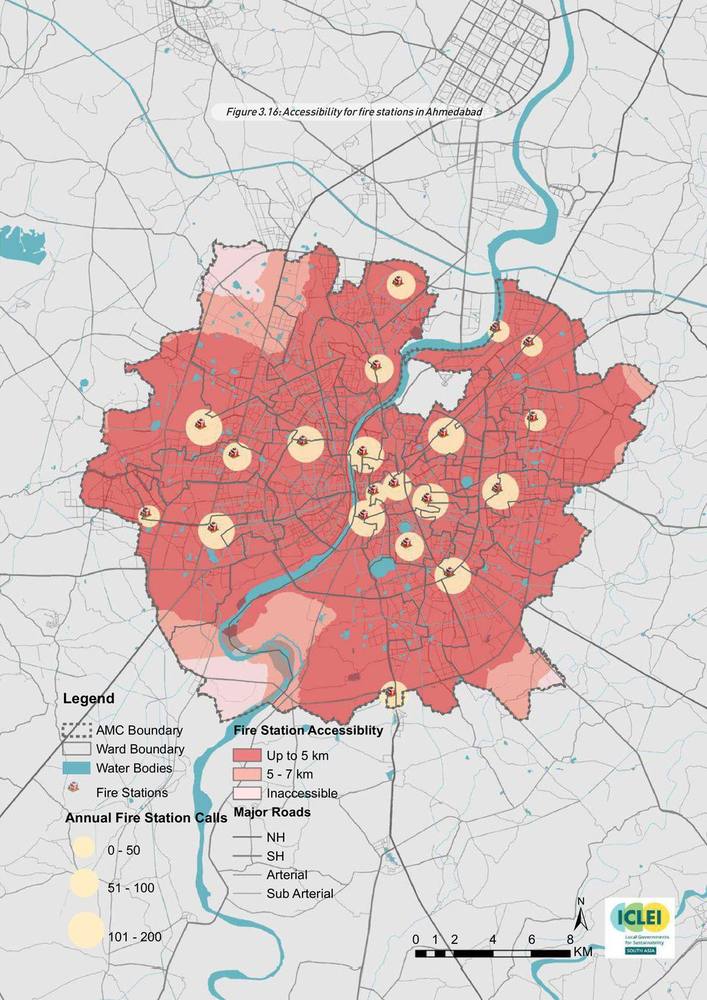
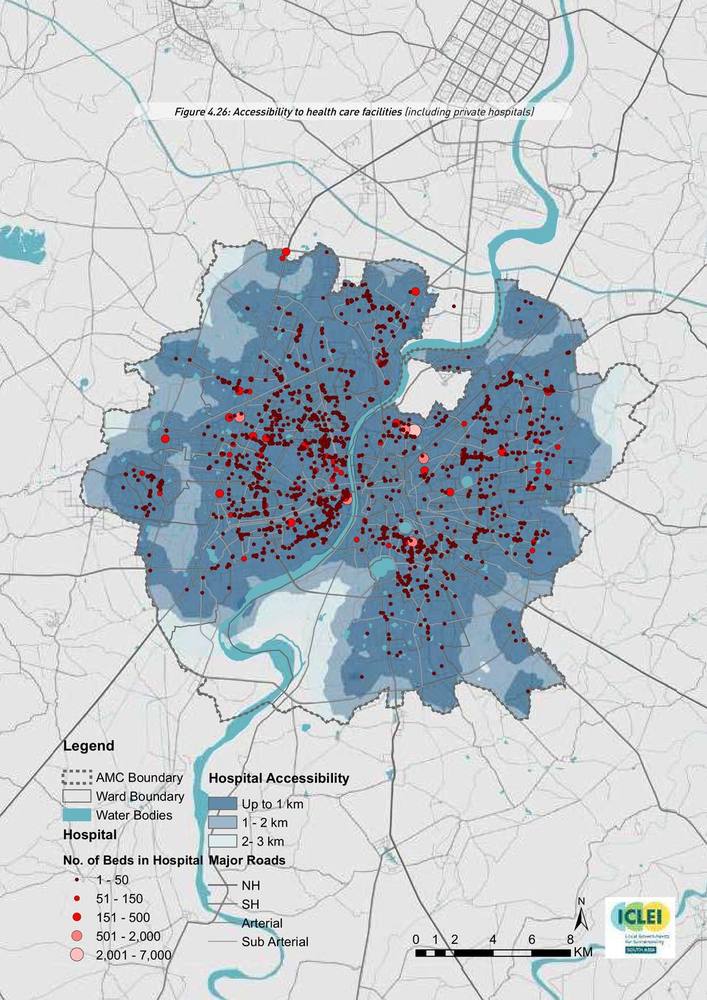
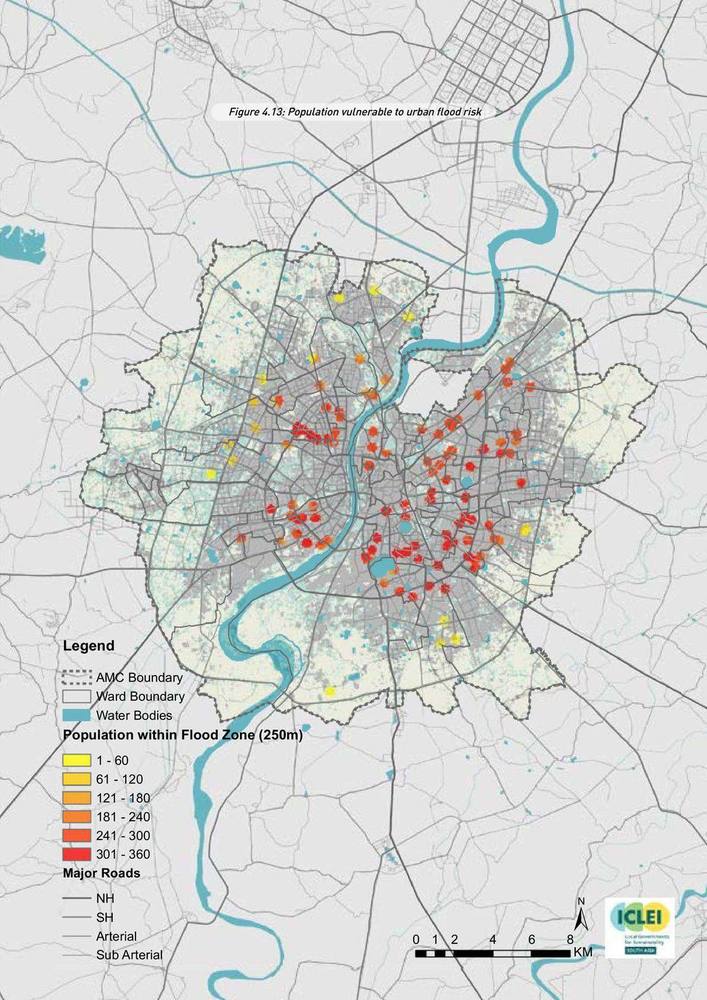
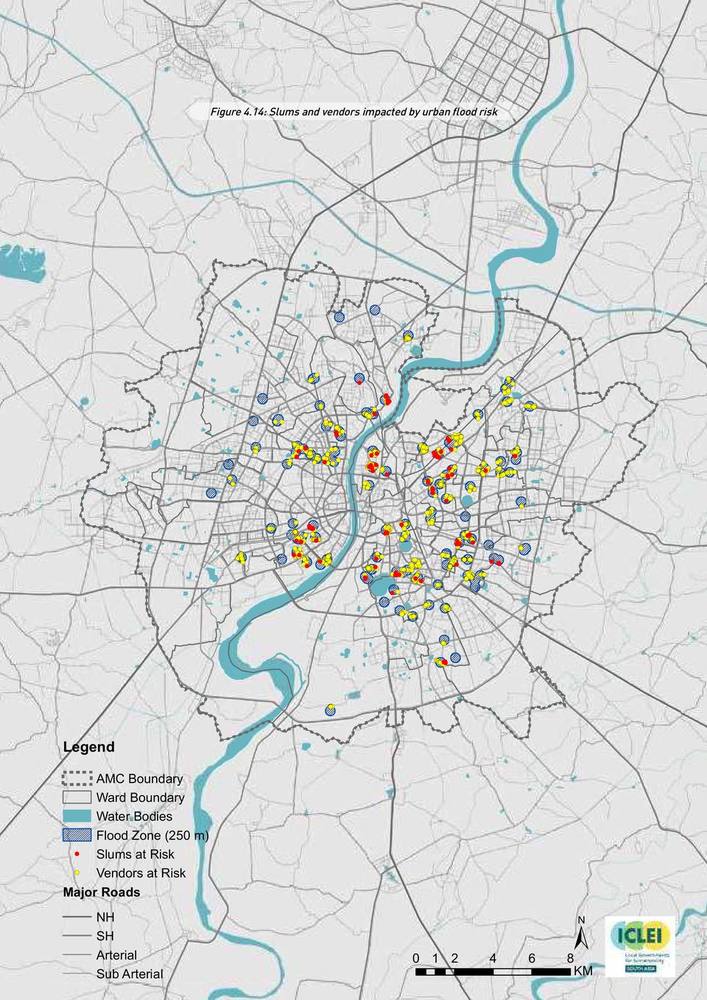
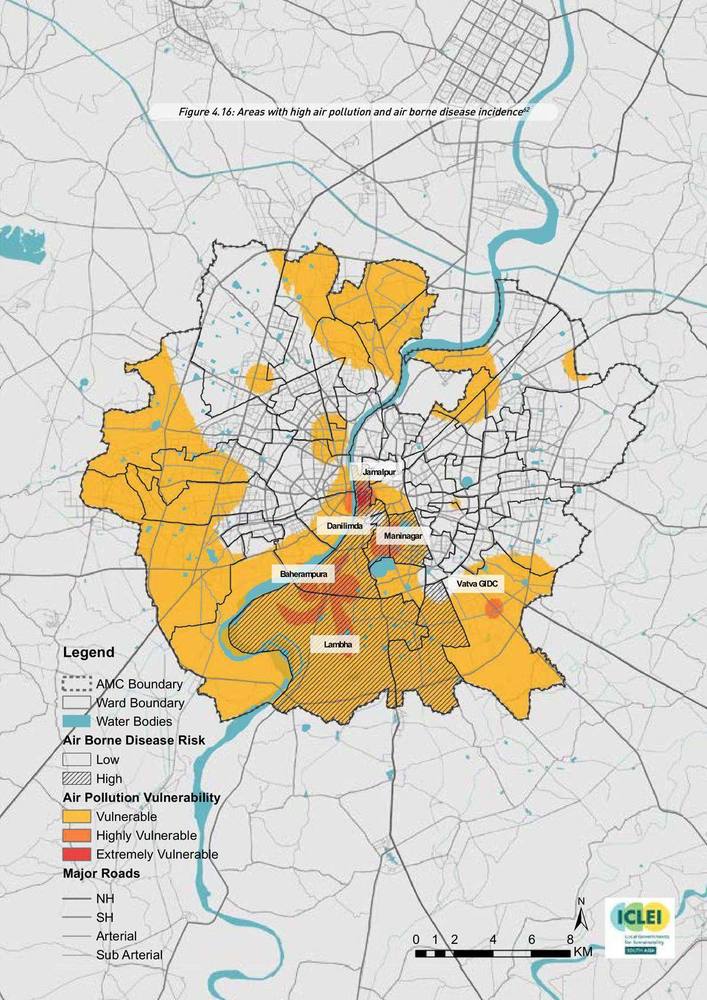
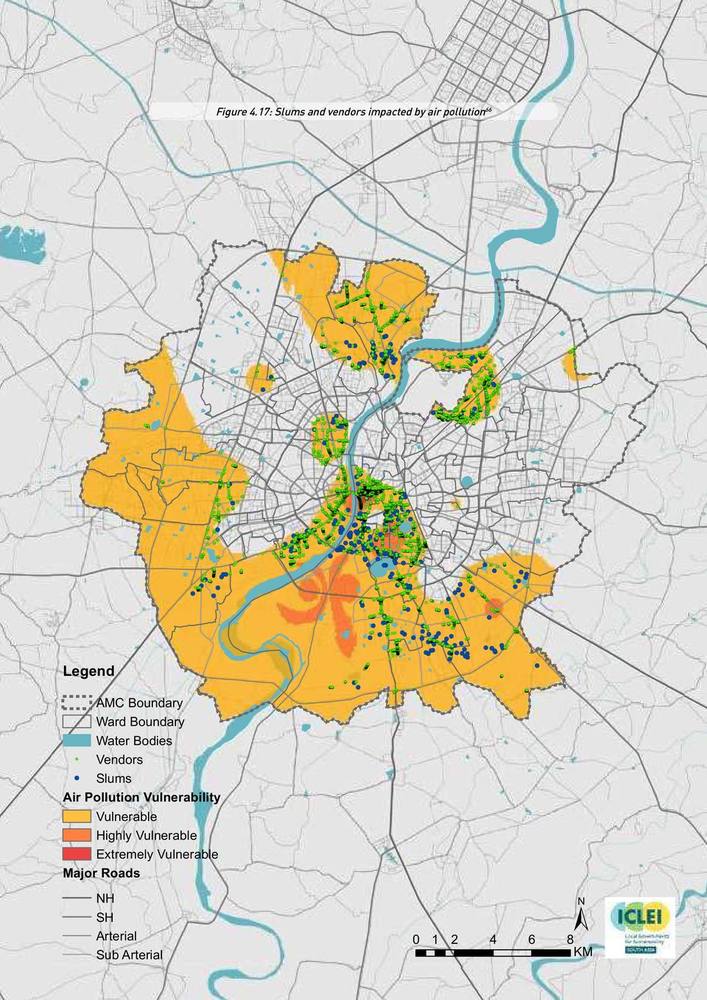
(the systems)
(what it can reach)
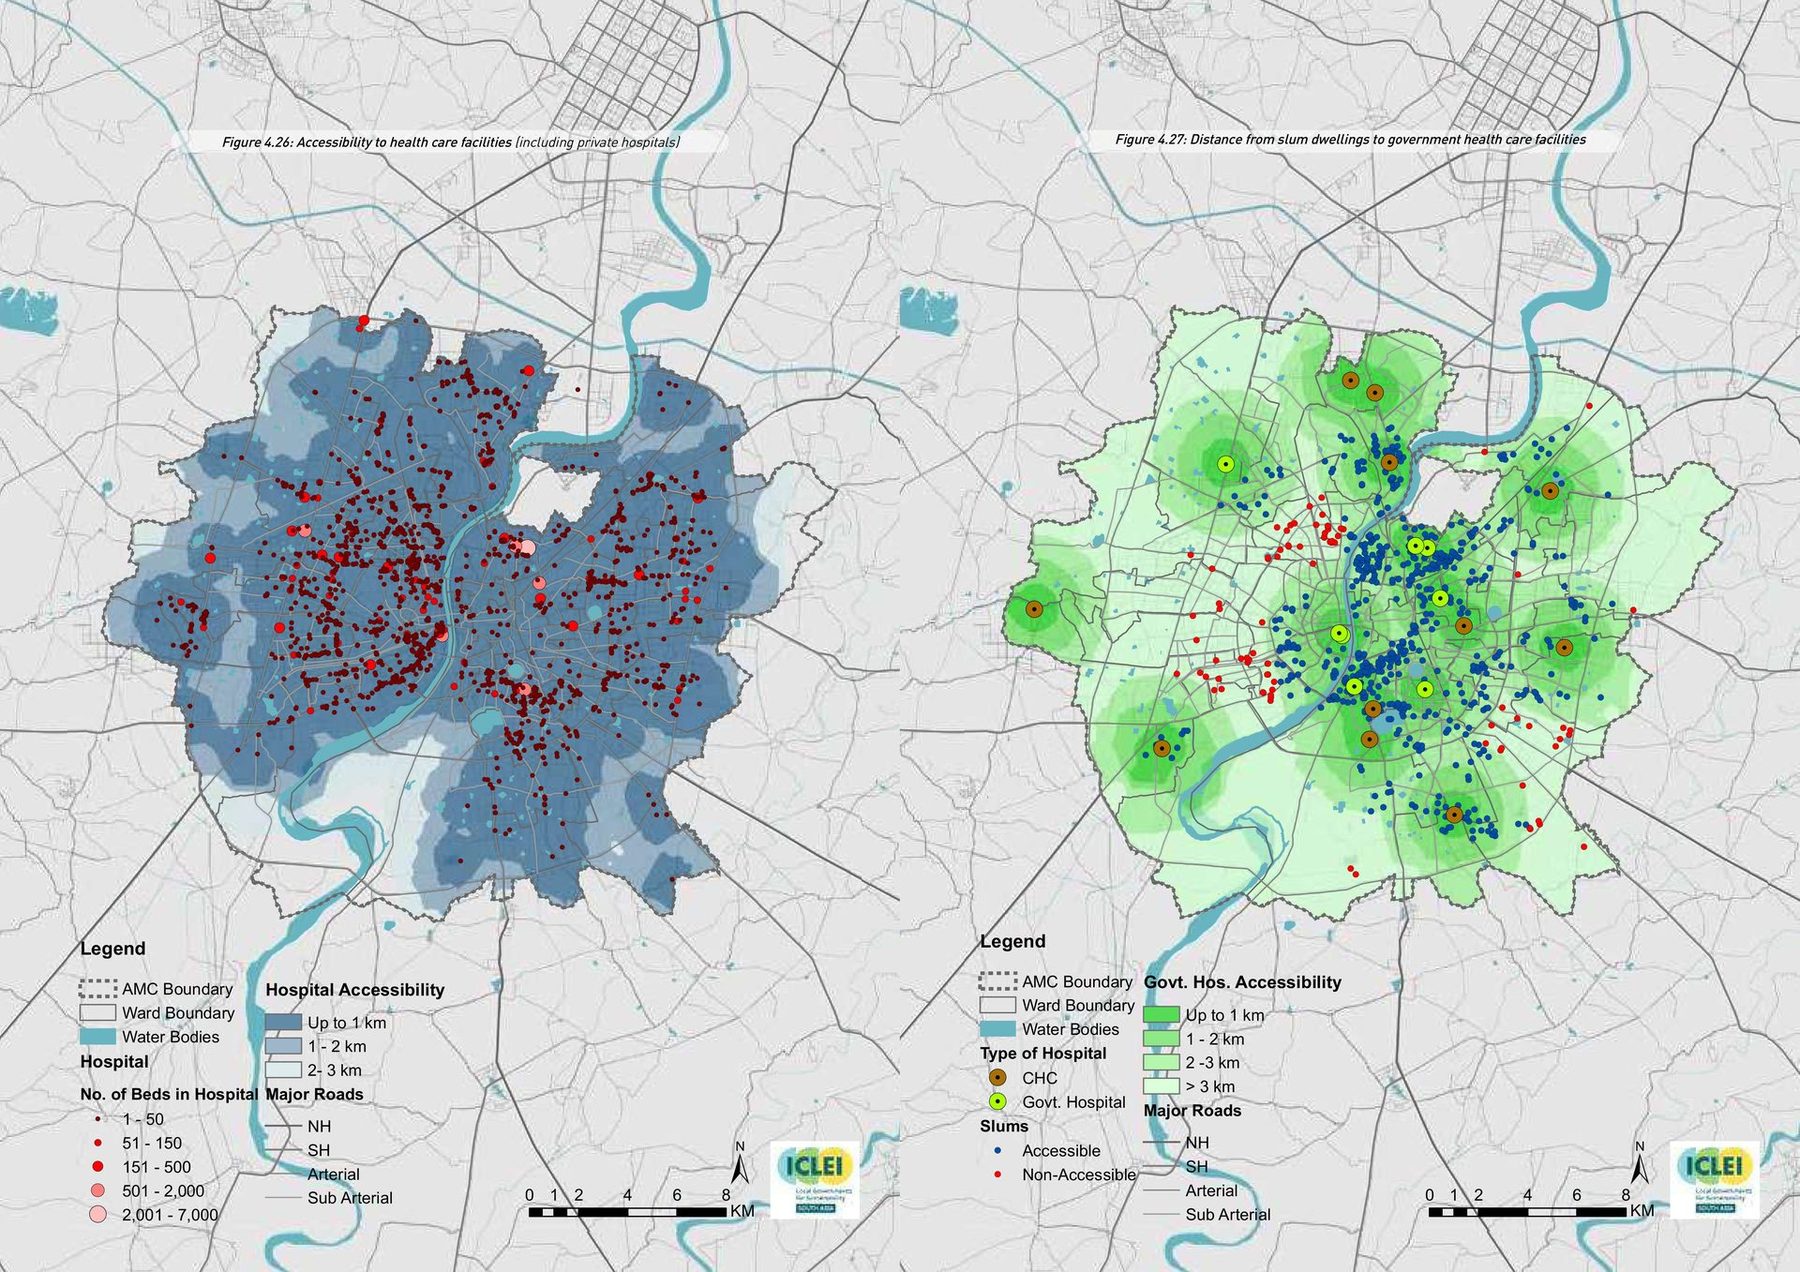
(the hazards)
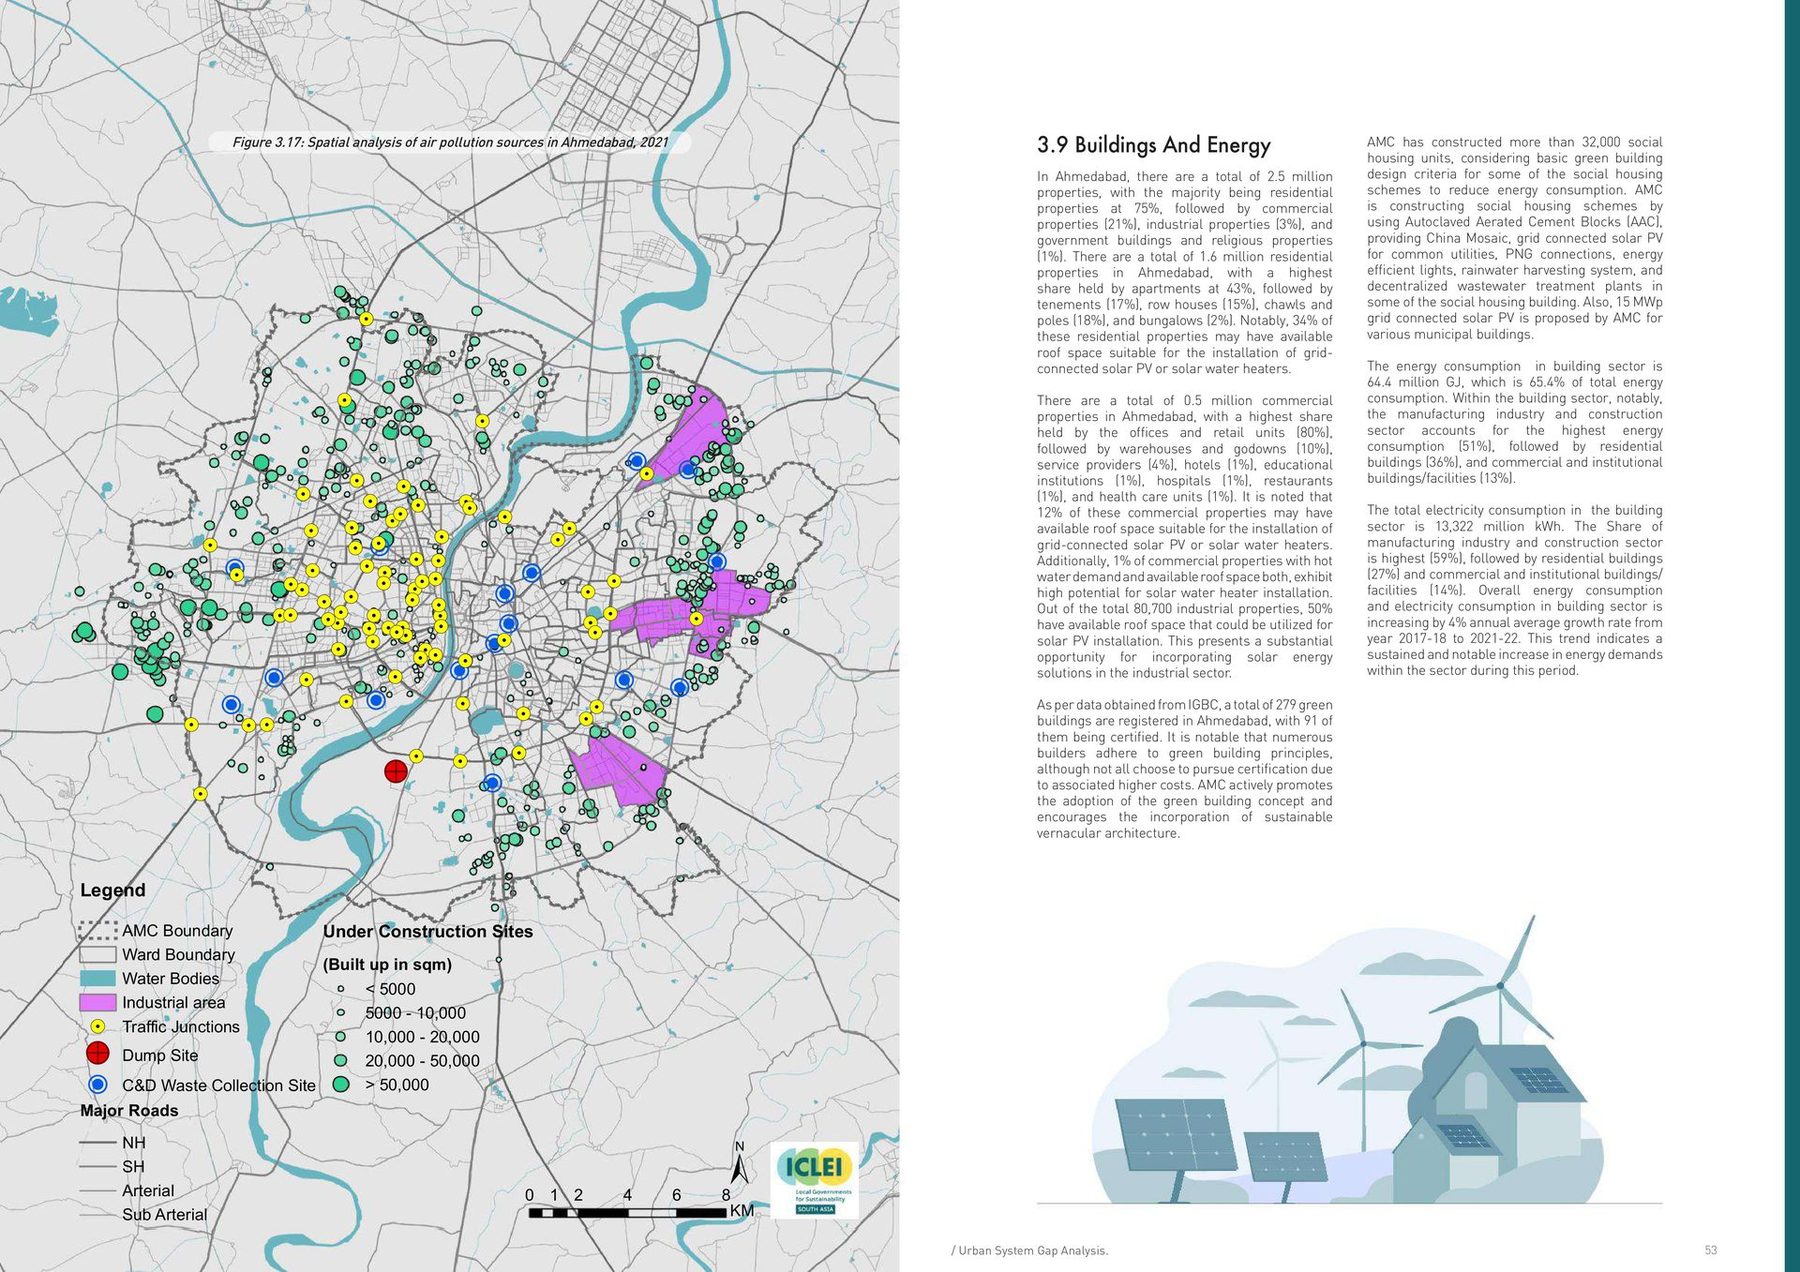
(where the two meet)
A number the city can be held to
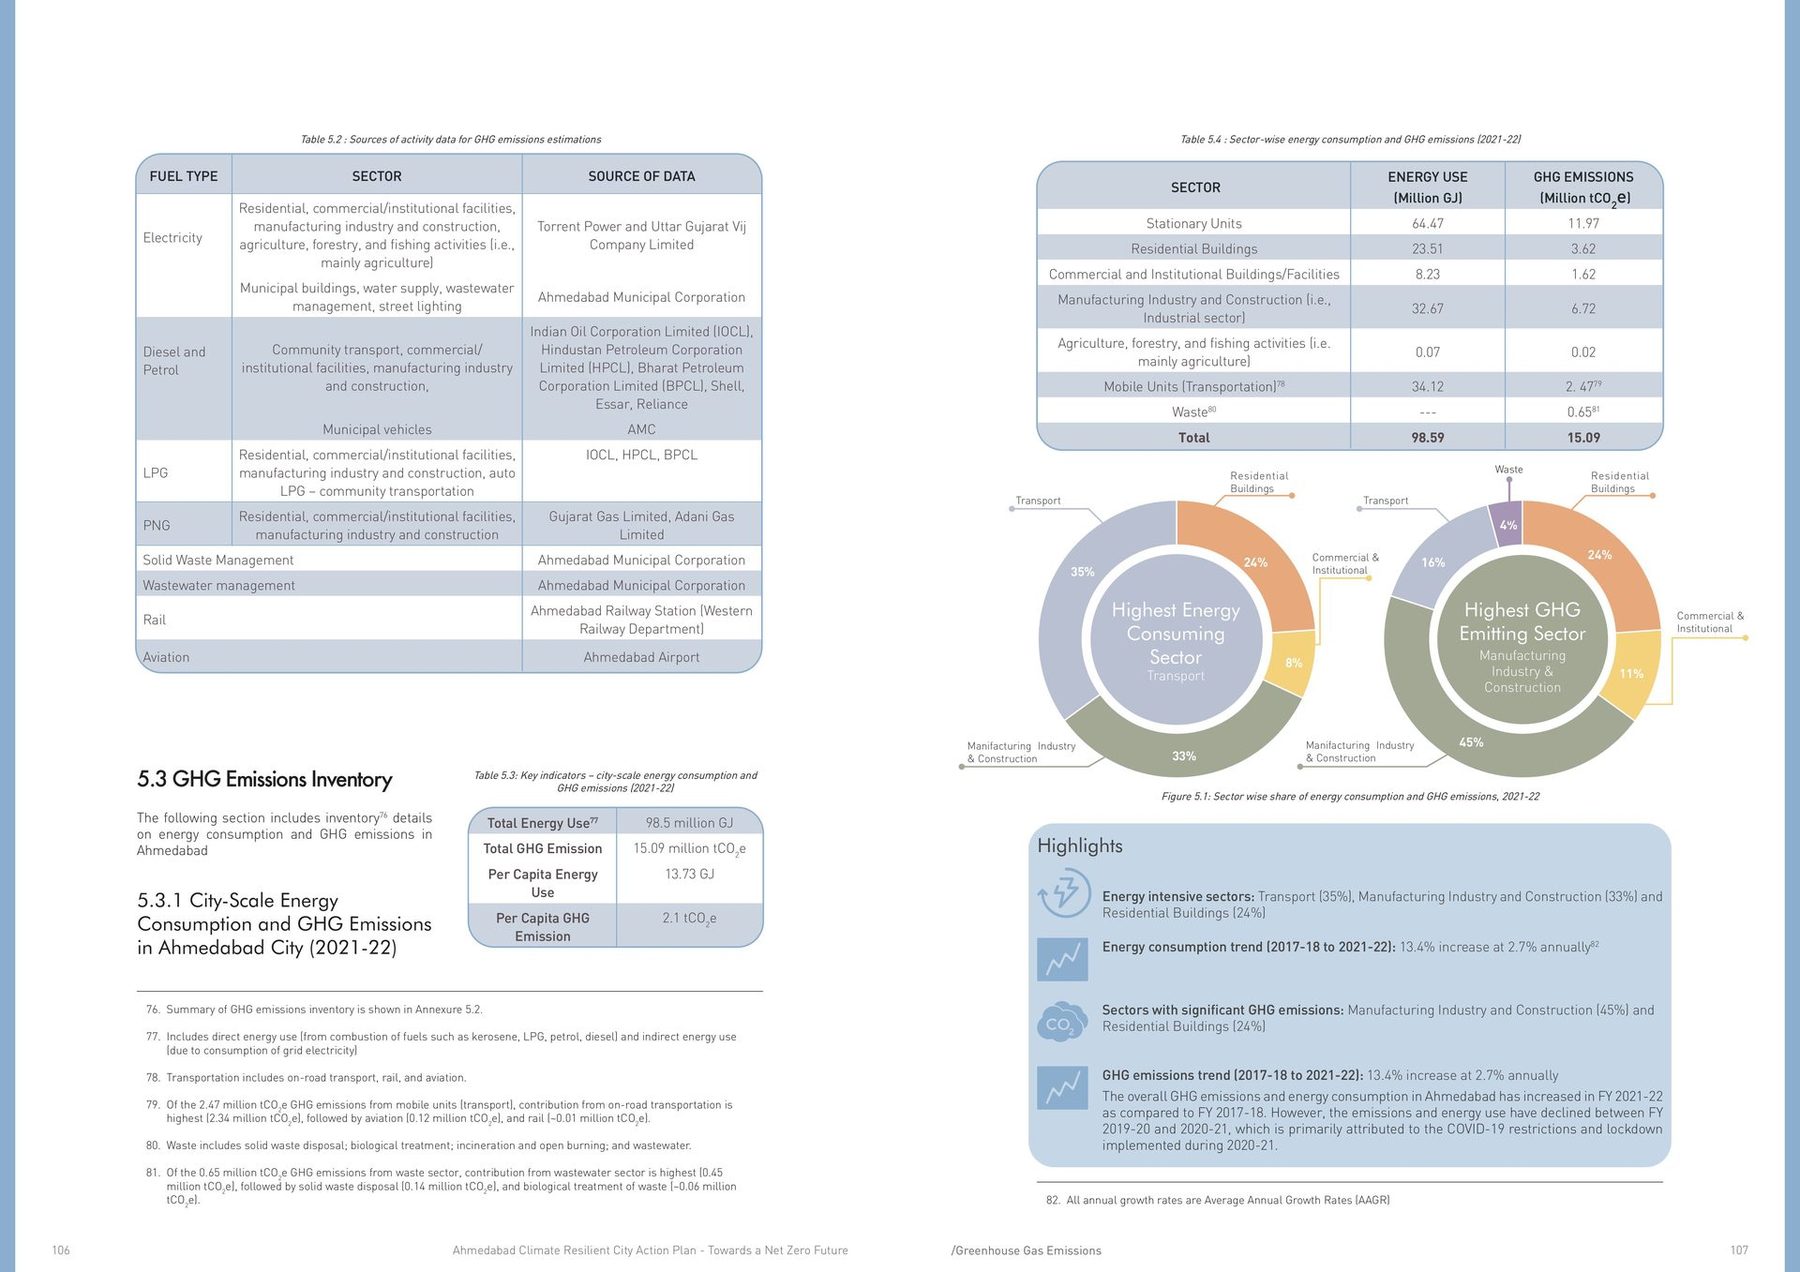
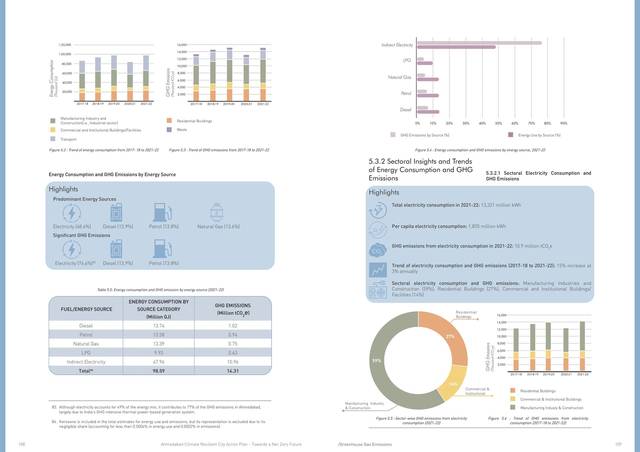
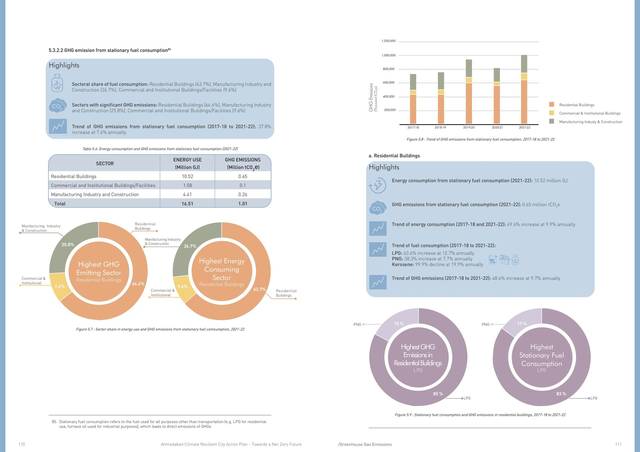
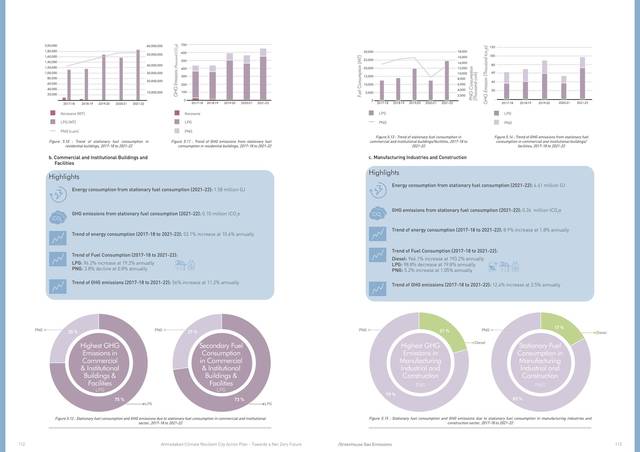
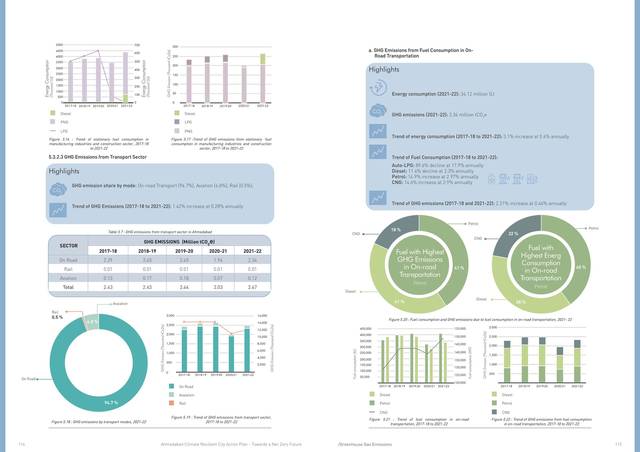
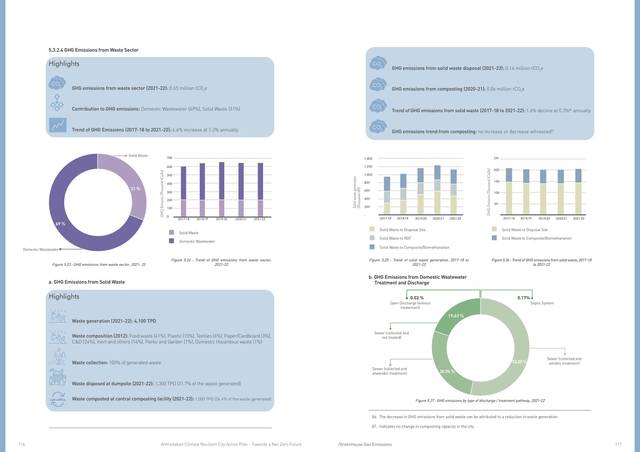
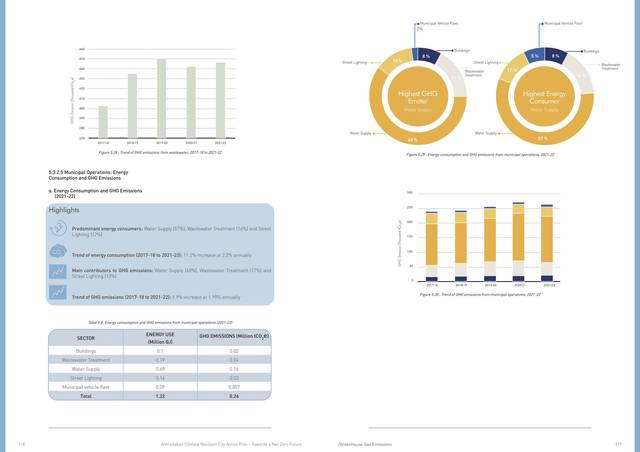
The maps say where; the inventory says how much. Every activity number has a named source (the electricity utilities, the oil and gas companies, the corporation's own fleet and plants, the railway, the airport) and the sum is a number the city can be held to: 15.09 million tonnes of CO₂e in a year, 2.1 tonnes per person, nearly half of it from manufacturing and construction, a quarter from homes.
Five years of the same accounting, 2017–18 to 2021–22, give the trend: 13.4% up, 2.7% a year, with the pandemic dip in between. That trend is the business-as-usual line the rest of the plan argues against.
Three lines to 2070
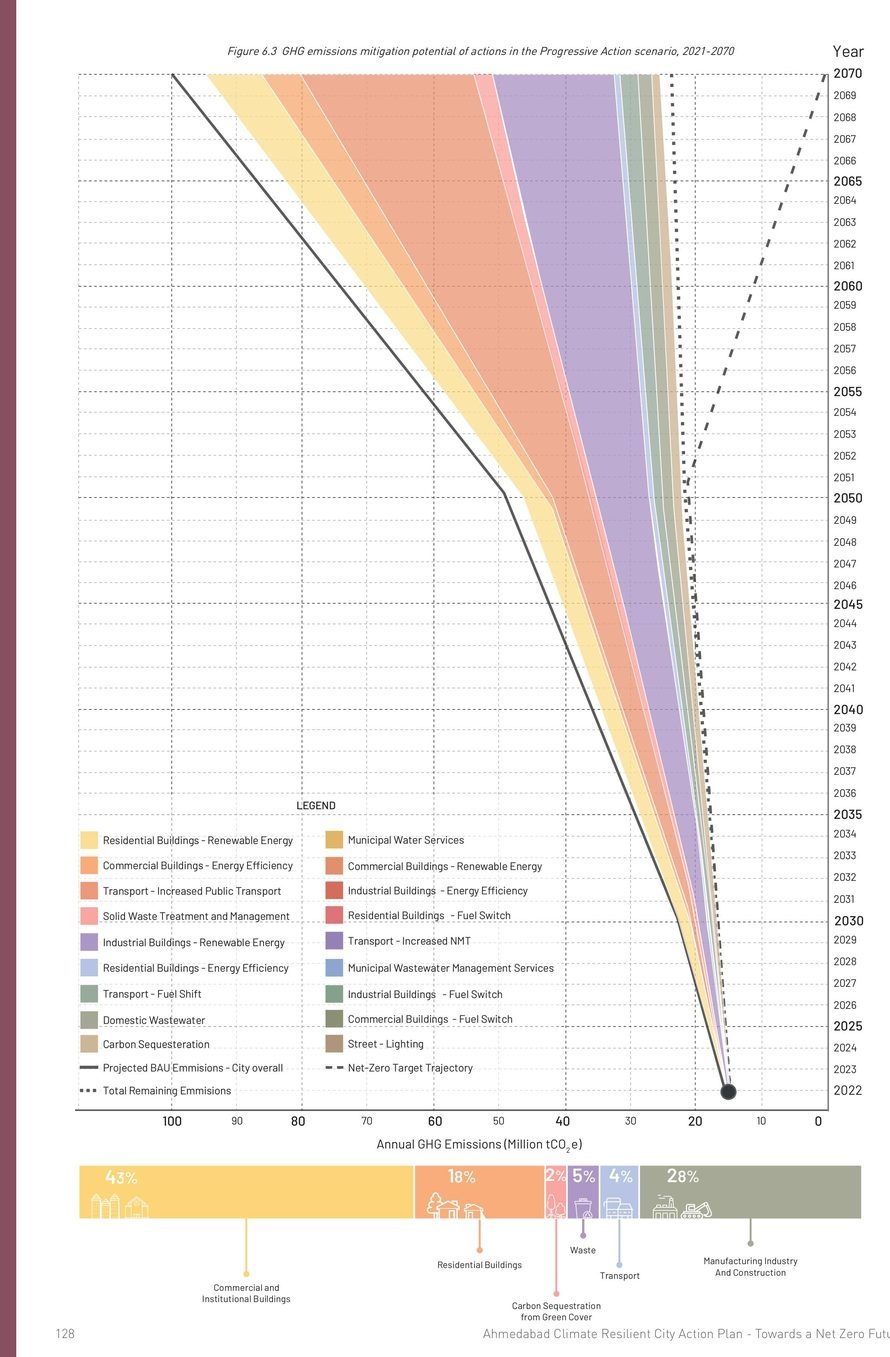
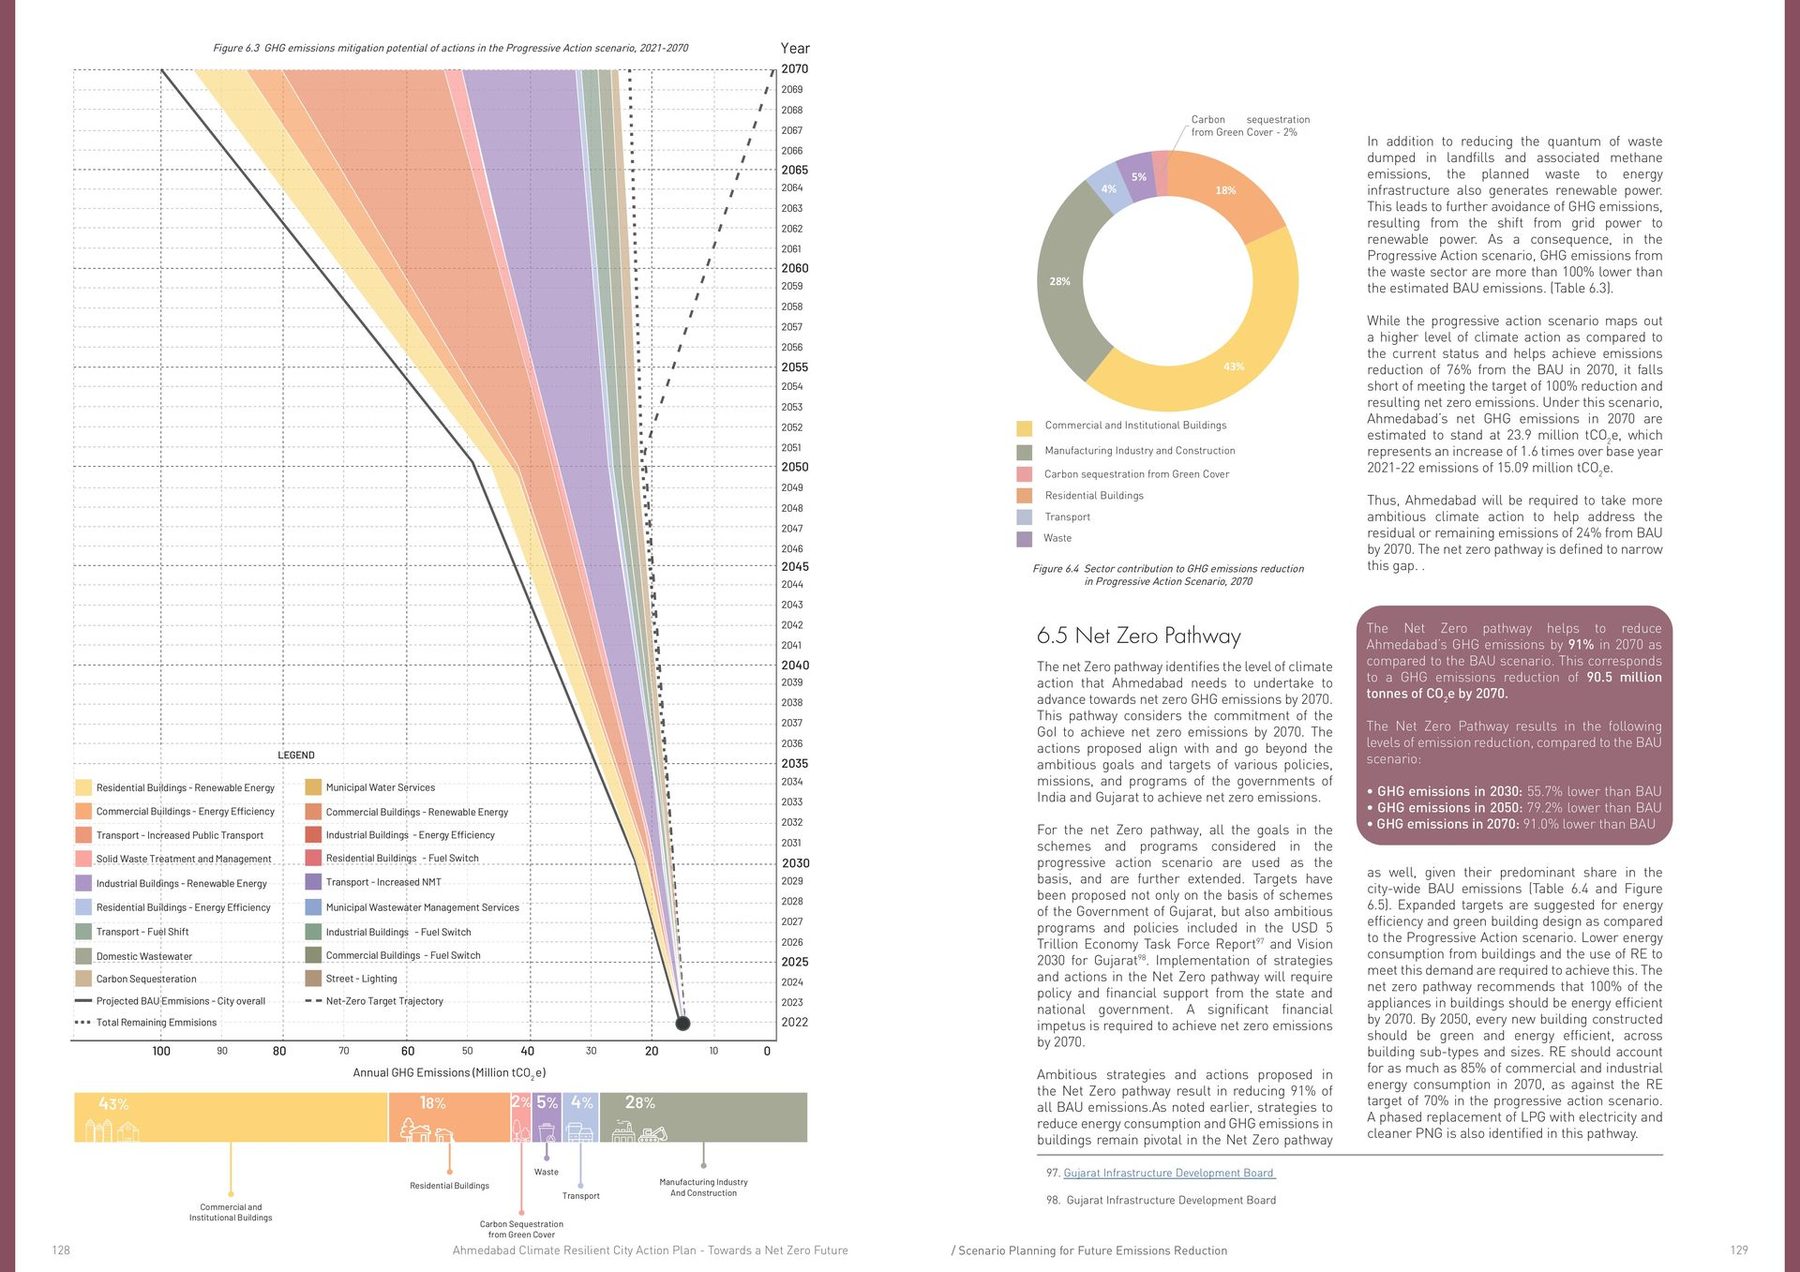
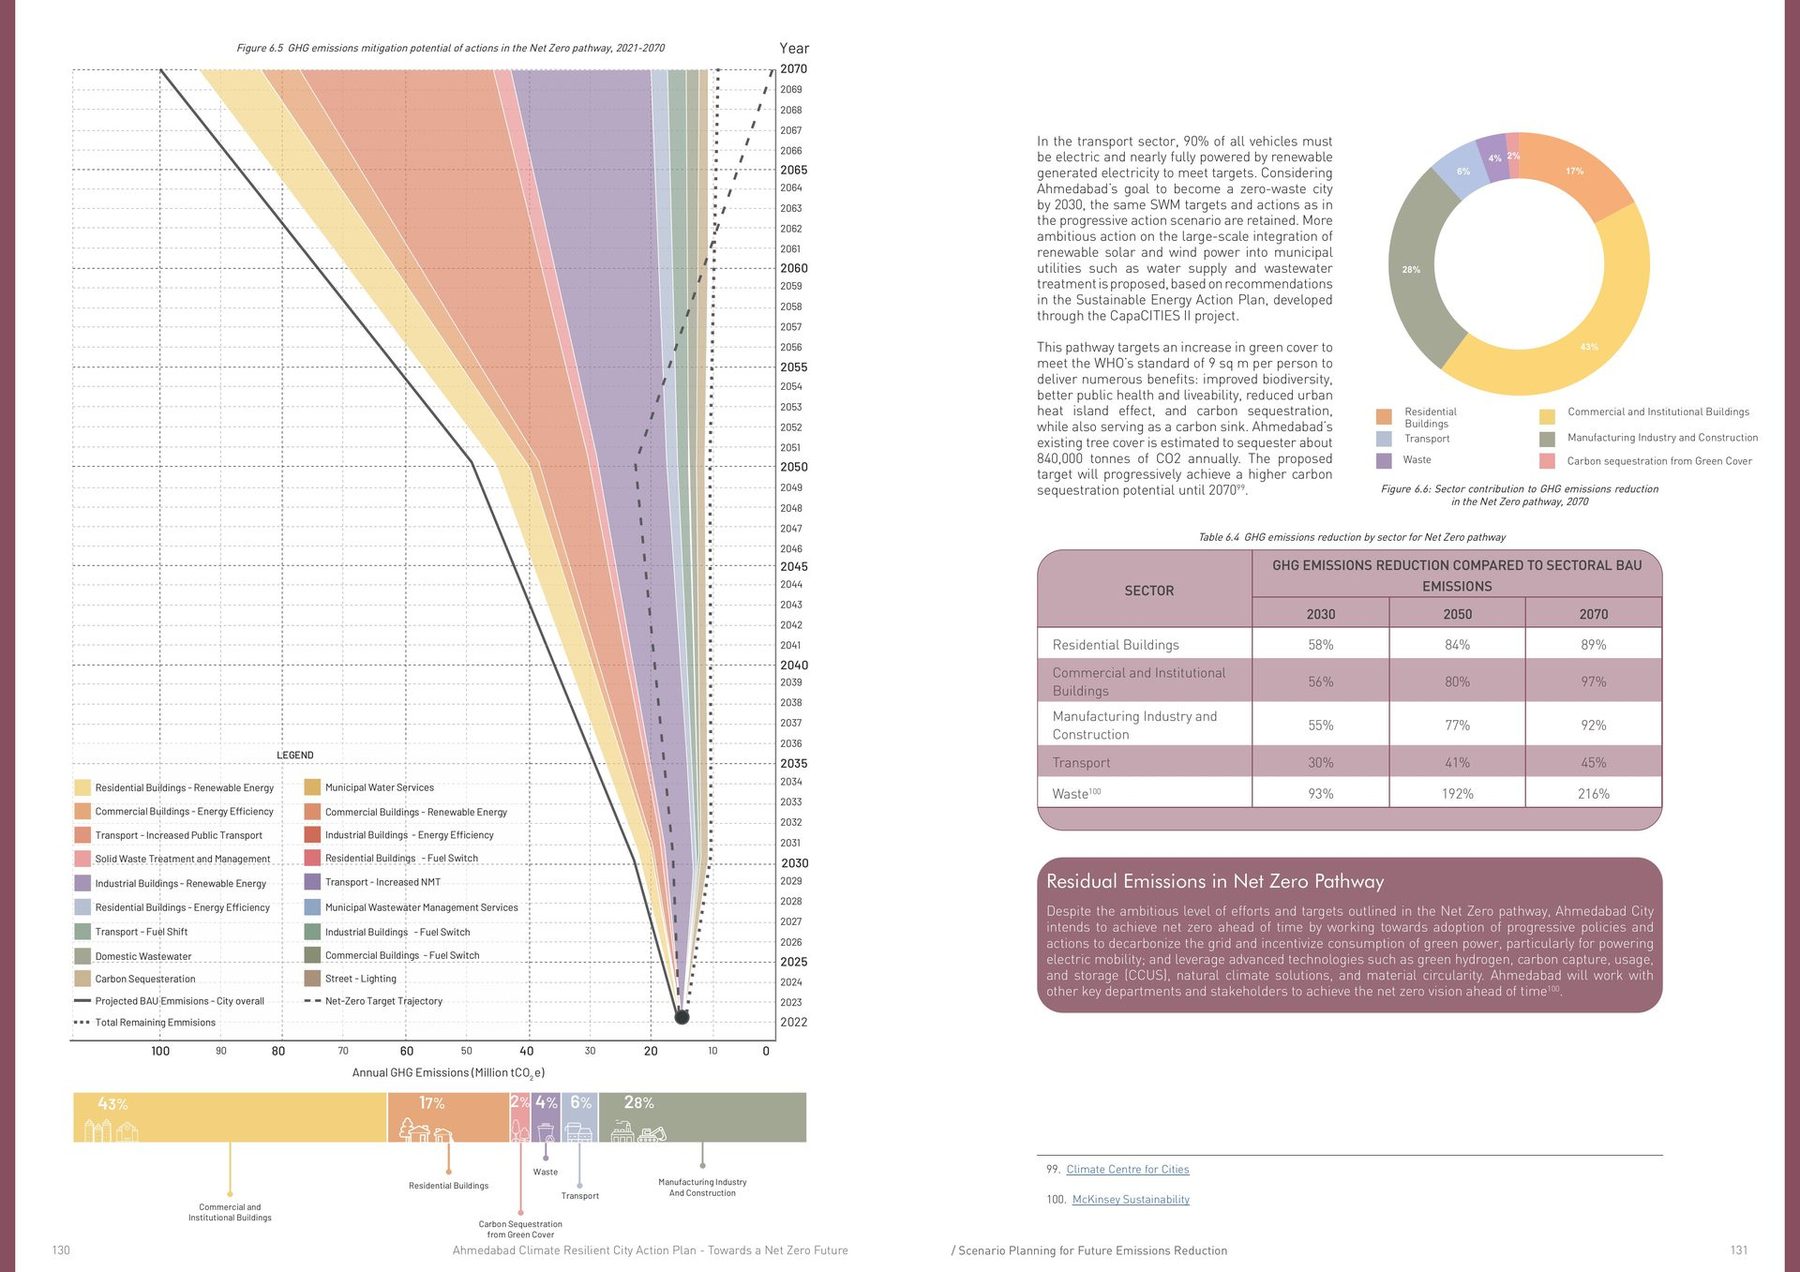
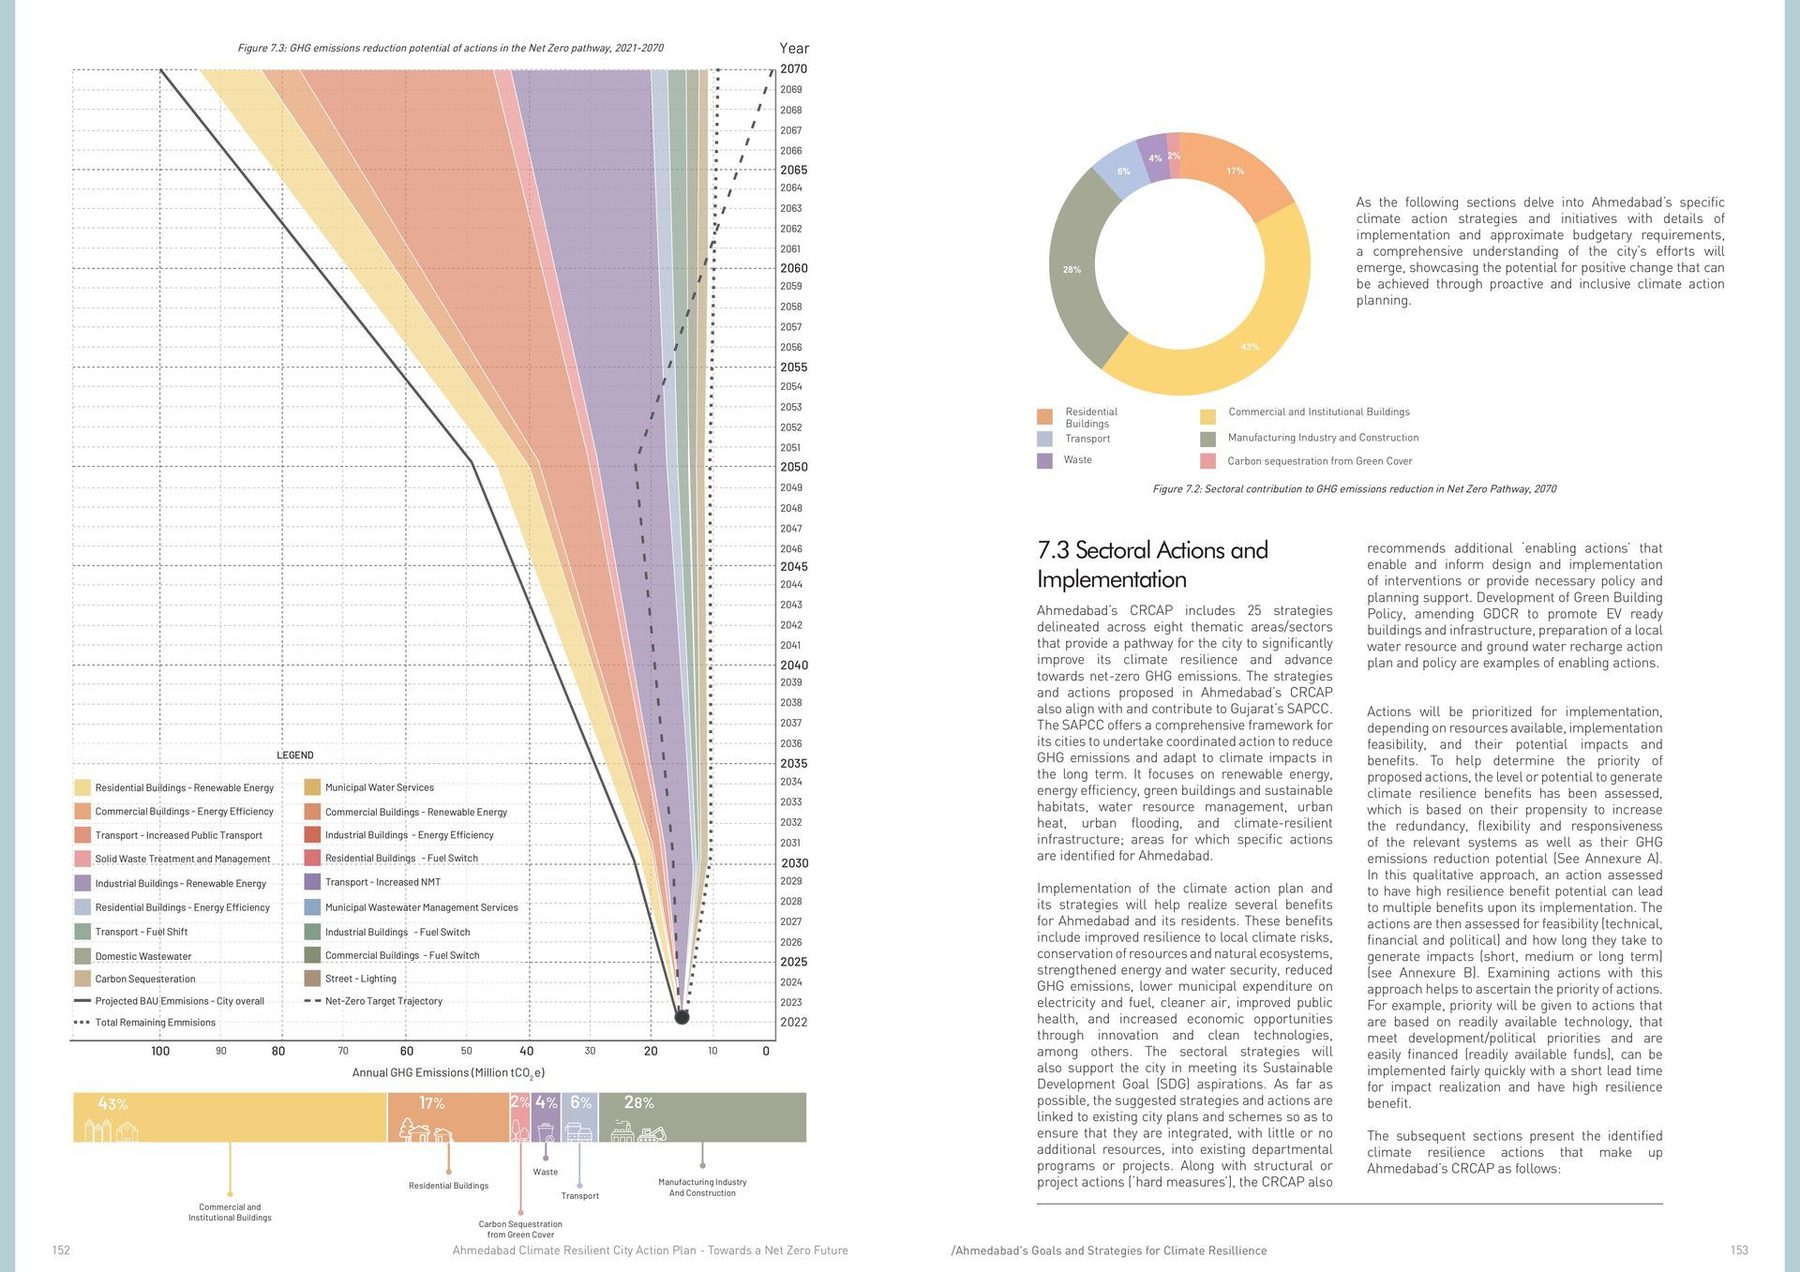
Three lines to 2070. Business as usual, rising past a hundred million tonnes. The progressive action scenario, every scheme and target already on the books at the state and the centre pushed as far as they go, which cuts 76% from BAU and still leaves the city emitting more in 2070 than it does today. And the net-zero pathway, which extends each of those actions until the remaining line meets the target: 55.7% below BAU in 2030, 79.2% in 2050, 91% in 2070.
Each coloured band on the chart is one action's contribution, and the width of the band is its ambition. Buildings (efficient by 2070, green by 2050, running on renewables) do most of the work.
Eight sectors, one goal each
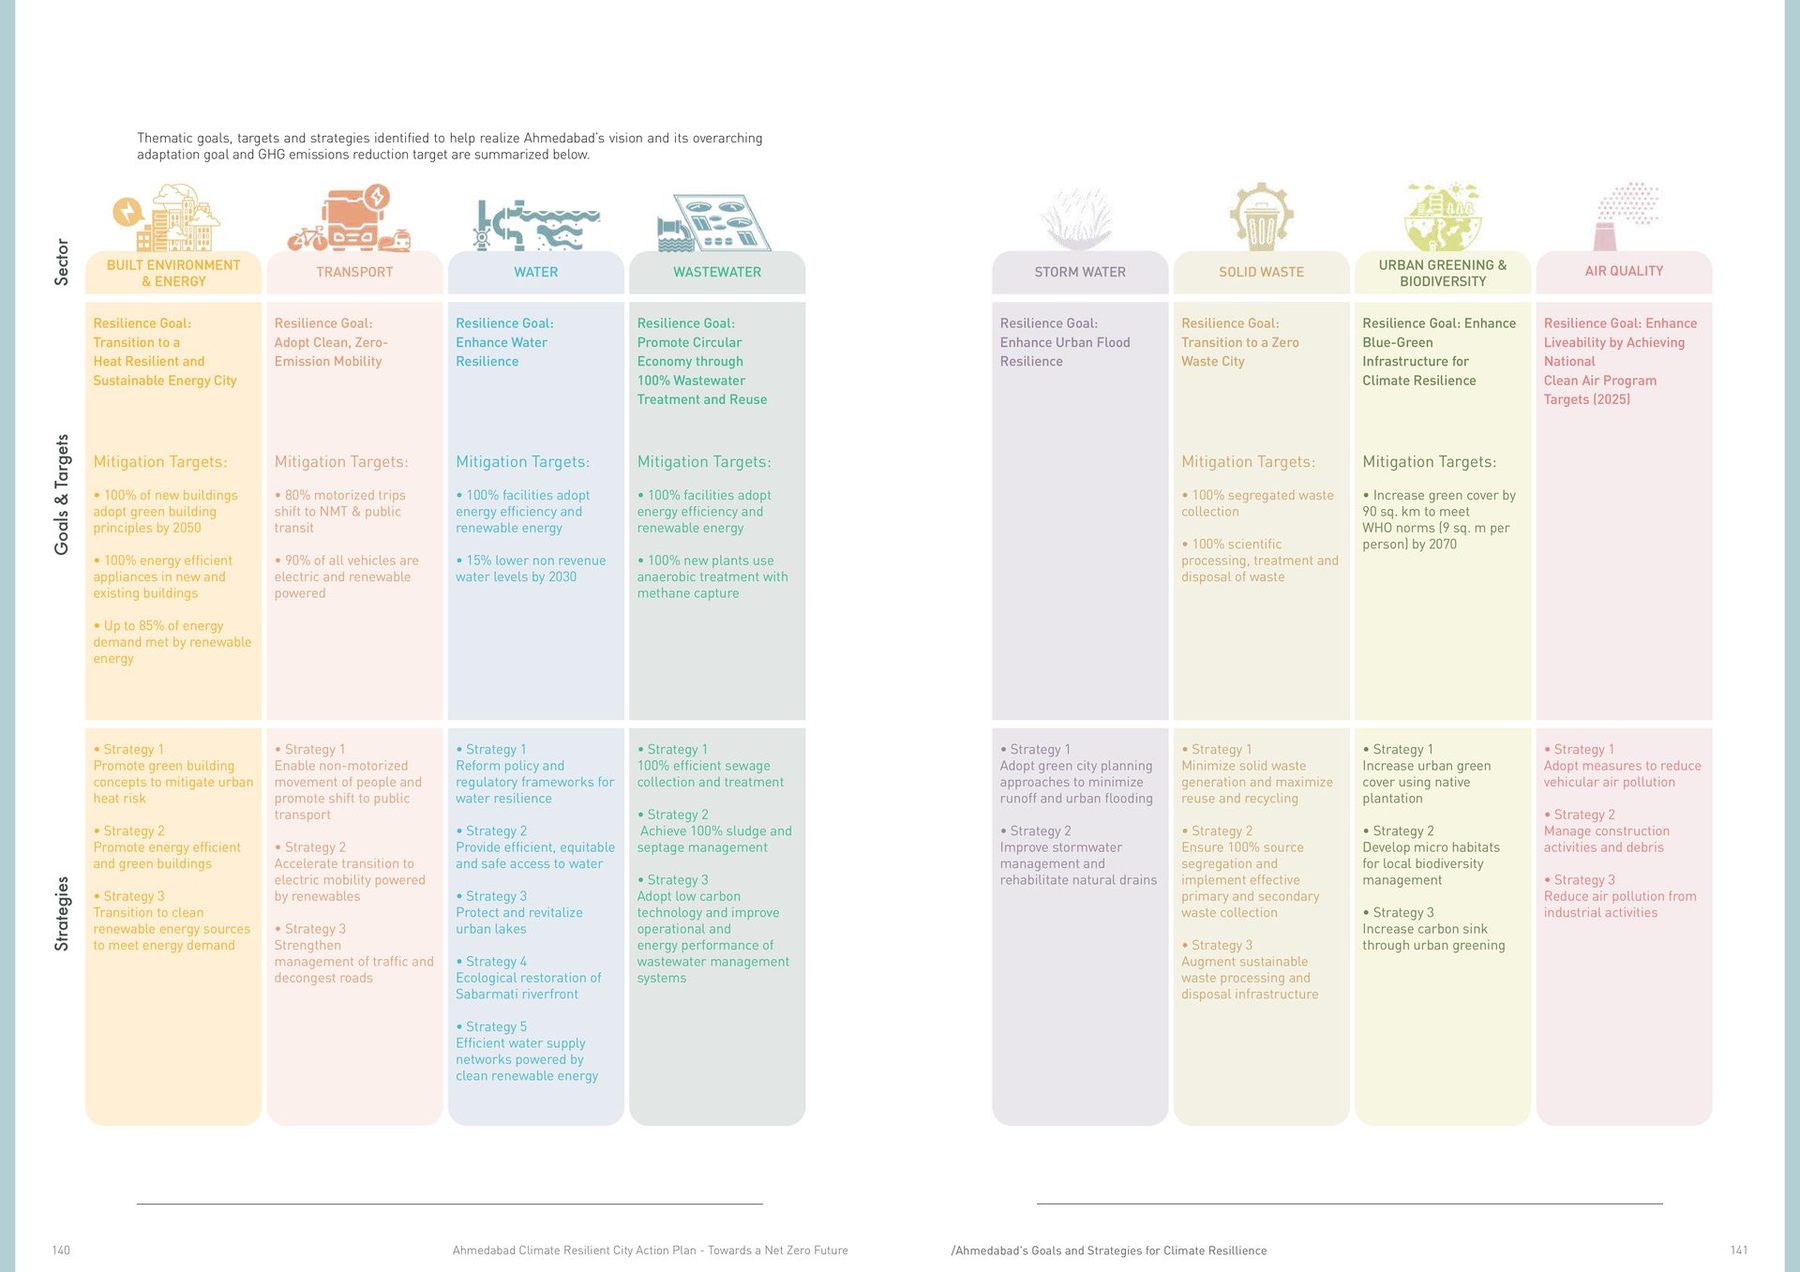
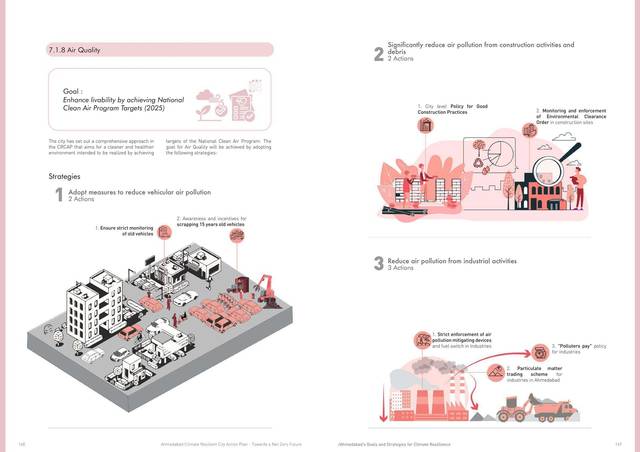
Eight sectors, each with one goal, a handful of strategies, and targets by decade. The goals are plain and measurable: a heat-resilient, sustainable-energy city; 80% of trips on foot, cycle or public transport; 100% wastewater treated and reused; a zero-waste city; the National Clean Air Programme met. My part of the book begins here: the strategies were drawn before they were tabulated, so that a department head could see the piece of city each one changes.
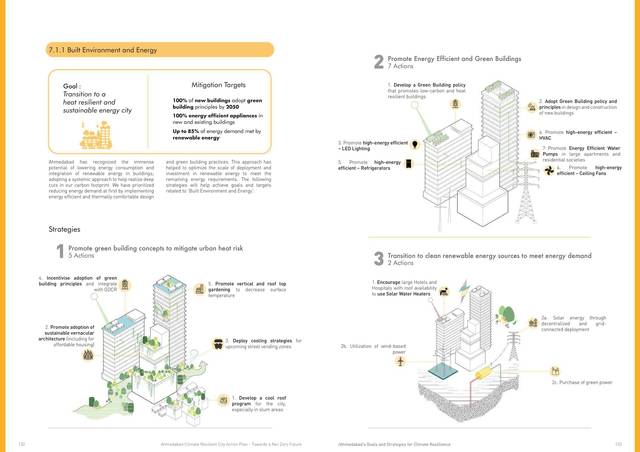
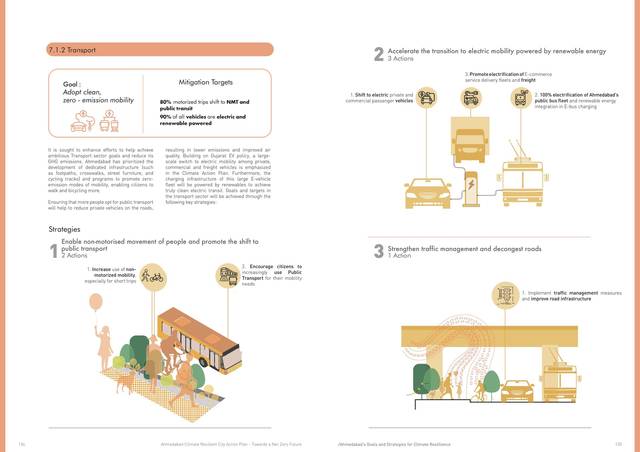
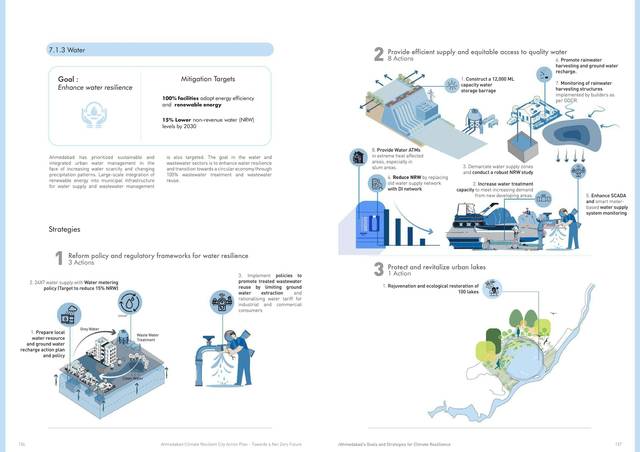
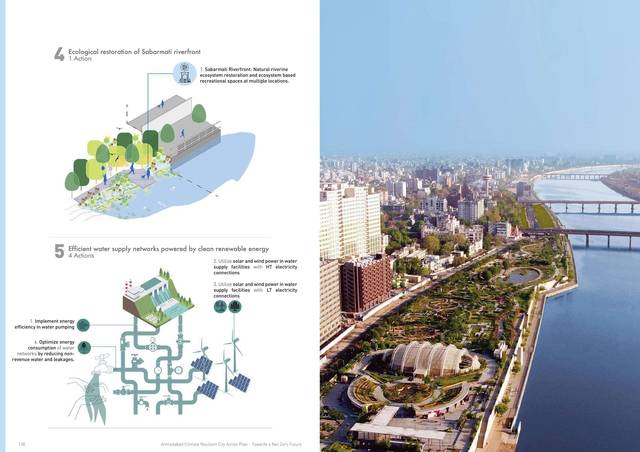
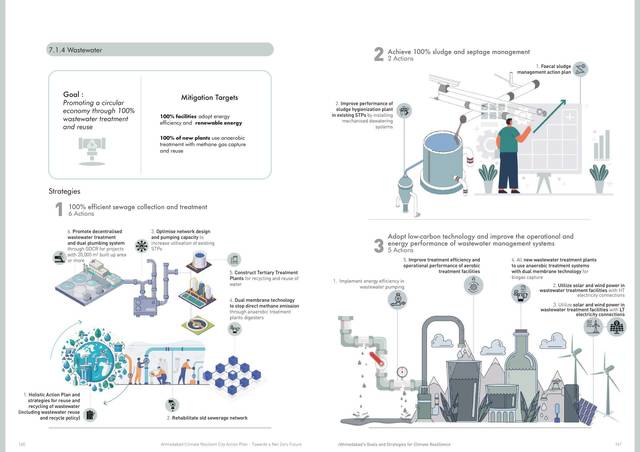
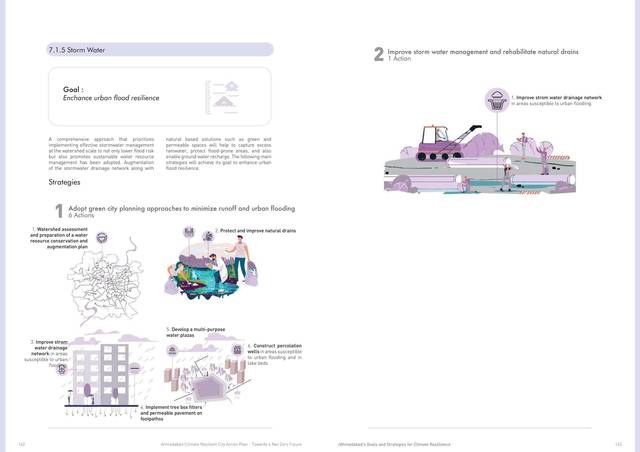
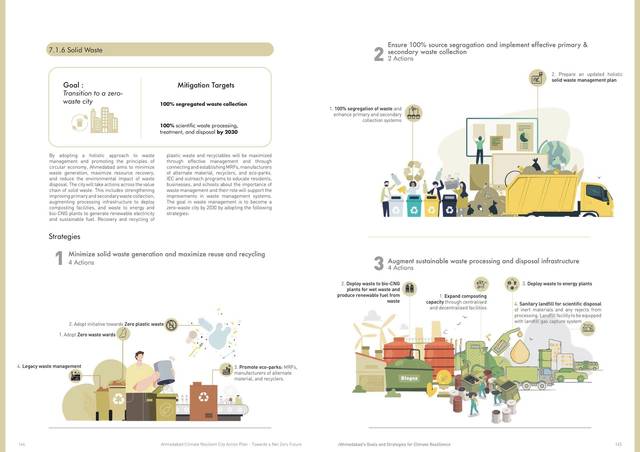
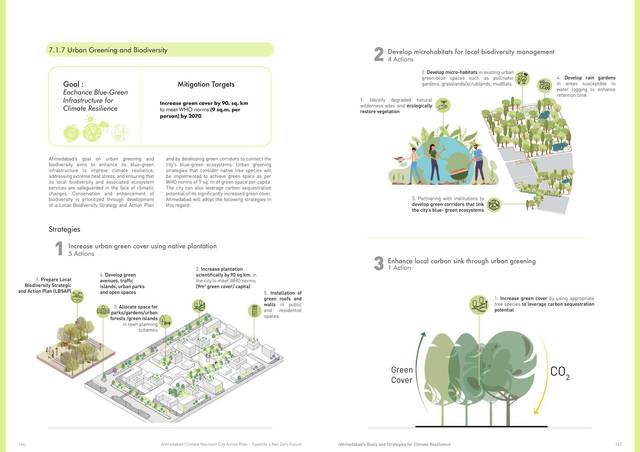
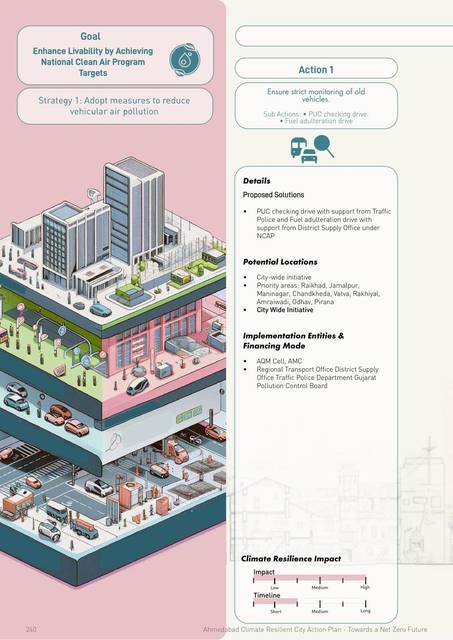
Forty-five sheets a department can pick up
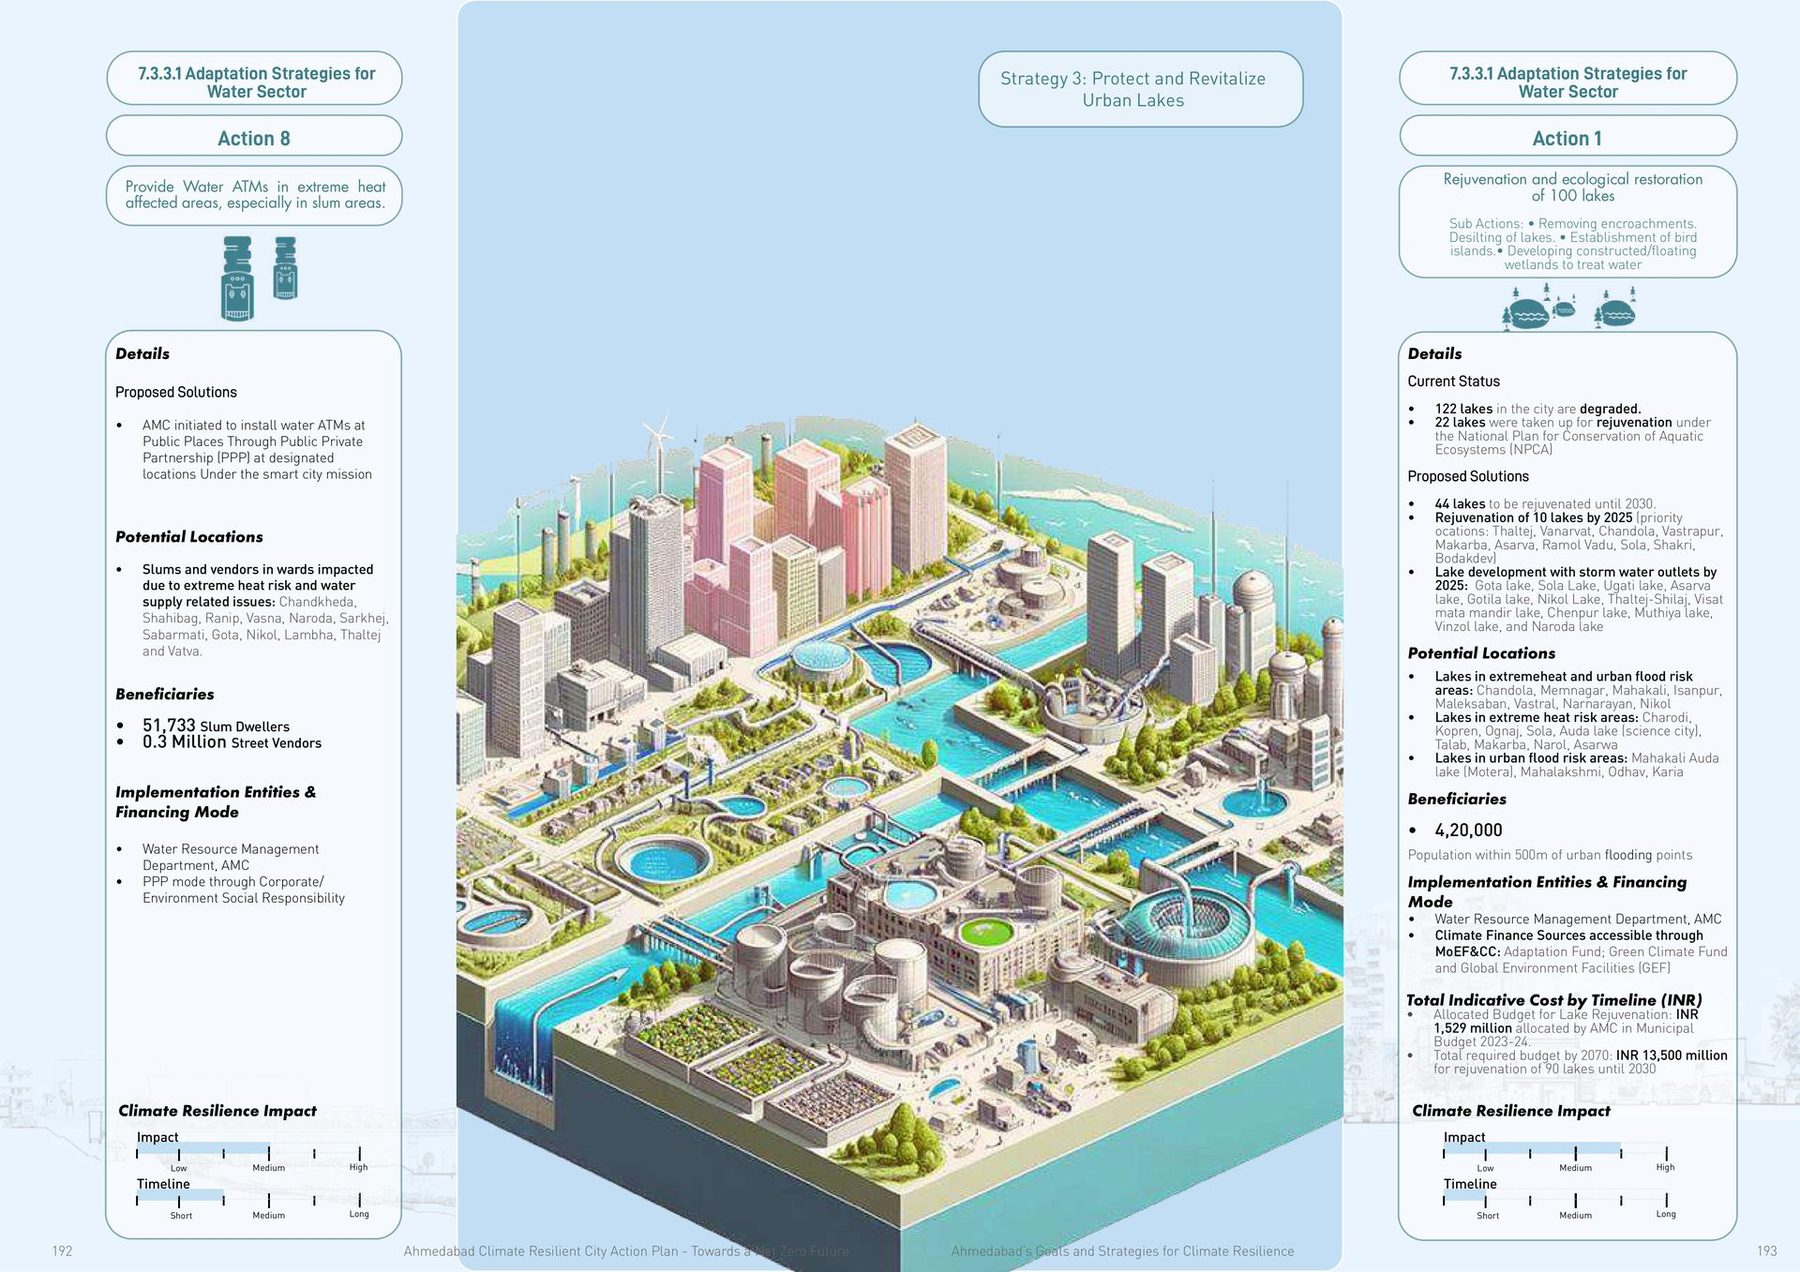
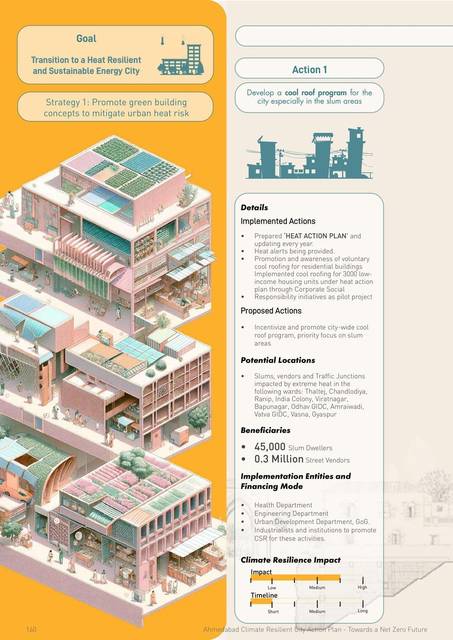
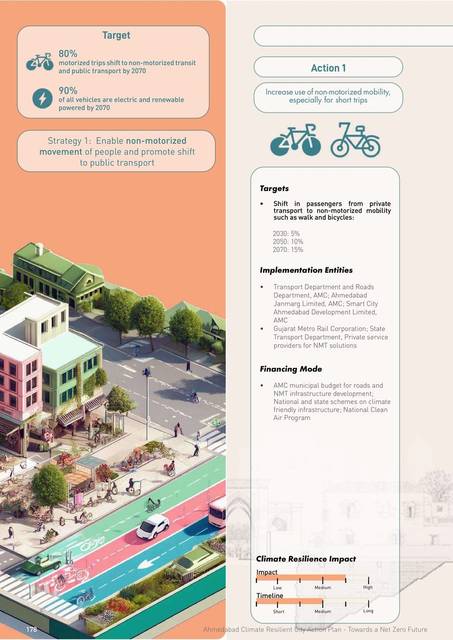
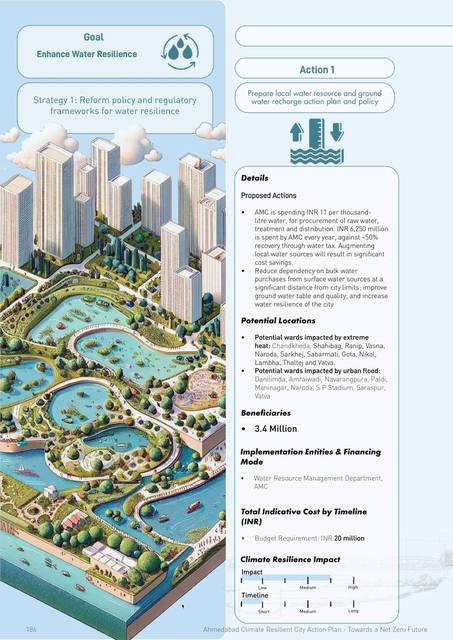
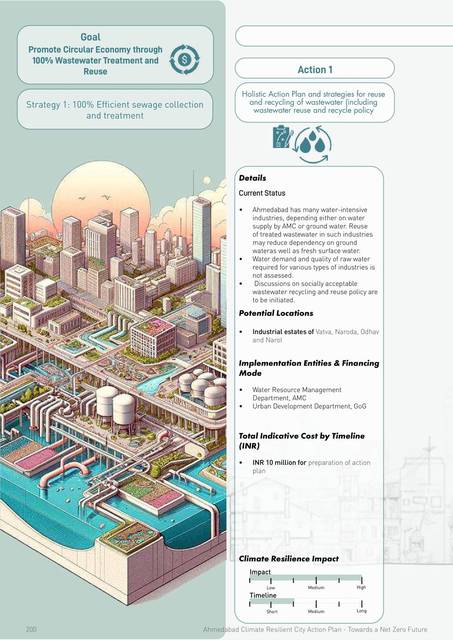
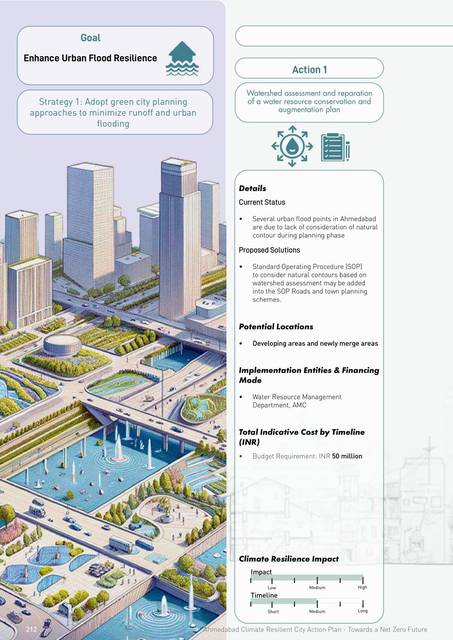
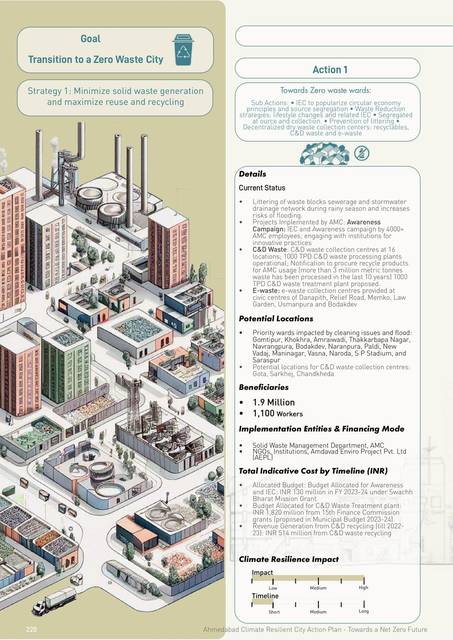
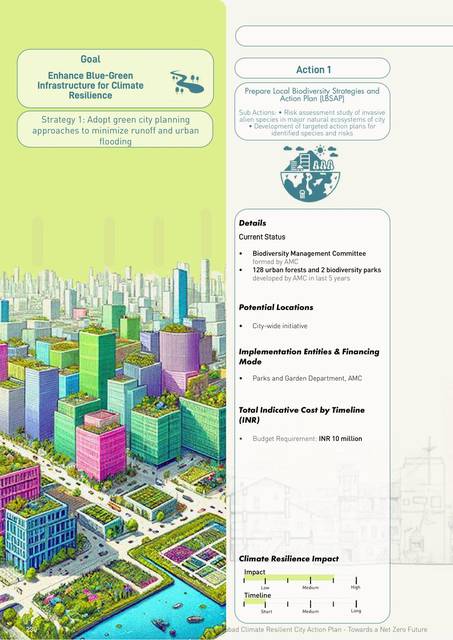
Forty-five action sheets, one format throughout. An isometric of the intervention on the left; on the right its target, the entity that implements it, the financing mode, the indicative cost and timeline, and a resilience score. The sheets are the part of the plan that gets picked up: a sheet is what a department takes to a budget meeting.