can four cities on two coasts be measured the same way, and what does the measurement change?
Green City Action Plans for Kota Bharu, Langkawi, Kuching–Padawan and Penang Island, four cities read on one instrument, from base map to inventory to investment.
A Green City Action Plan is a city's first climate ledger: what it is, what it is exposed to, what it emits, and what it should build next. ICLEI South Asia prepared four of them for the Indonesia–Malaysia–Thailand Growth Triangle (Kota Bharu on the east coast, Langkawi and Penang Island off the west, Kuching's Padawan council in Sarawak) on one method, so that a state secretariat can read them side by side. Each runs the same four sections: a city profile built in GIS, a climate risk and vulnerability assessment, a GPC-compliant GHG inventory for 2017–2022, and the priority sectors and investment projects that follow. My work ran across all four: the maps, the inventory, the sector diagrams that open each city's services, and the books themselves.
- (role)
- co-author · gis analysis · ghg inventory · sector diagrams · book design
- (period)
- 2023–2024
- (context)
- iclei south asia · imt-gt jbc malaysia · four local governments
- (status)
- published · 2024
One method, two coasts, a state and an island
The Indonesia–Malaysia–Thailand Growth Triangle asked for green city action plans for four Malaysian local governments at once, and the point of doing four together was the method. A state secretariat reading Kota Bharu next to Penang needs the same sections in the same order, built from the same kinds of data: a city profile from GIS, a climate risk and vulnerability assessment on the ClimateResilientCITIES method, a GHG inventory on the Global Protocol at BASIC level for 2017 to 2022, and a list of priority sectors and quality-infrastructure projects a bank can pick up. The method is the real deliverable; the four books are it, run four times. This page reads them the way the secretariat would: each layer, four cities across.
Each layer, four cities across
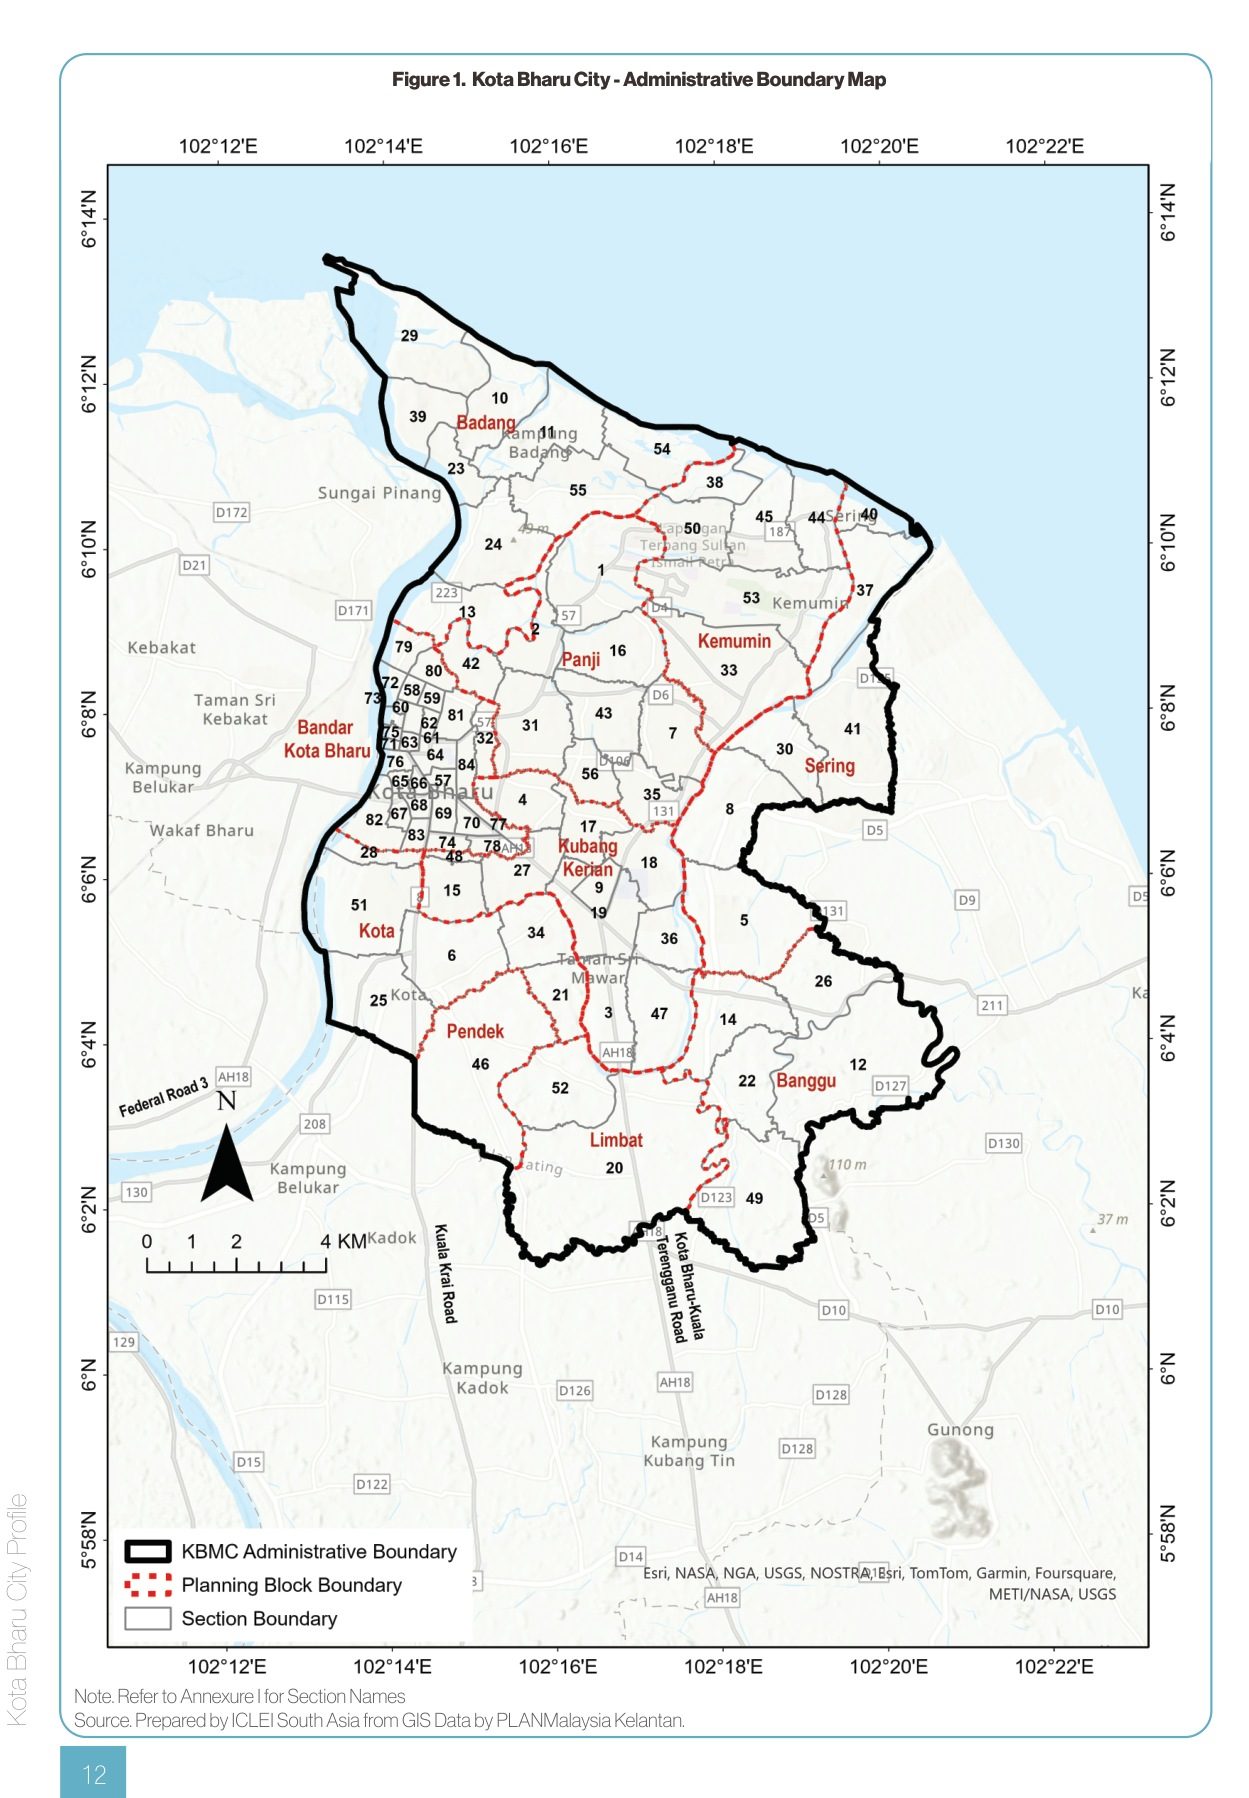
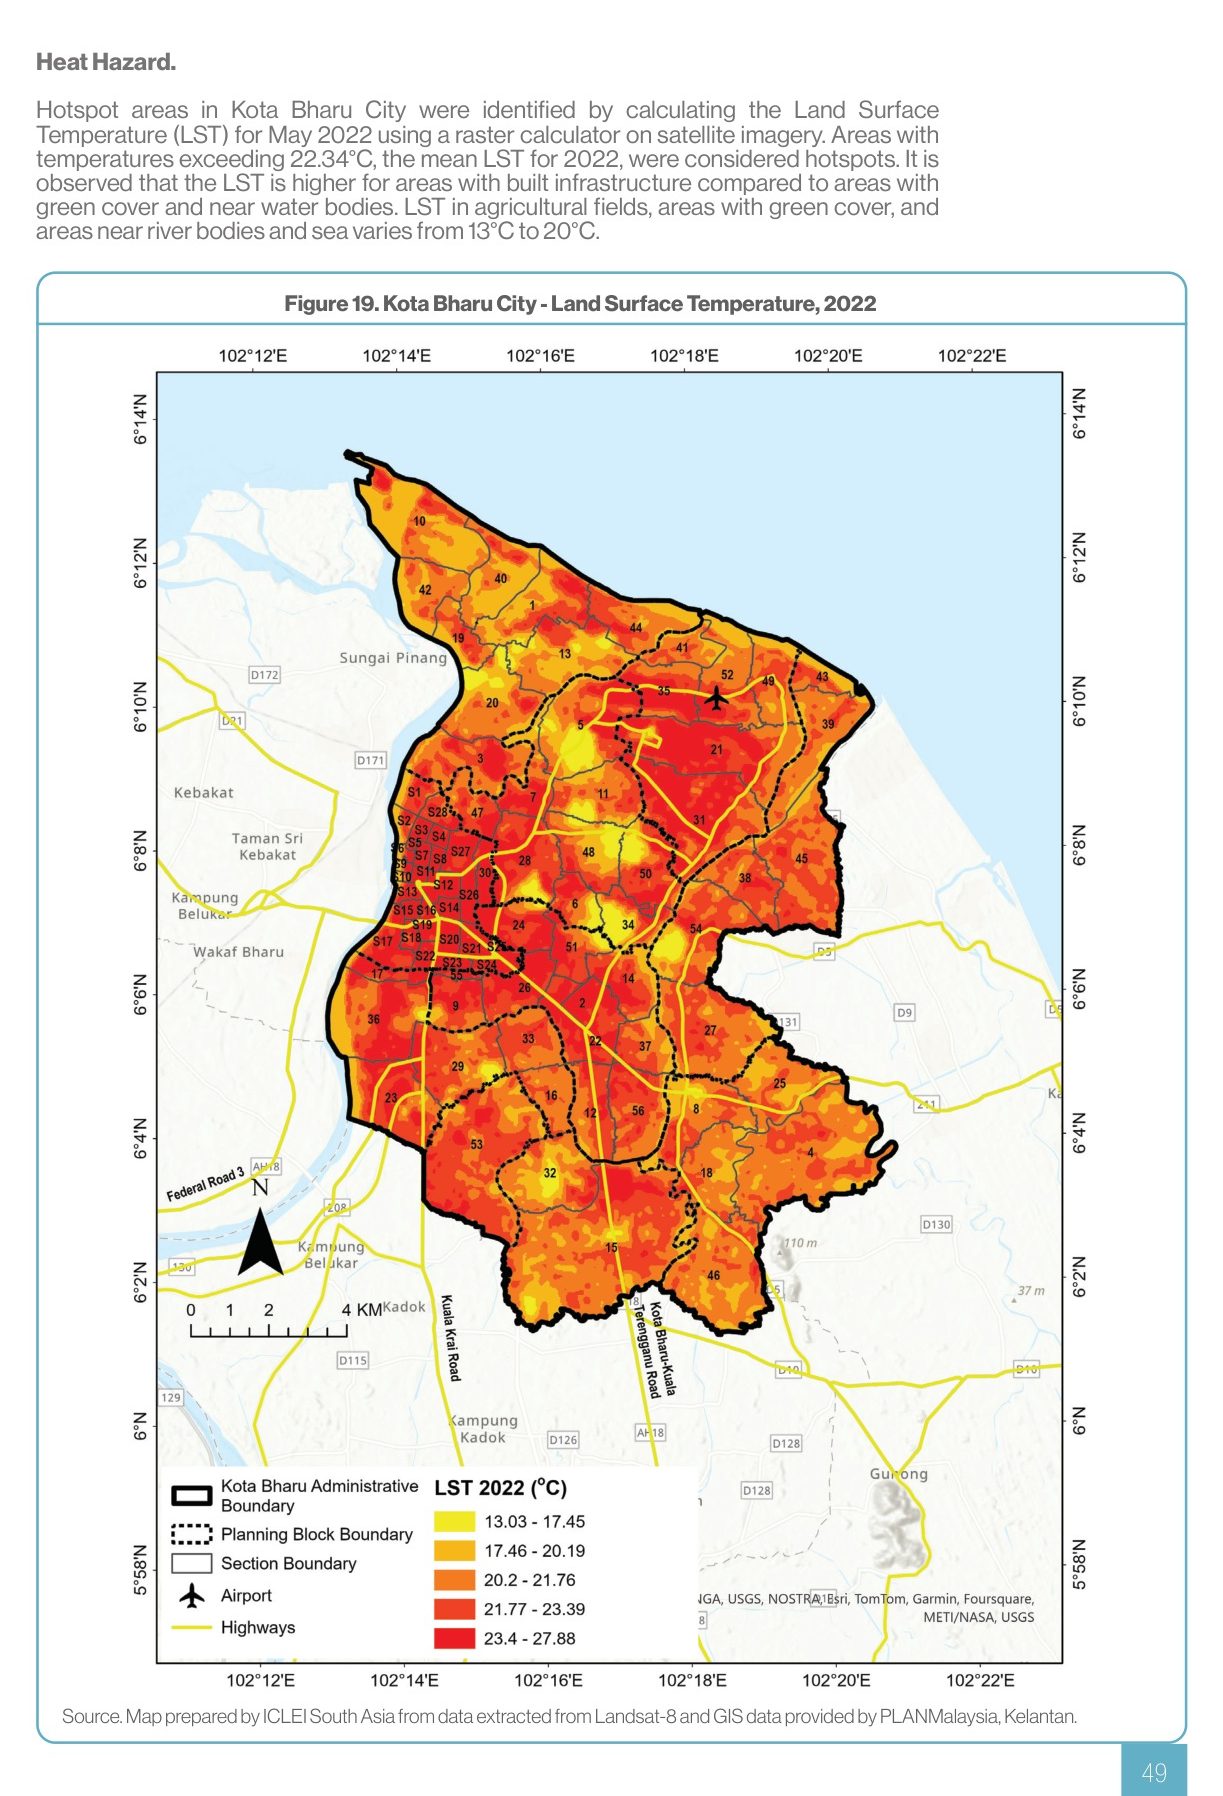
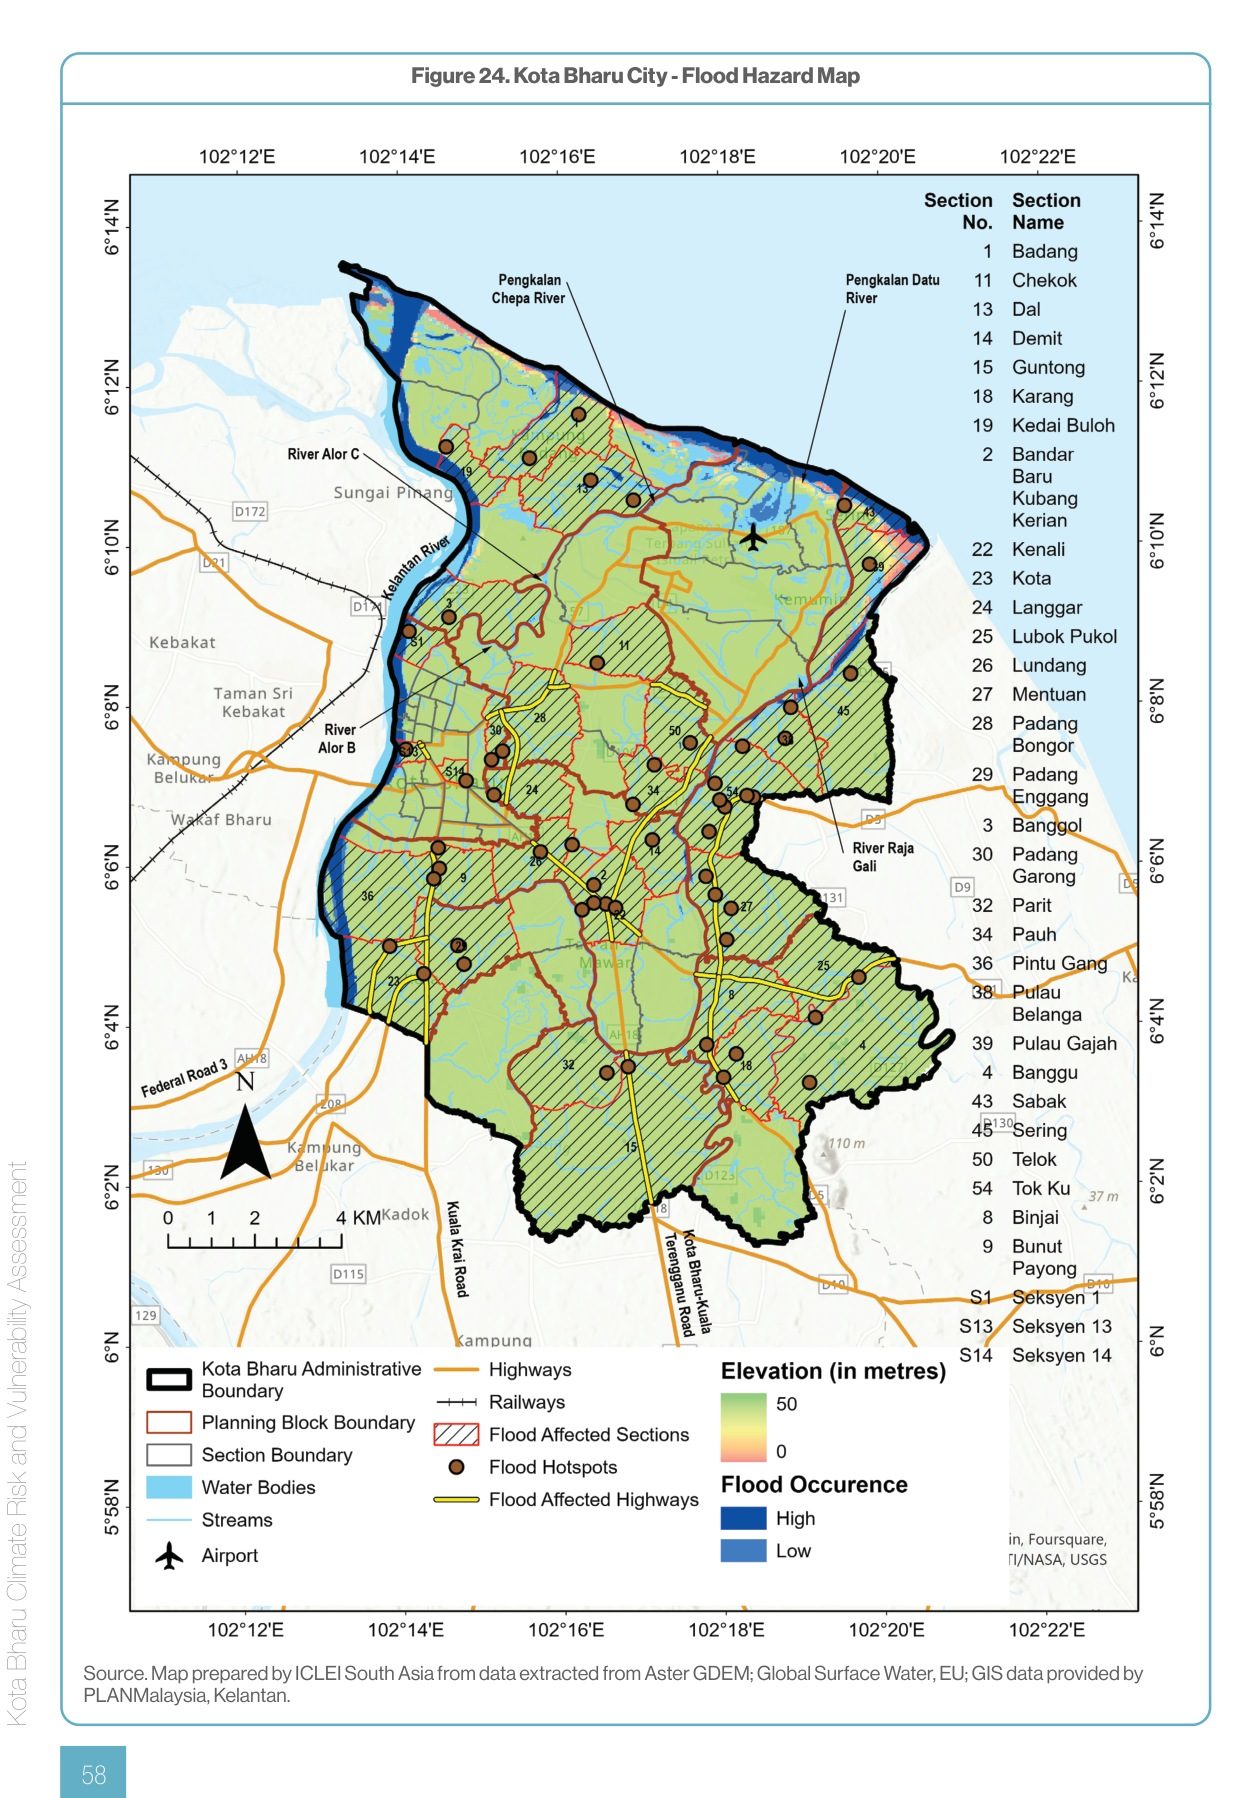
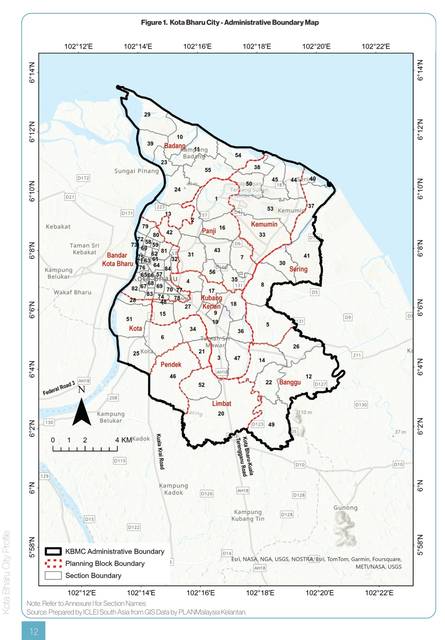
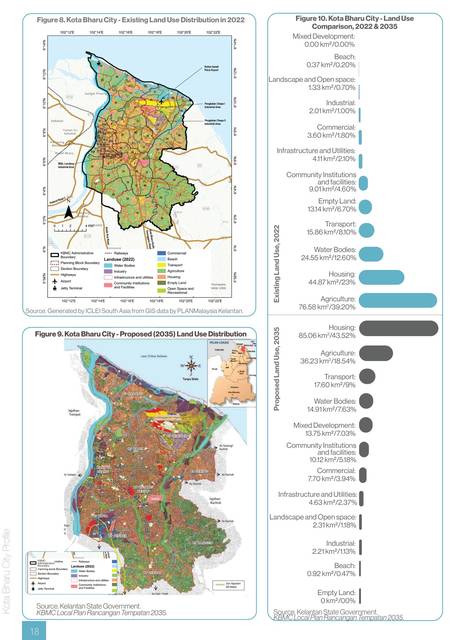
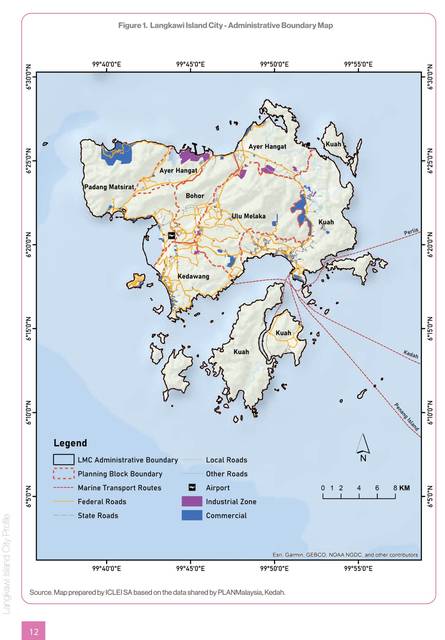
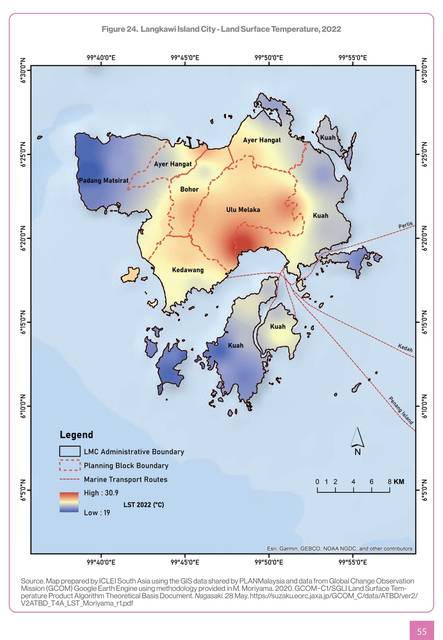
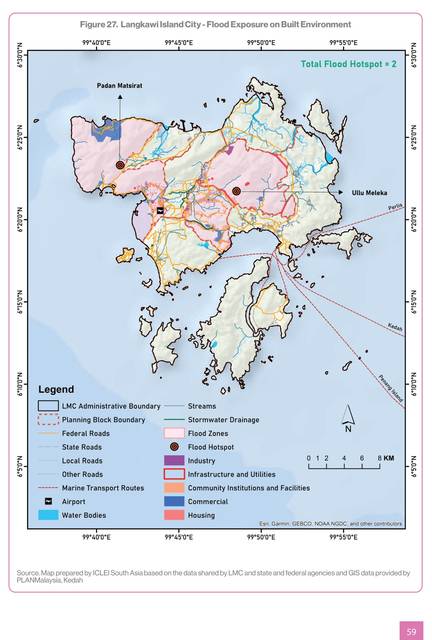
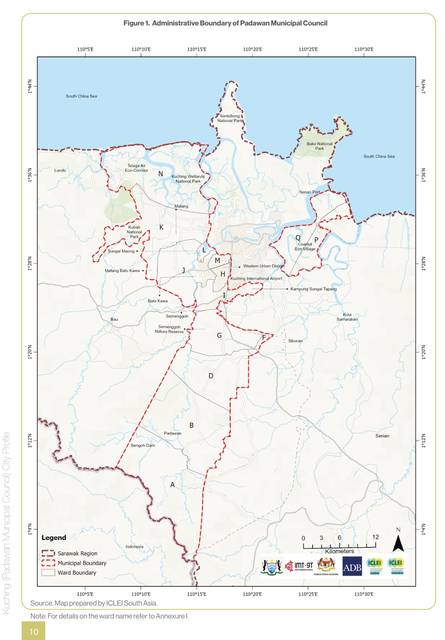
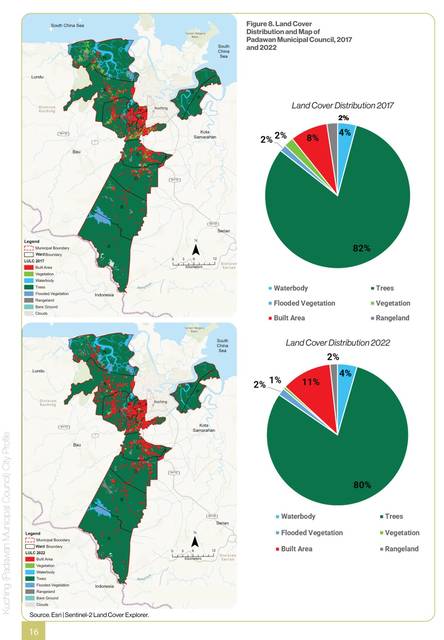
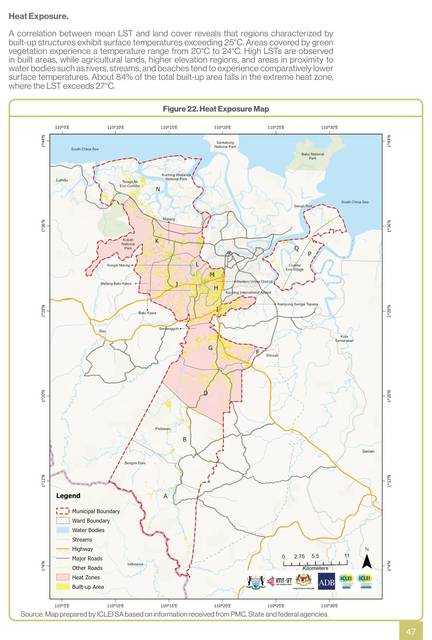
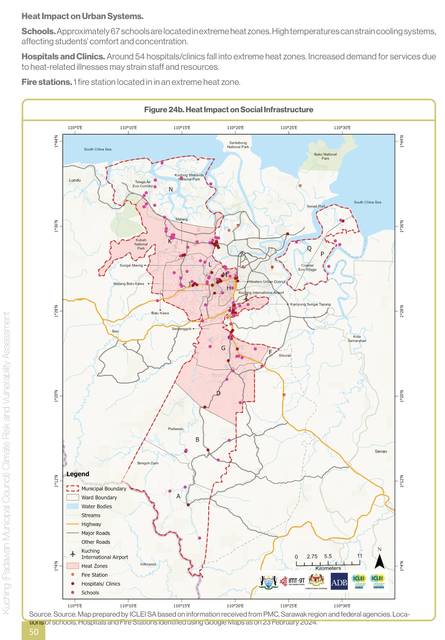
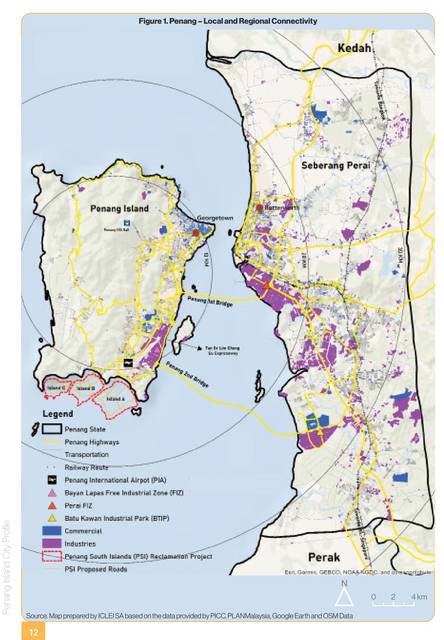
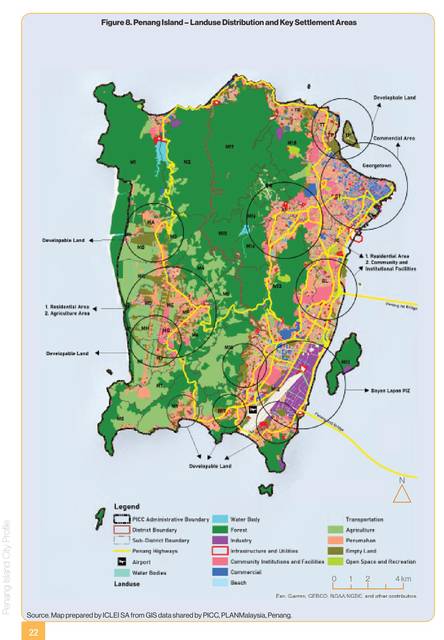
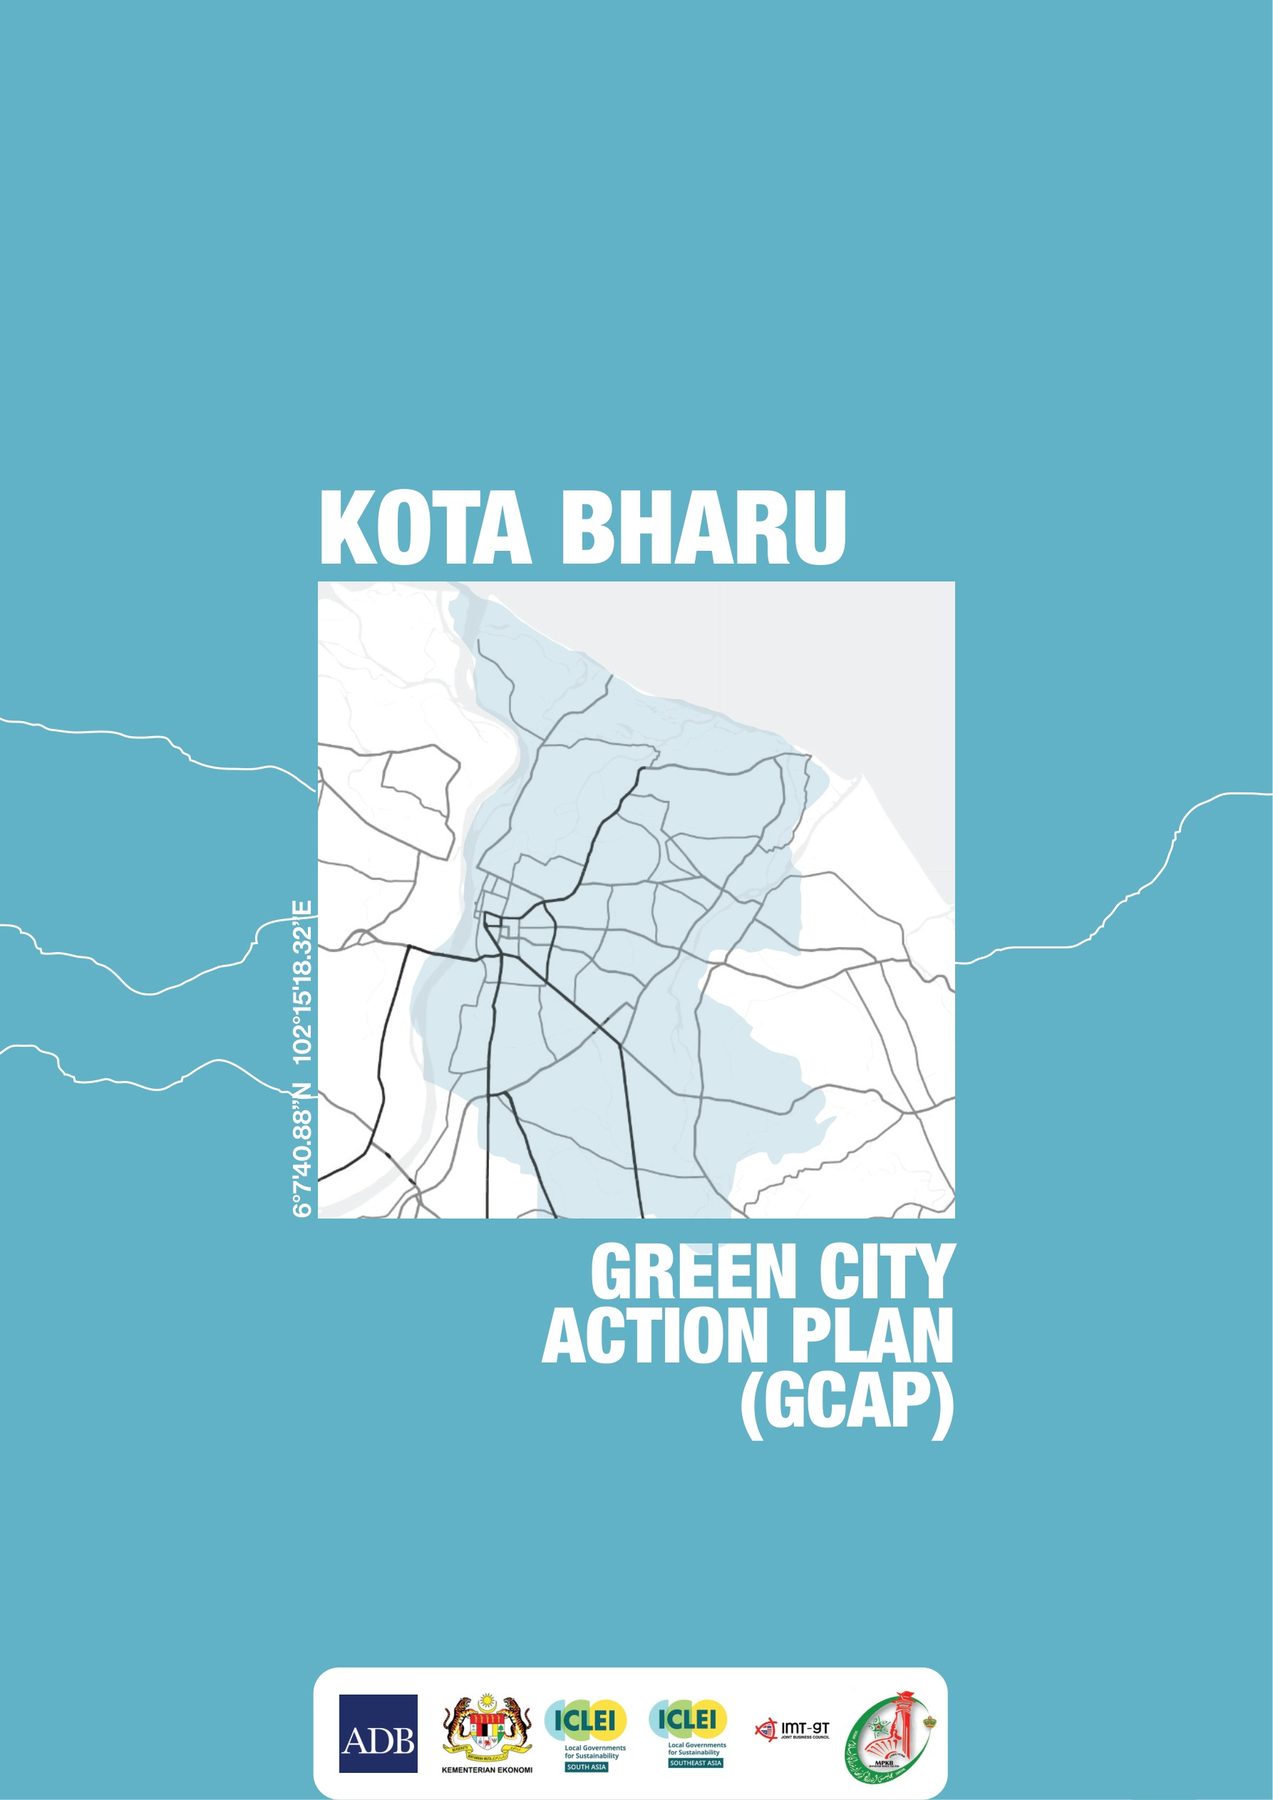
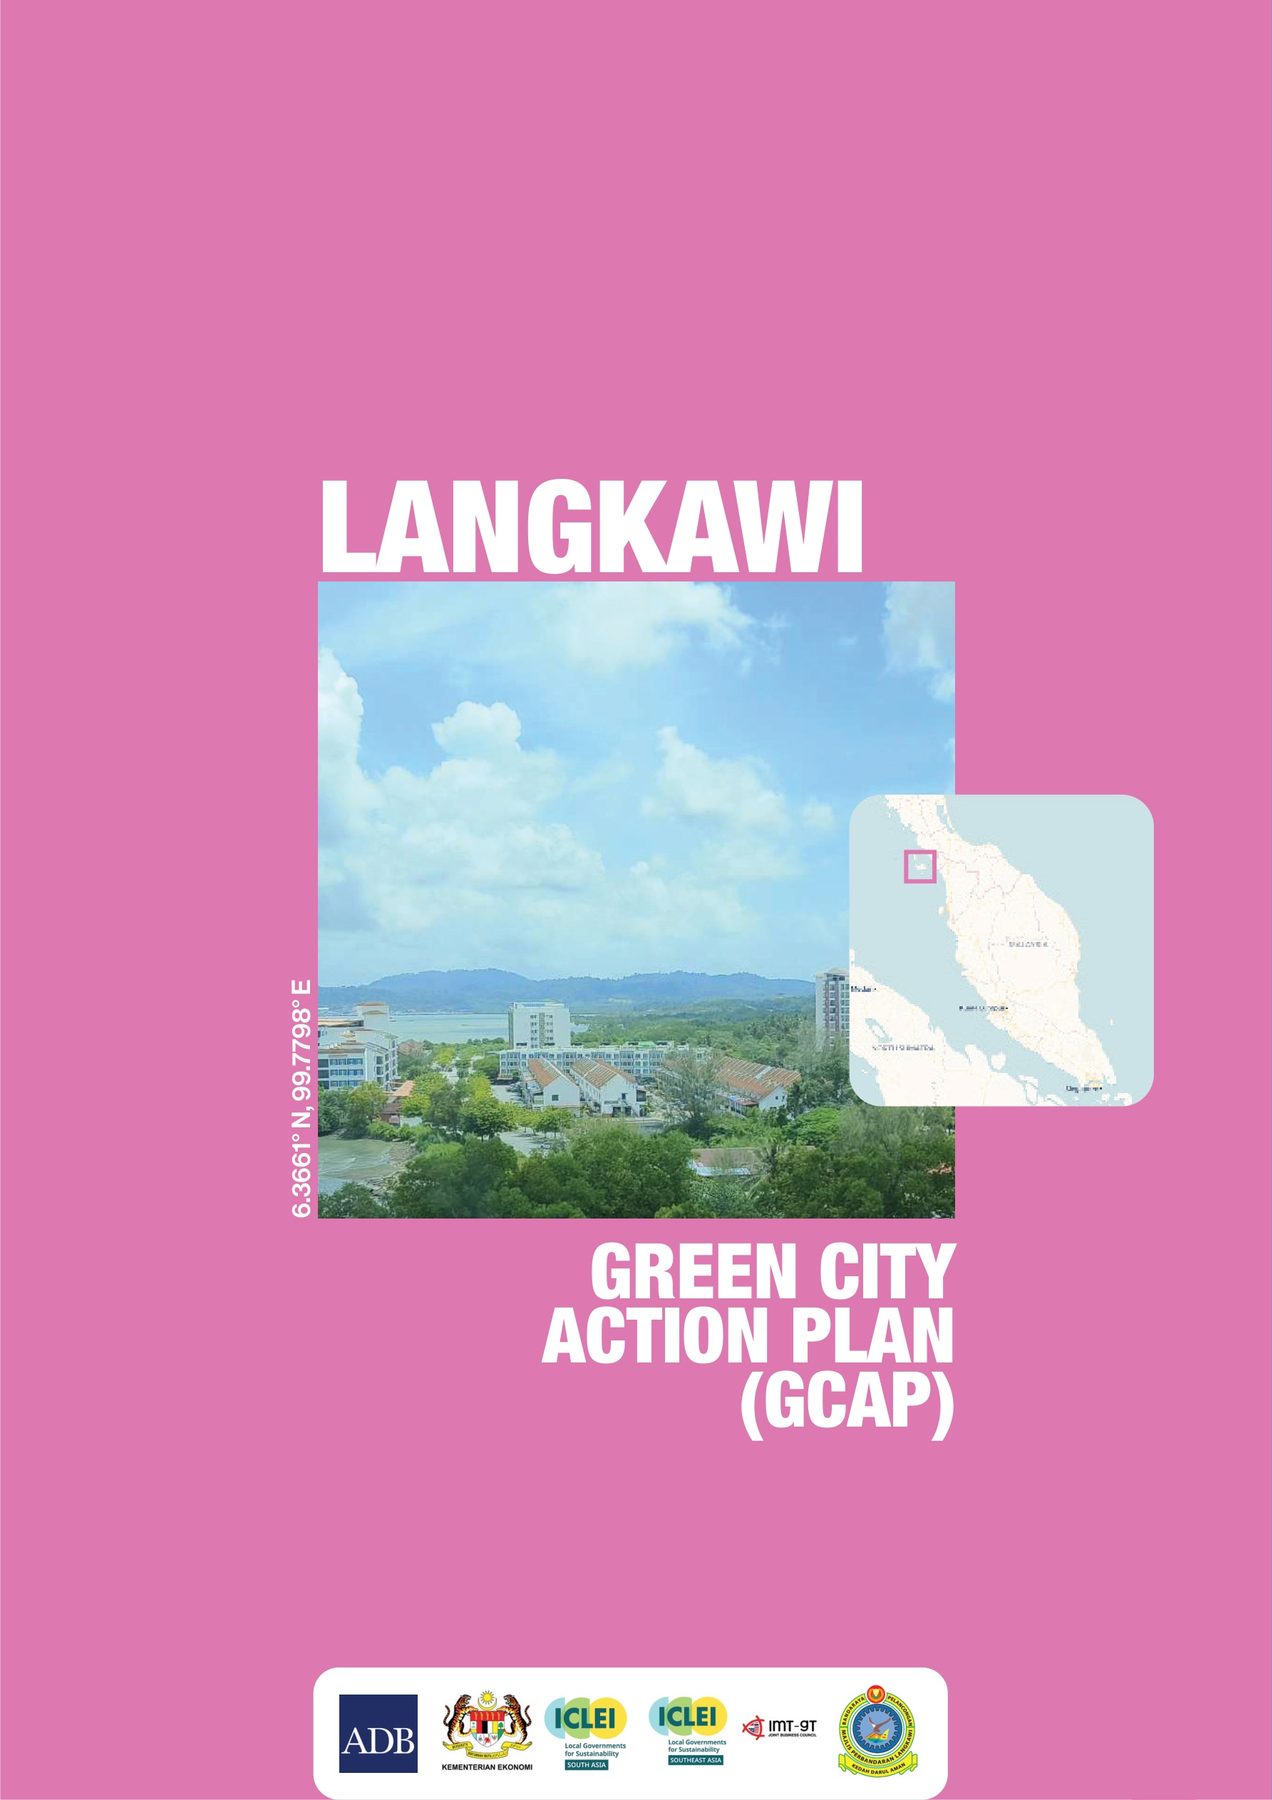
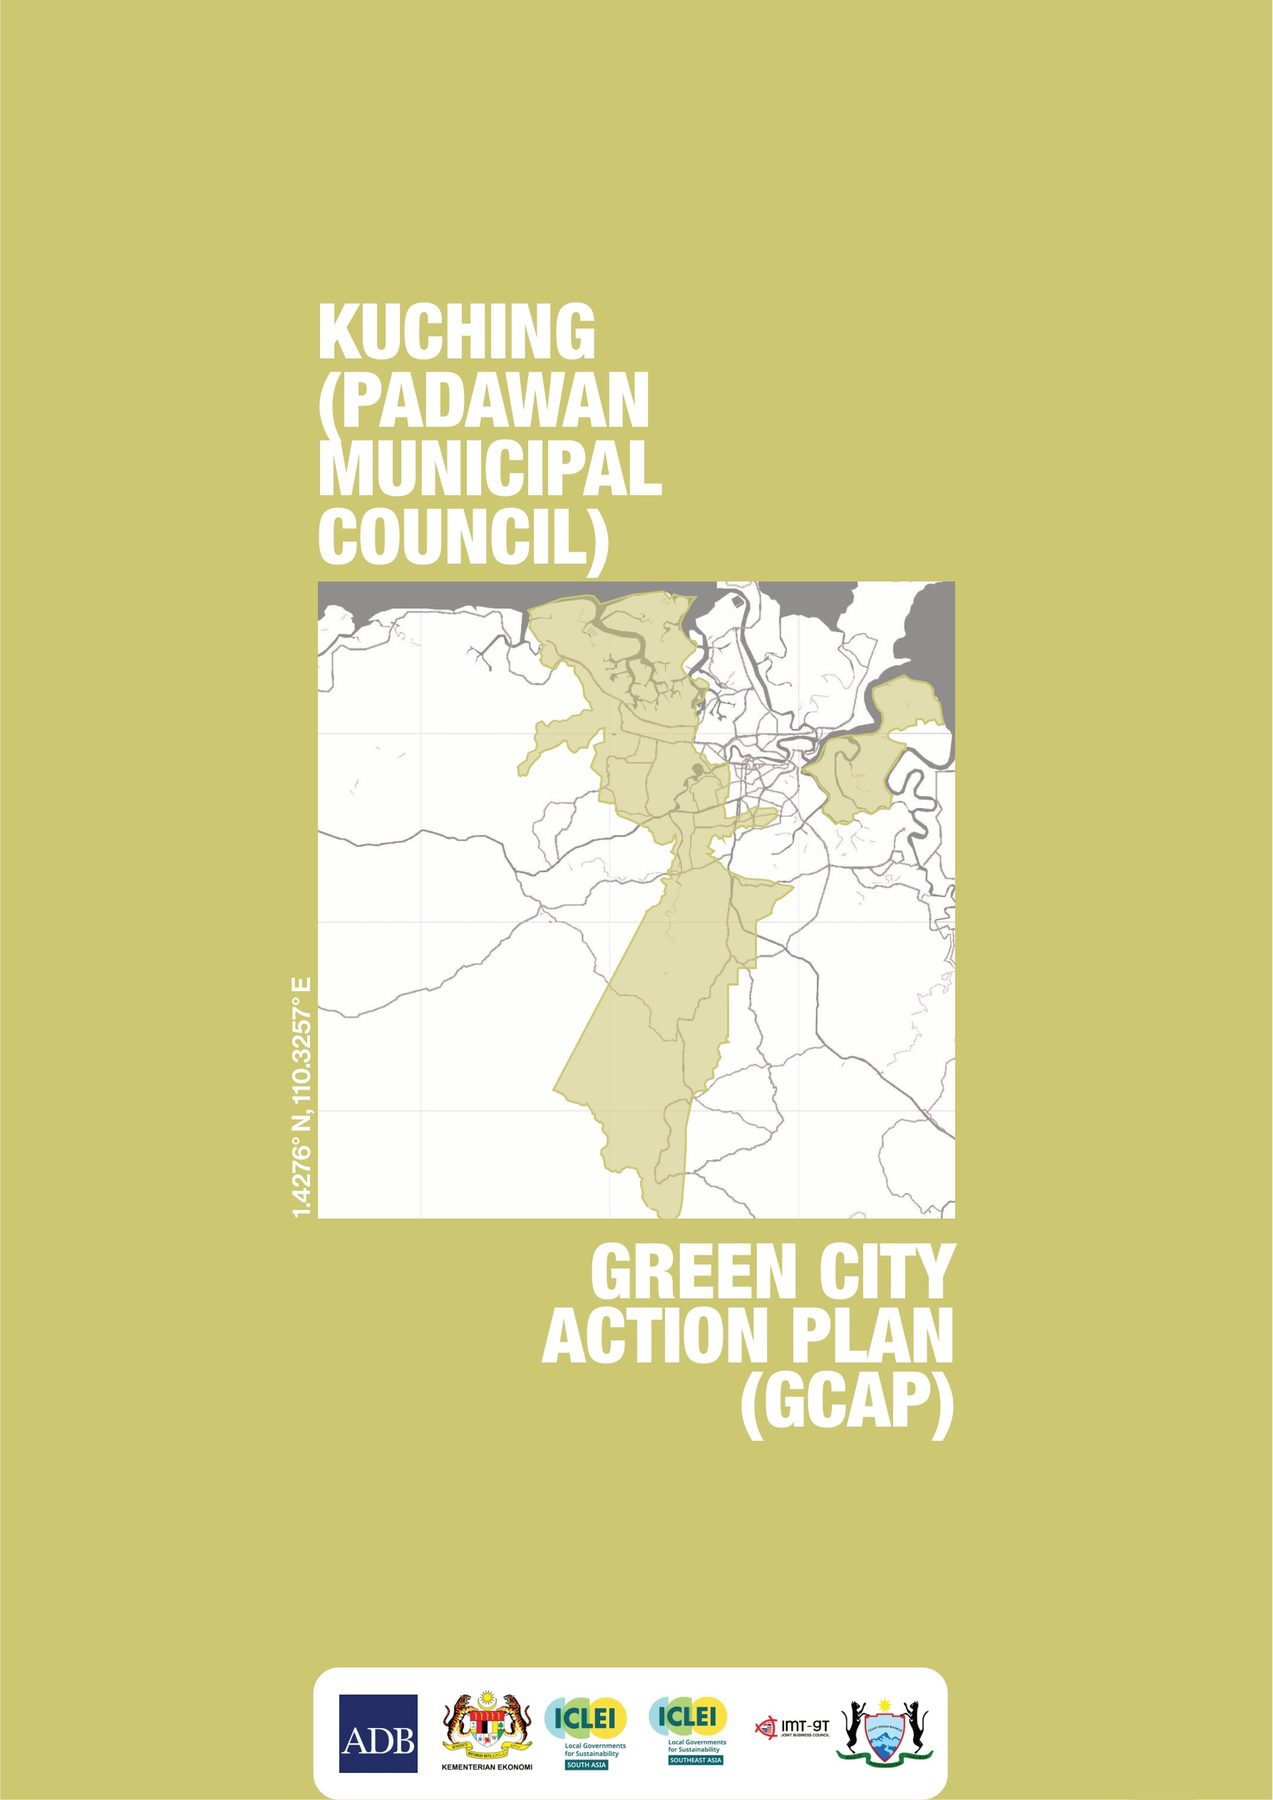
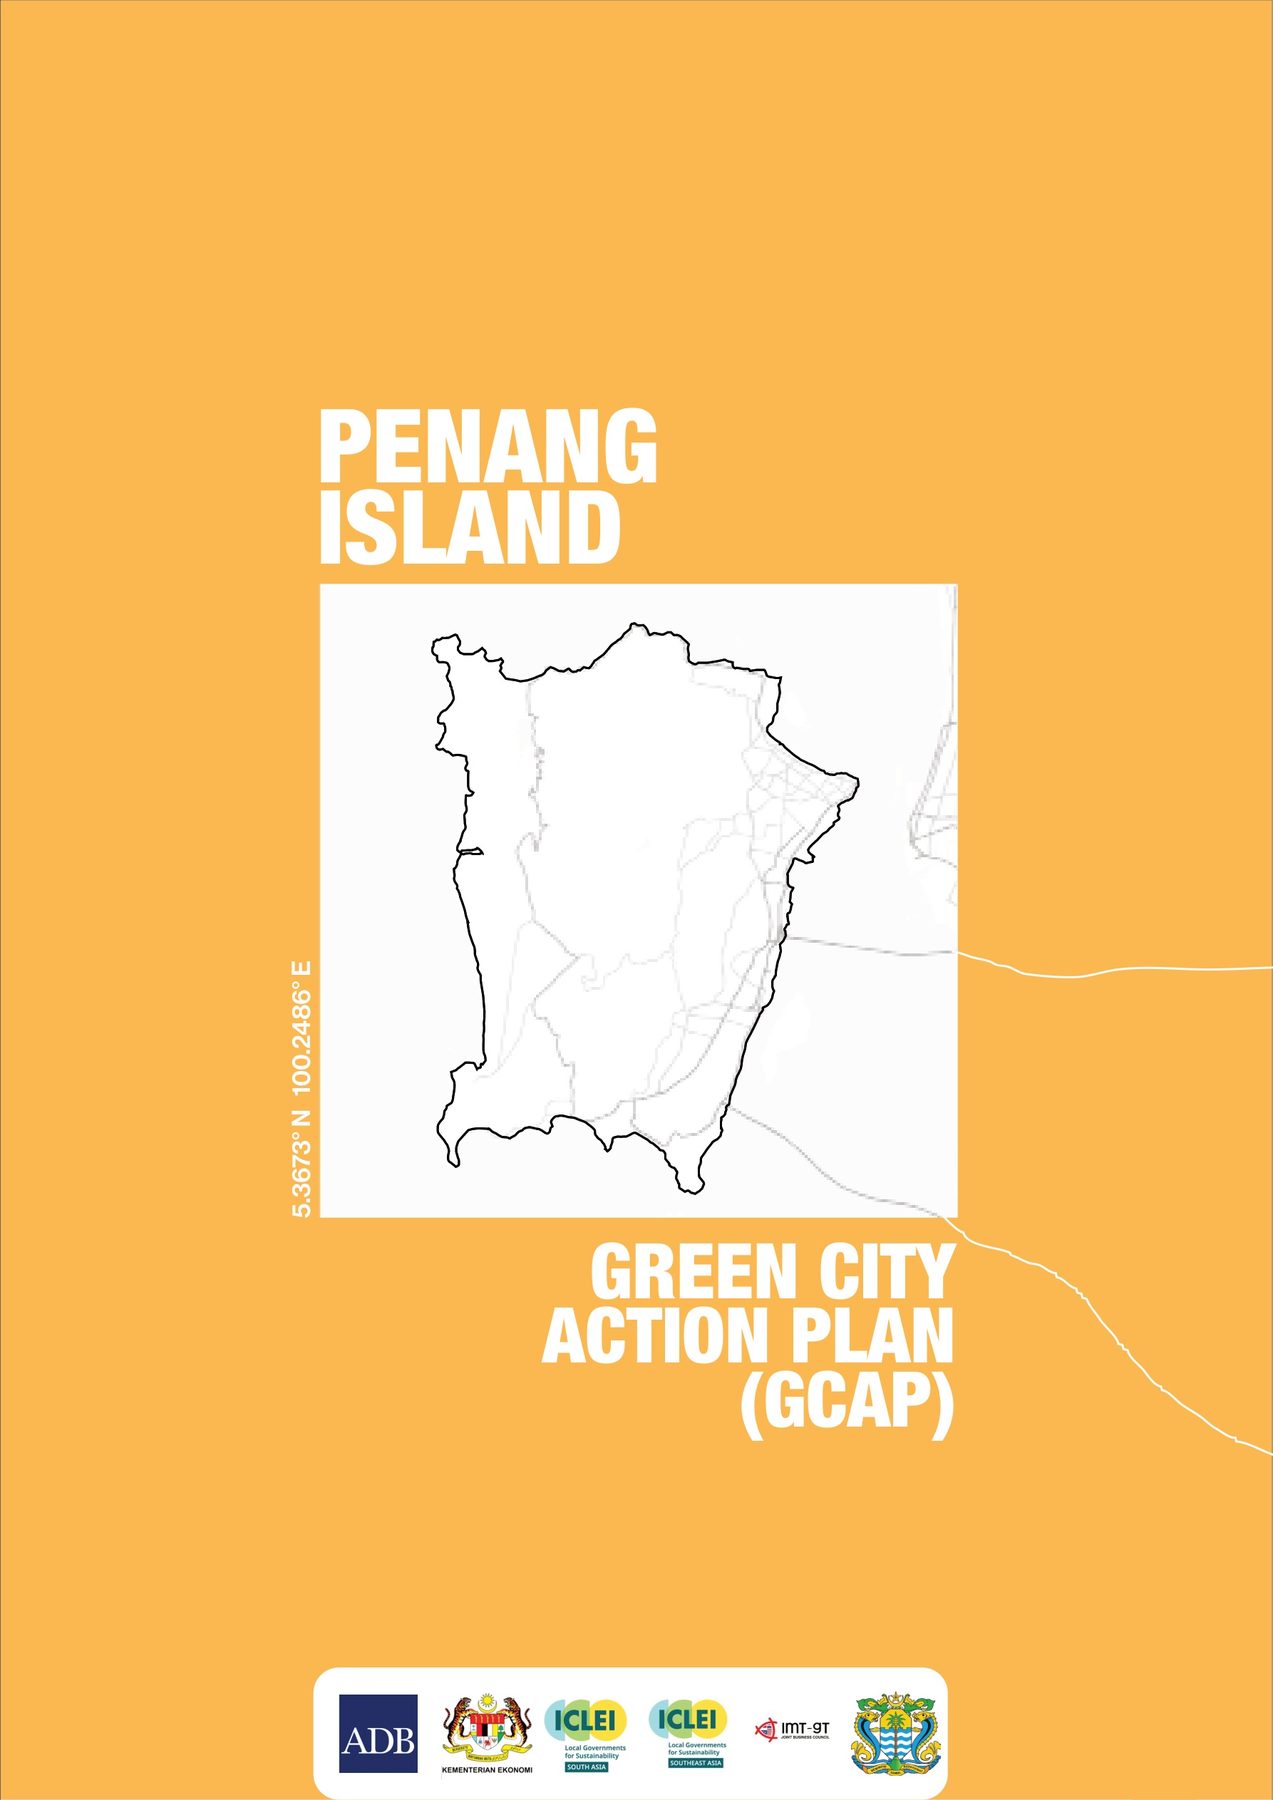
Every plan opens with a map made from the city's own data, boundaries and roads from the council and PLANMalaysia, population from the census, so the first thing a reader sees is a place they recognise, drawn consistently. Four cities that could not be more different in shape: Kota Bharu, a river town of 411,000 on the east coast; Langkawi, an island of 97,000 that lives on tourism; Padawan, a municipal council of 267,000 spread over 884 square kilometres of Sarawak villages; Penang Island, 811,000 people on 307 square kilometres with George Town at its heart.
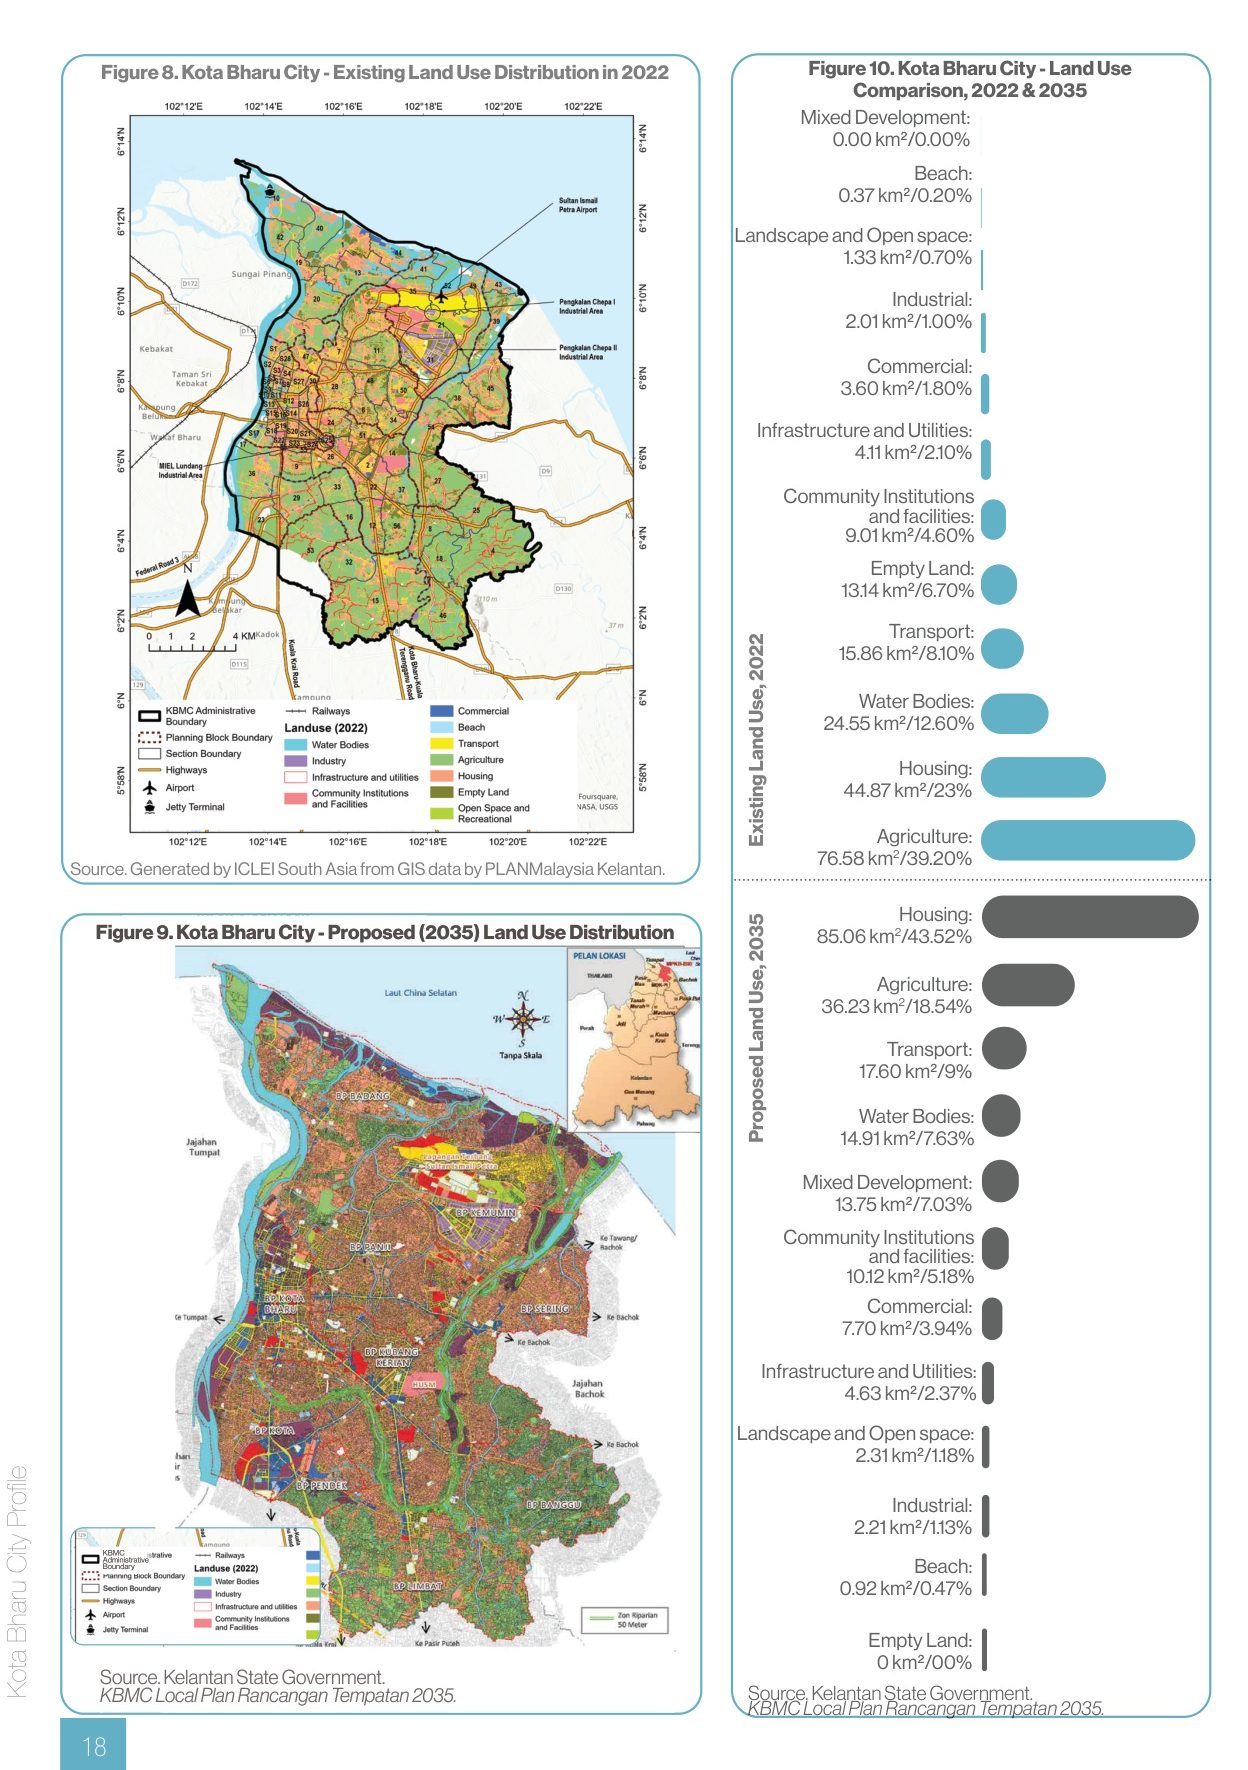
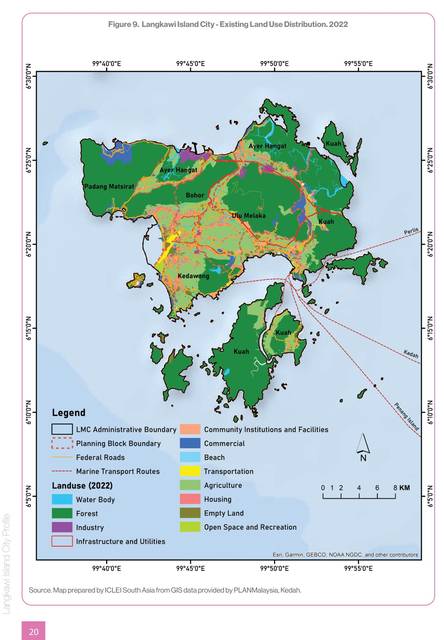
The land-use maps share a legend and say four different things. Kota Bharu is trading fields for commerce along the Kelantan. Langkawi is forest on its massif and hotels on its southern shore. Padawan is still mostly forest, with the built-up strip creeping along the Kuching–Serian road between 2017 and 2022. Penang is 45 per cent forest on the hill and dense on the plain around it. What a city can do about carbon and heat starts with what its ground is for.
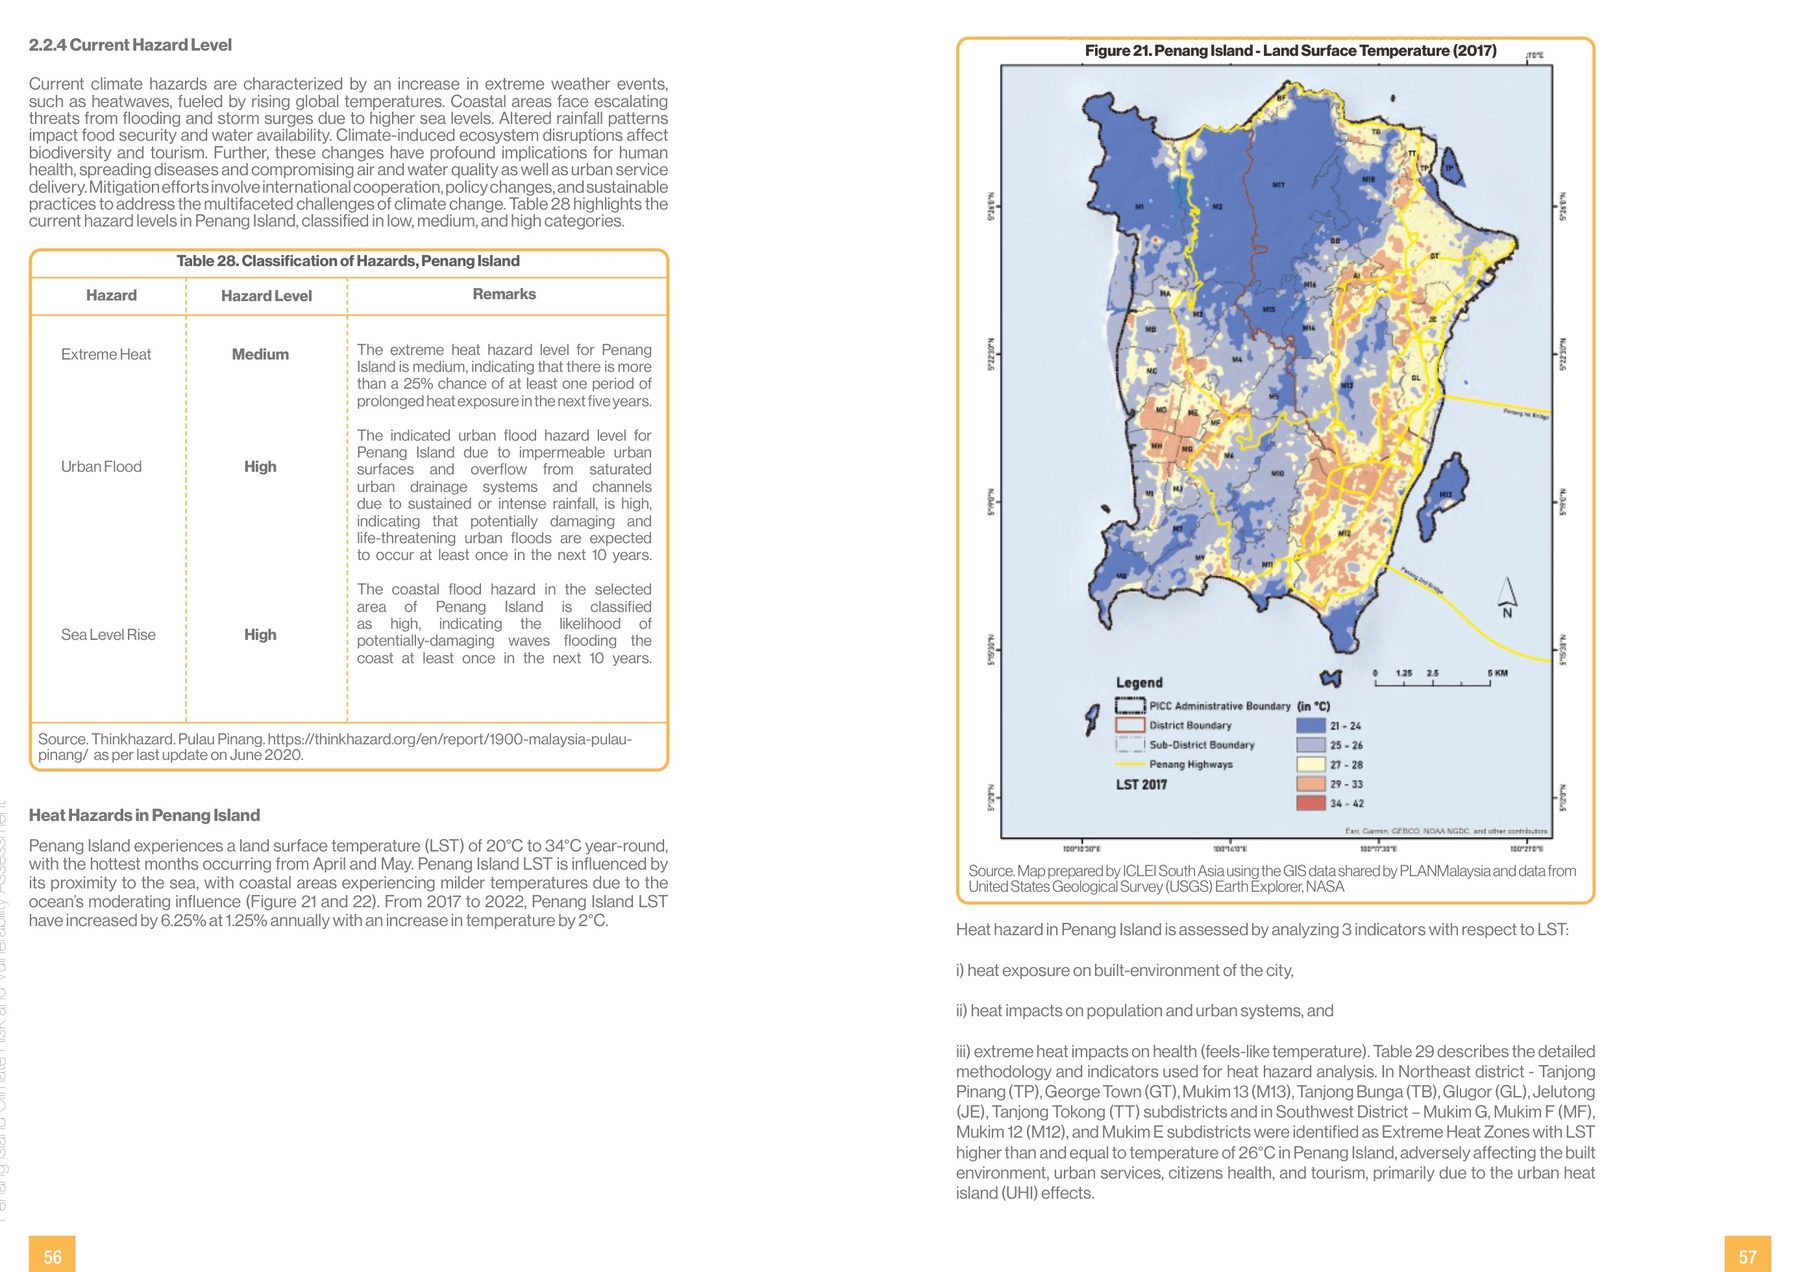
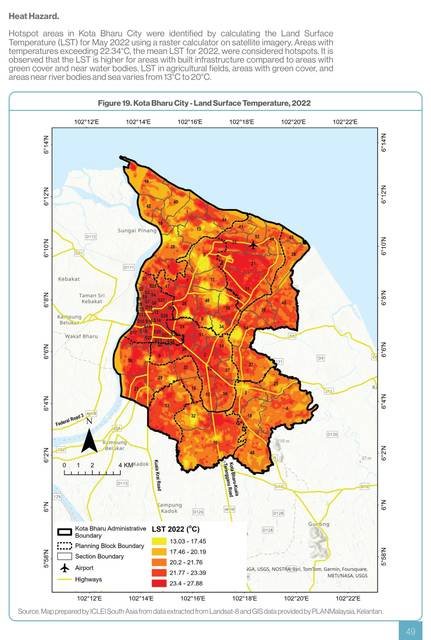
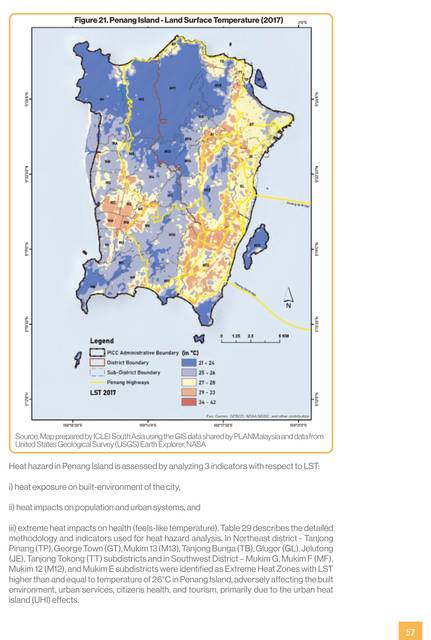
Then the heat. Land surface temperature from Landsat, on the same scale for each city, and the pattern repeats: the built plain heats; the forest and the water hold. Kota Bharu's whole plain runs hot; Langkawi's Kuah and airport plain against its massif; Padawan's Kuching-side wards against its hills; Penang's George Town and Bayan Lepas at 34 °C against the hill at its centre. At 76 per cent humidity Penang's 37 °C feels like 55, and the mean maximum has risen 0.9 °C since 1981.
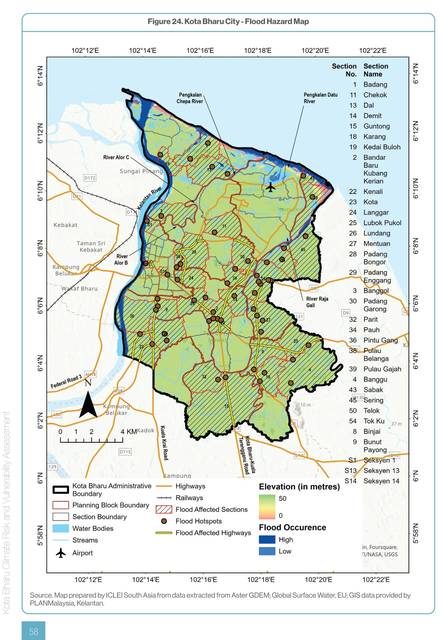
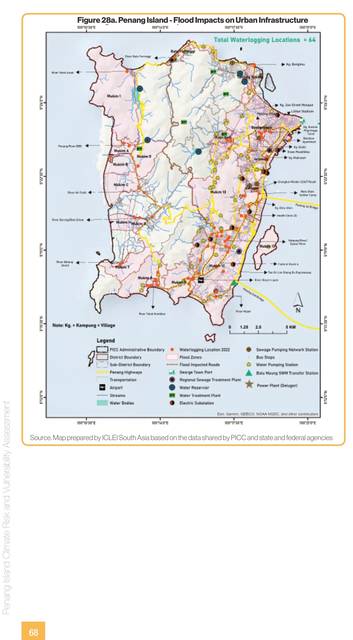
Then the water. Kota Bharu floods from the Kelantan every December monsoon. Langkawi's flood zone is 18 square kilometres, with Padang Matsirat and Ulu Melaka the hotspots. Padawan floods along the Sarawak Kiri. Penang counts 64 waterlogging locations in the north-east district's low ground. Each map puts the roads, substations, schools and clinics on the hazard, and the exposure maps are where the investment list starts.
Energy, waste, water, wastewater, sixteen times
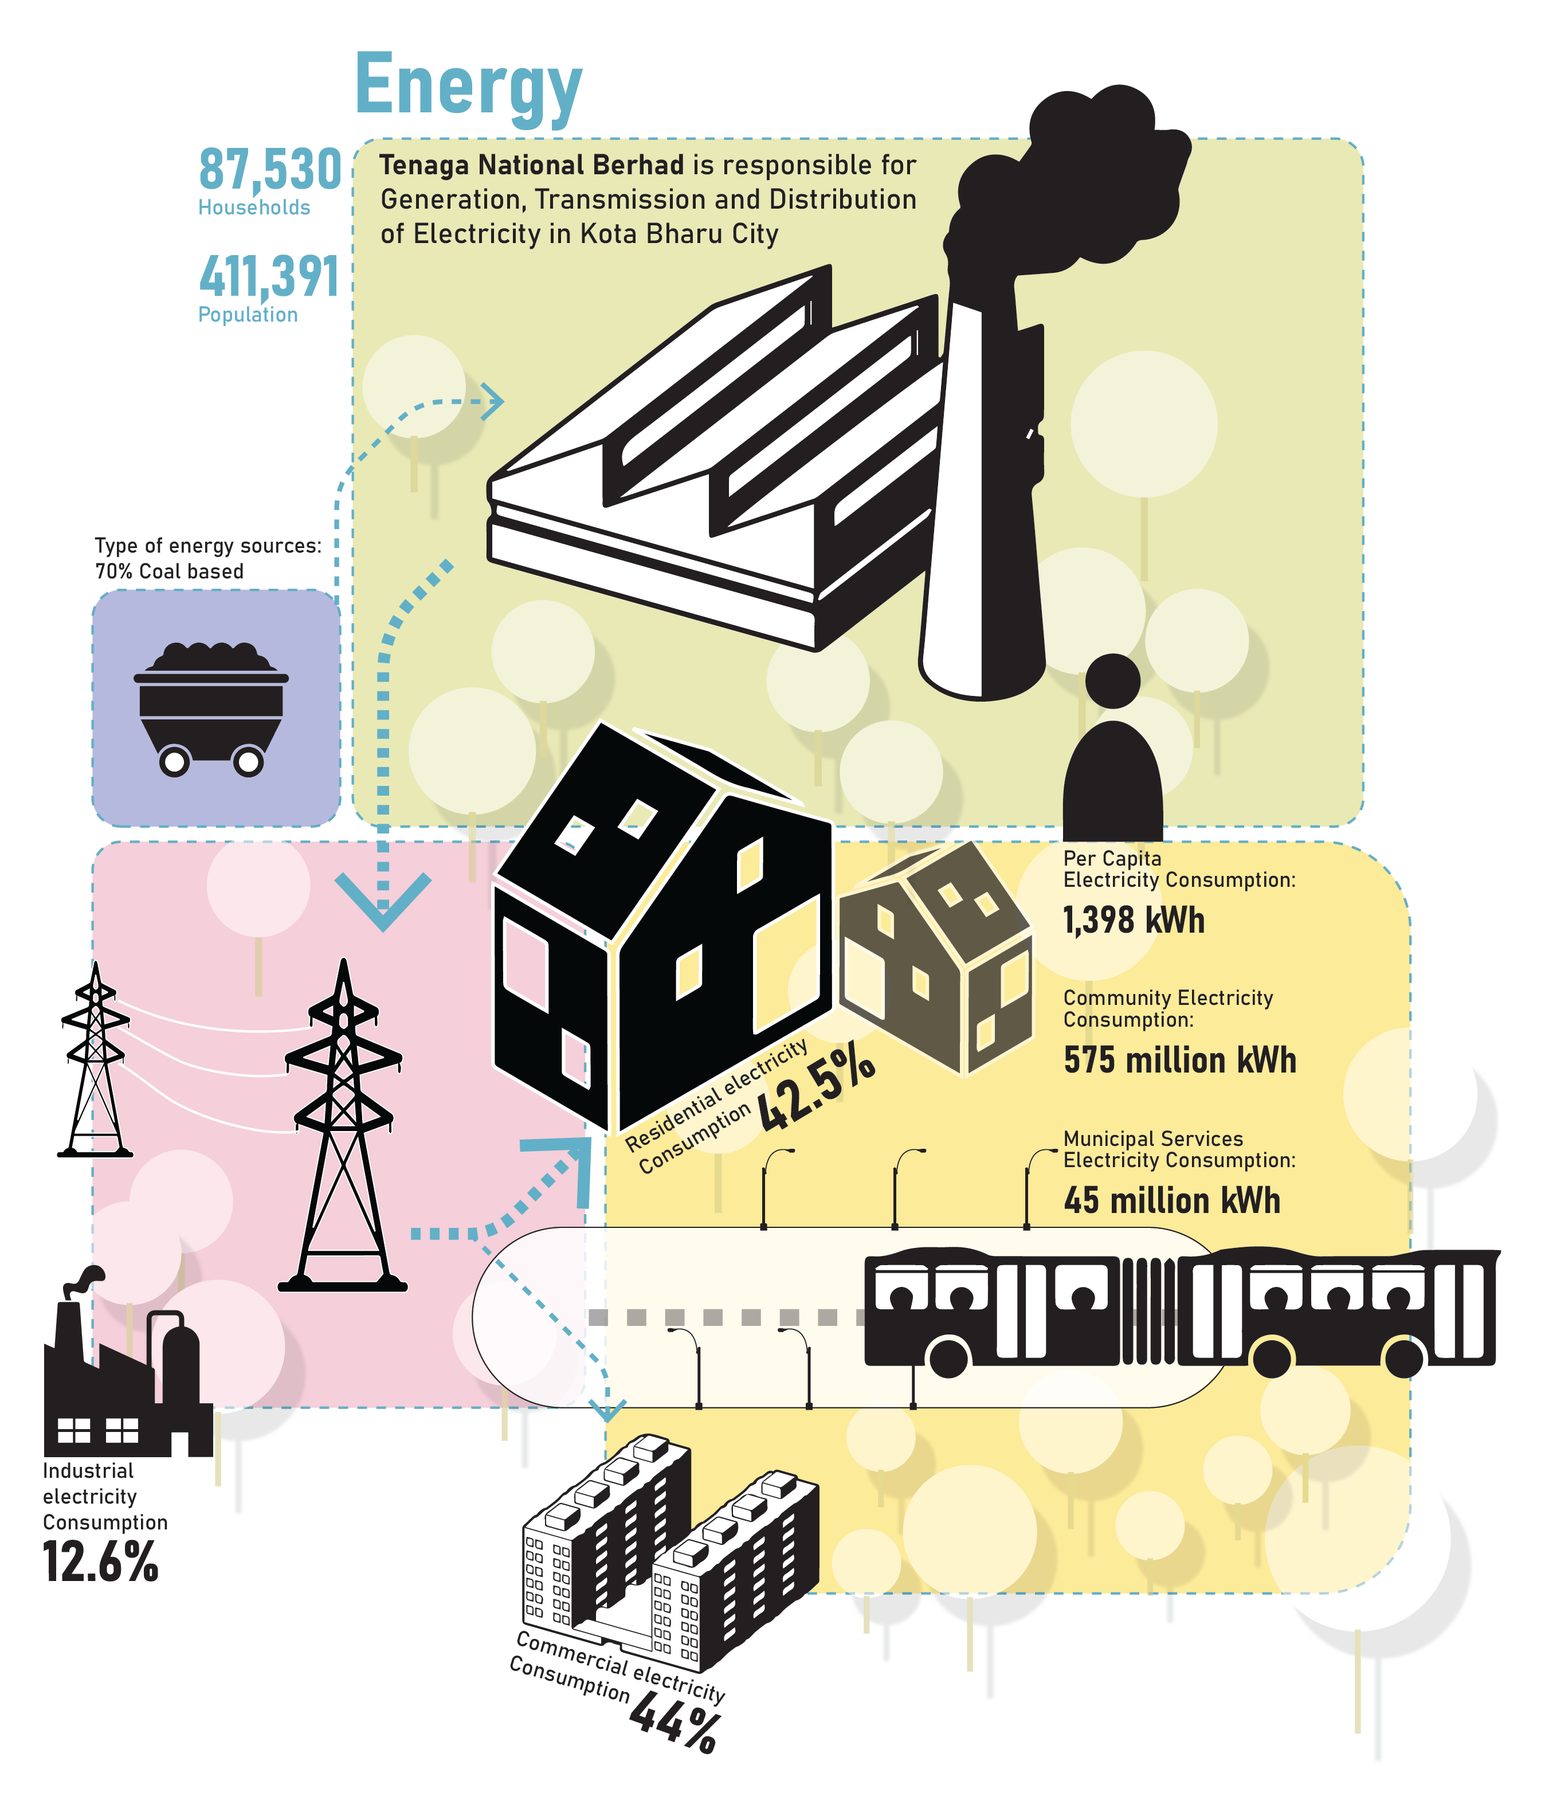
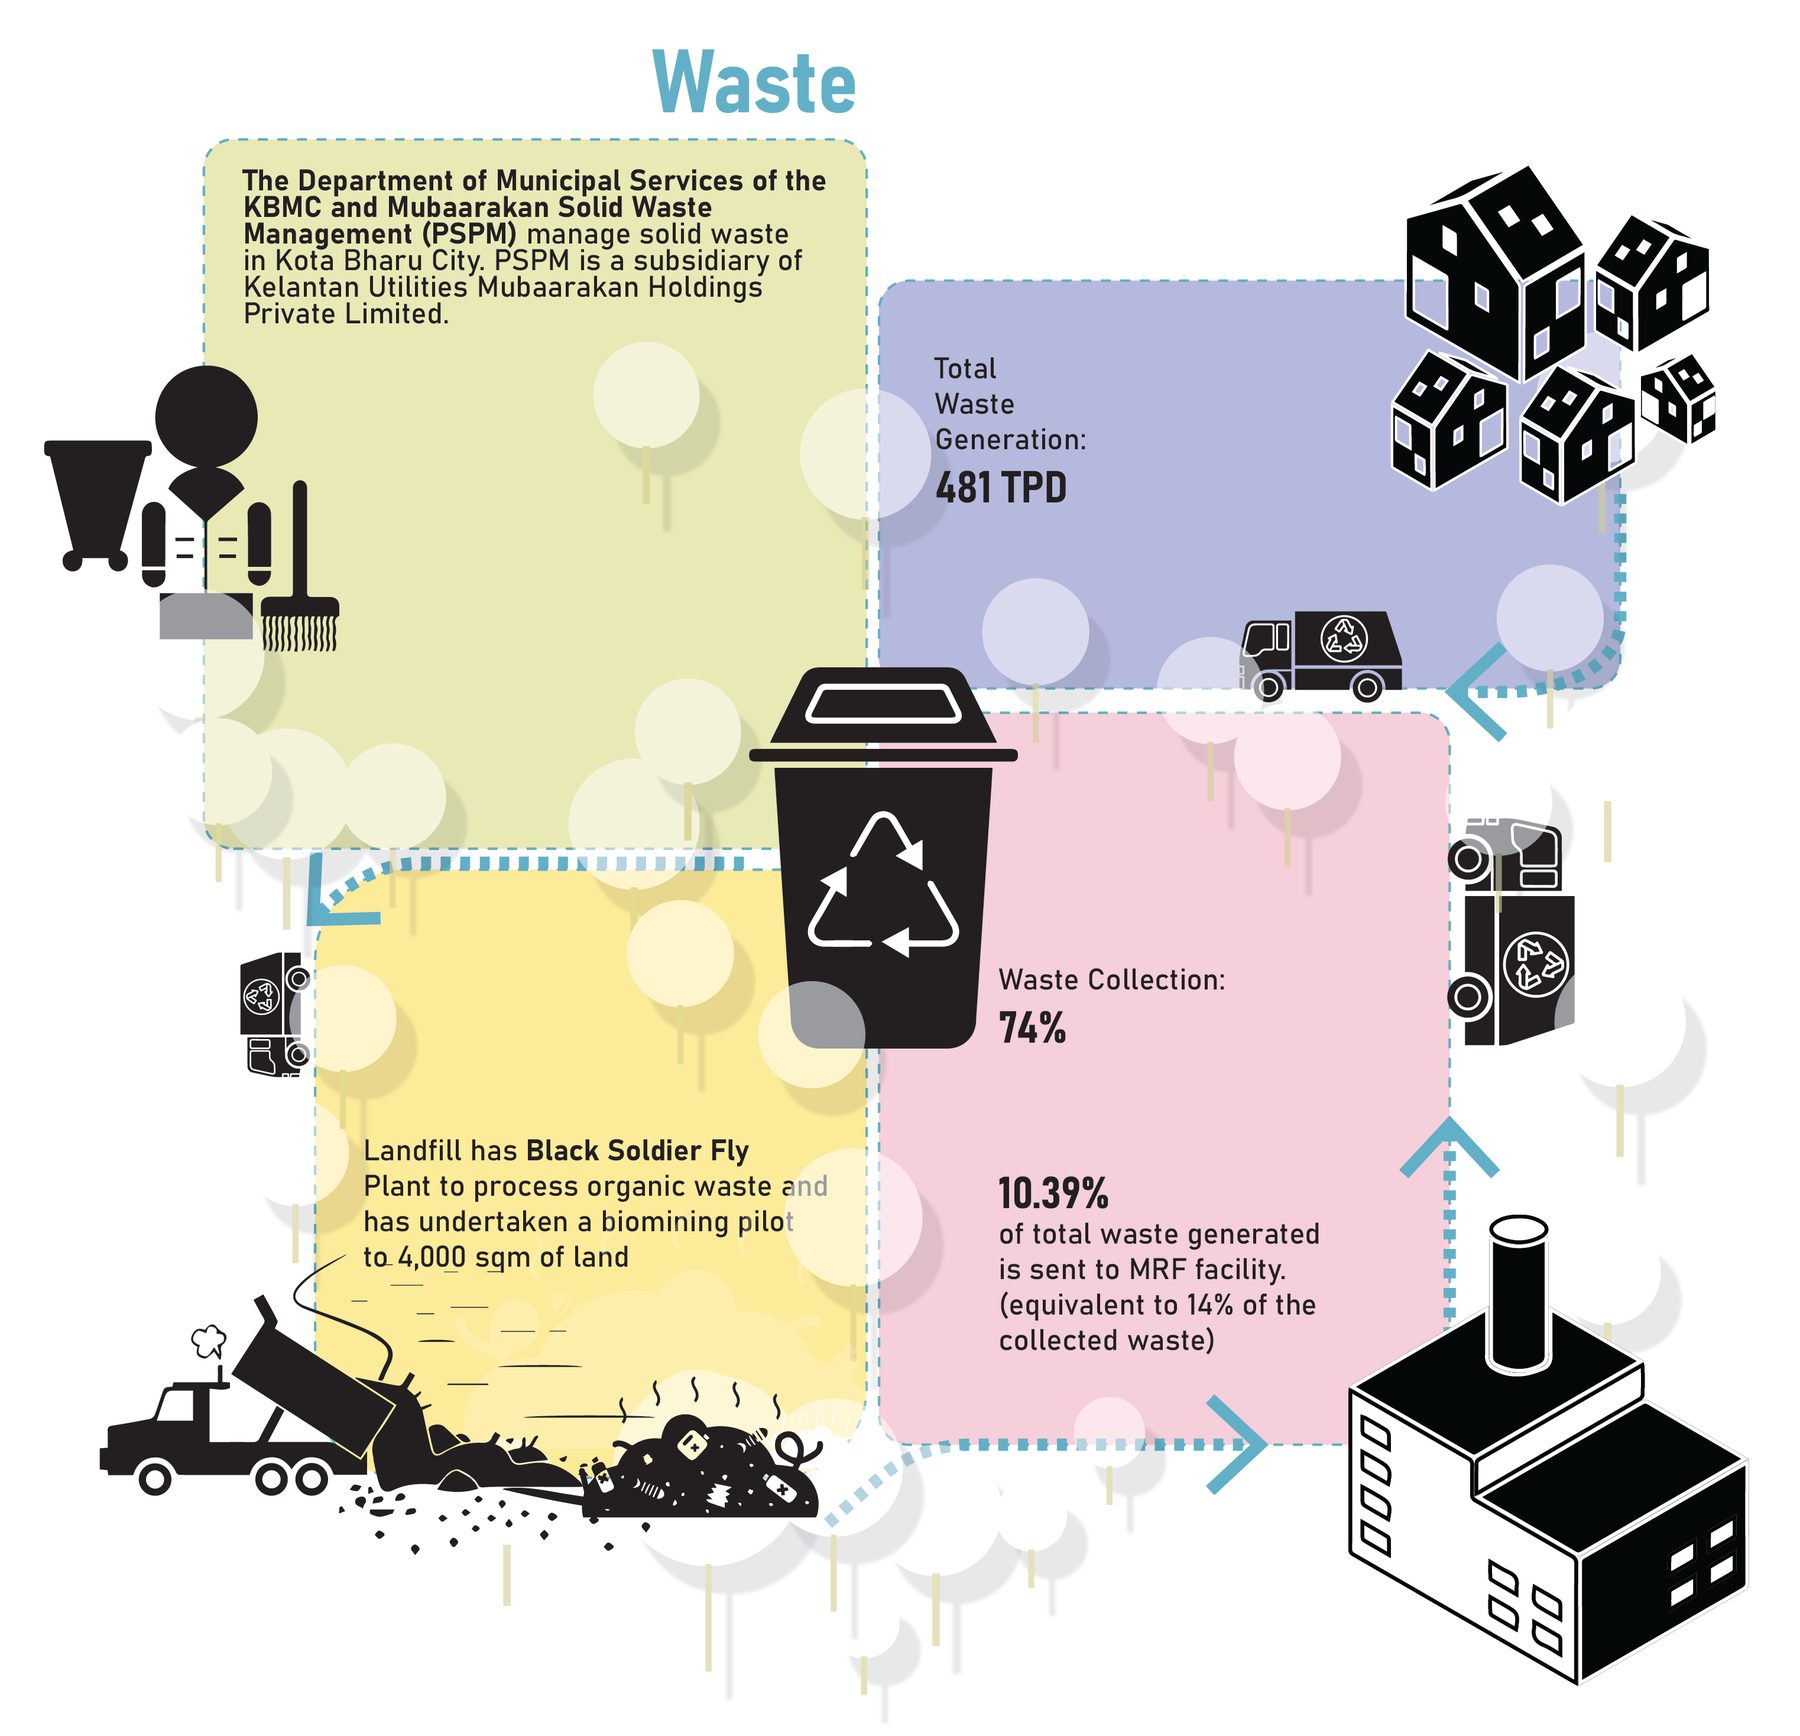
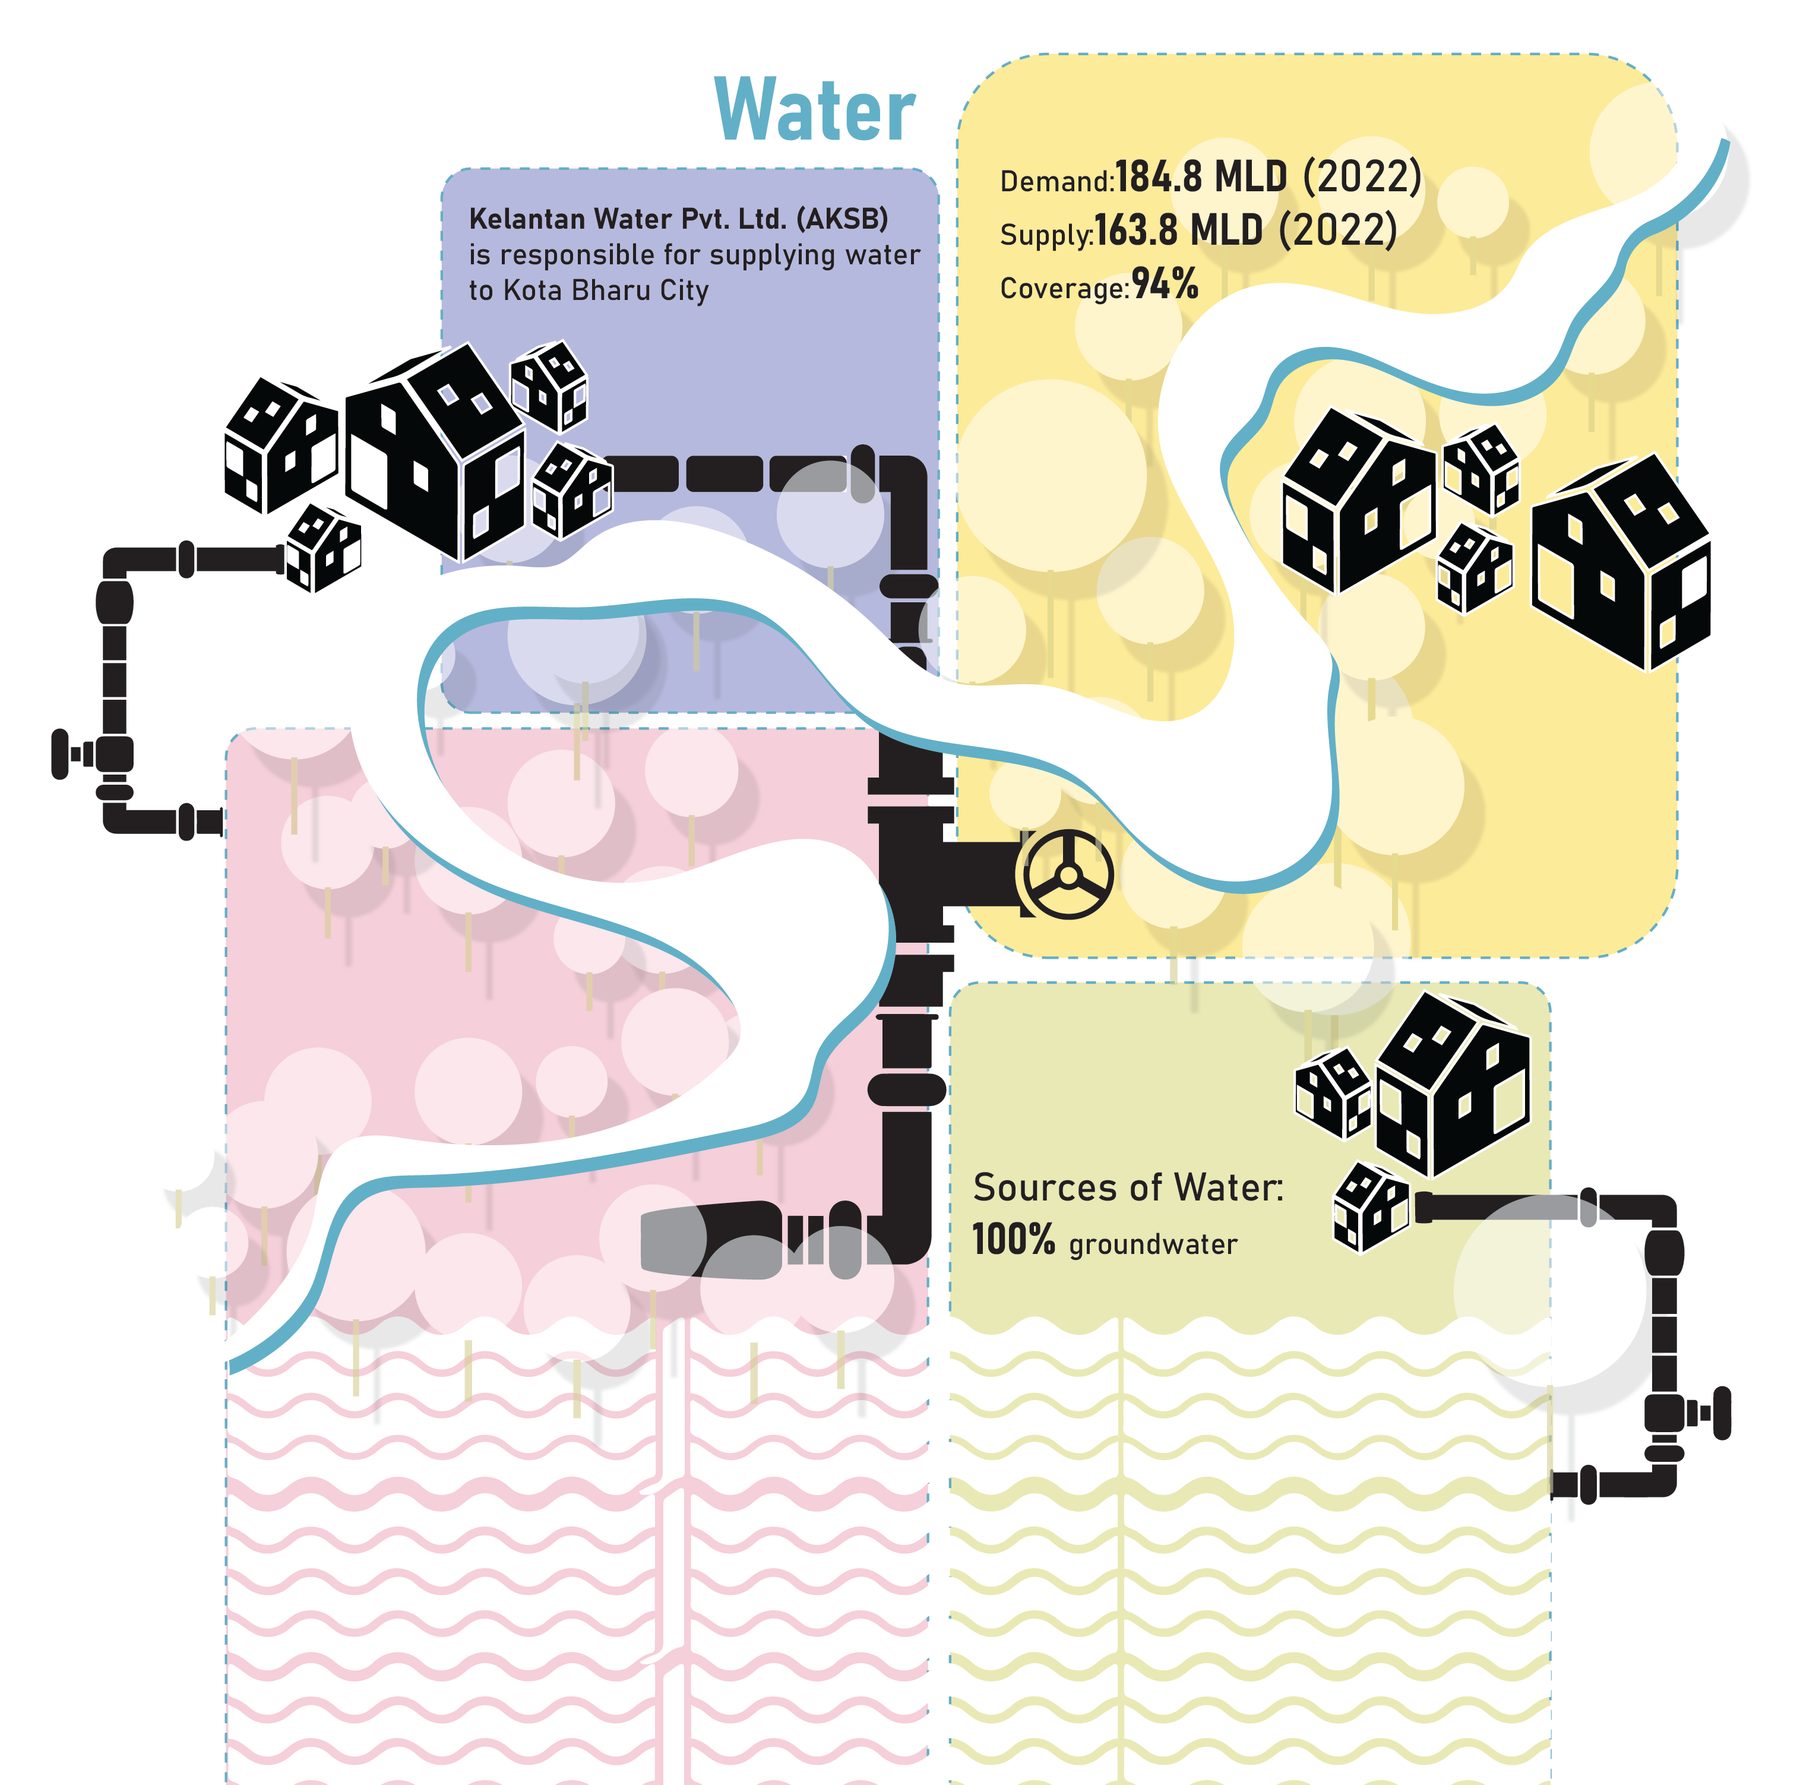
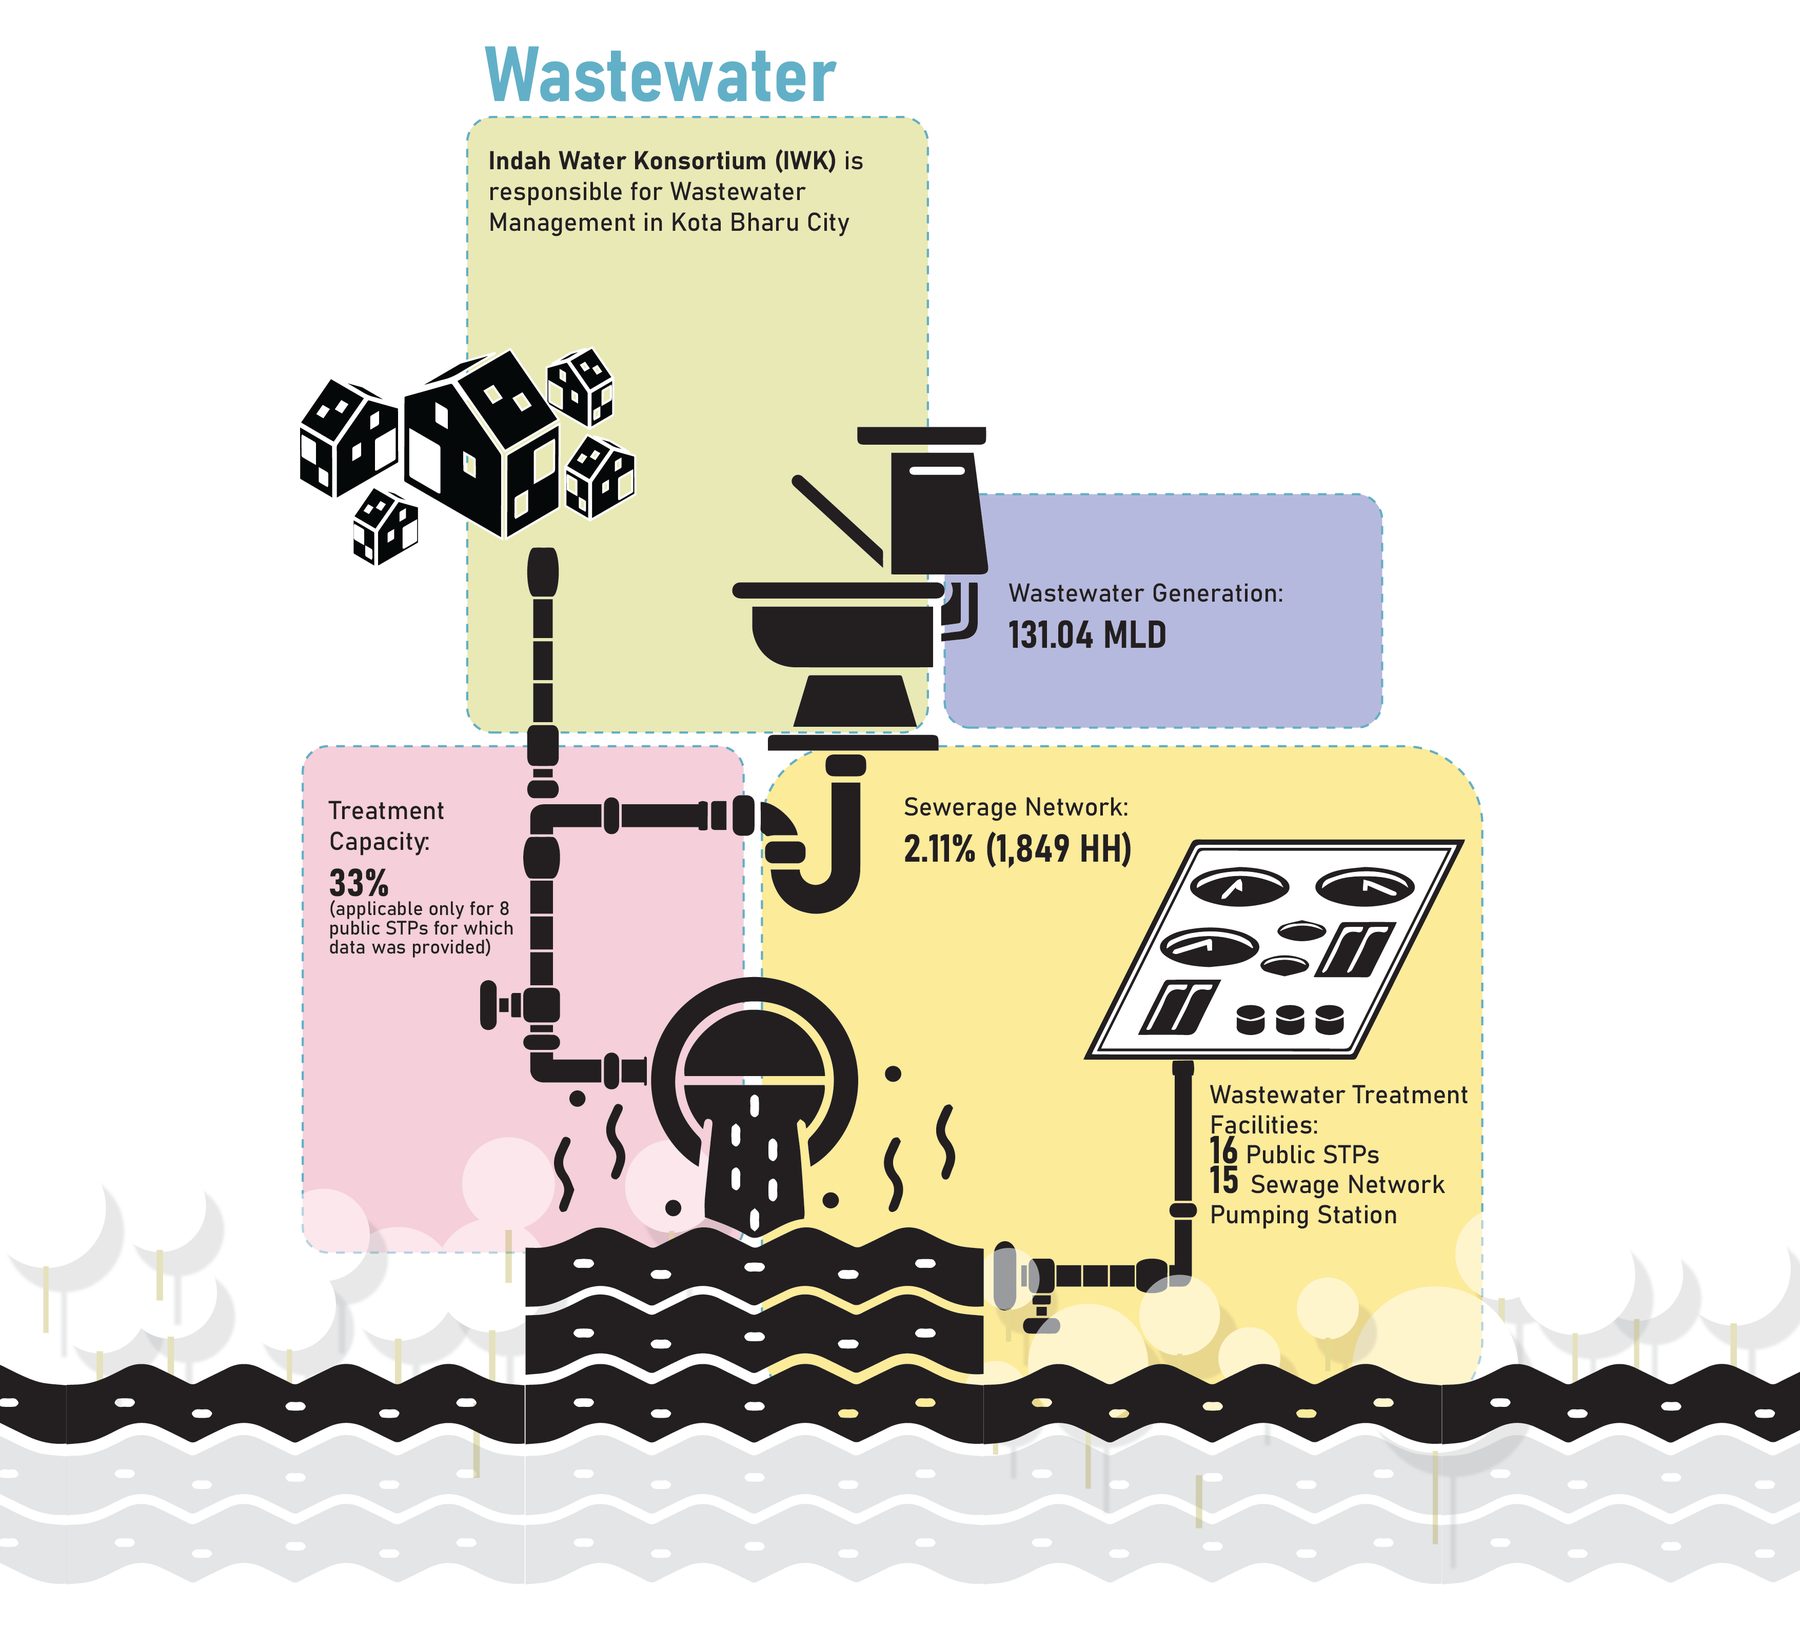
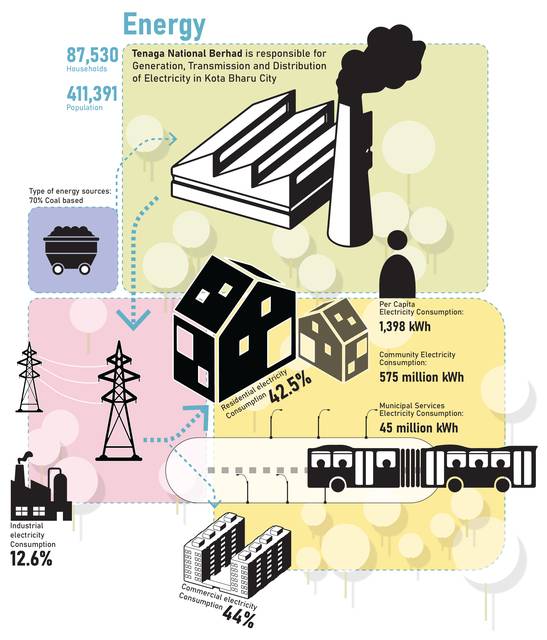
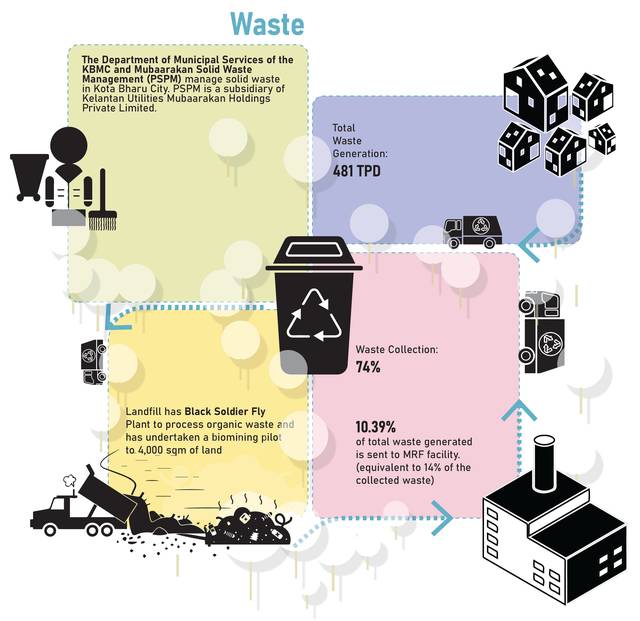
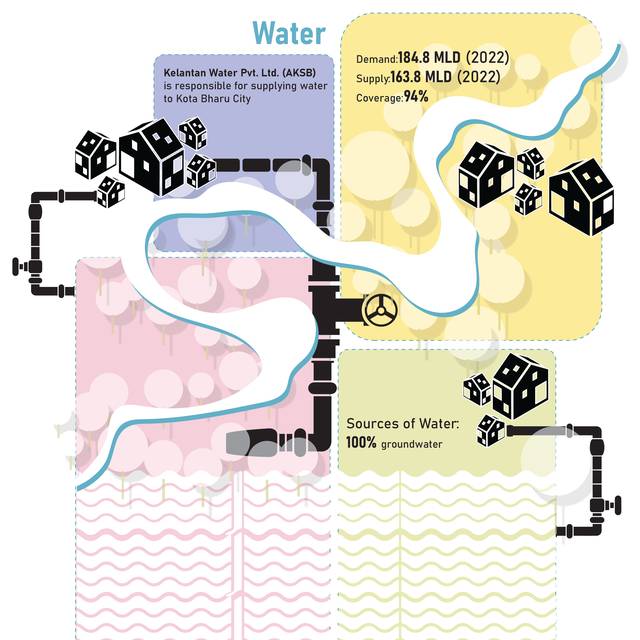
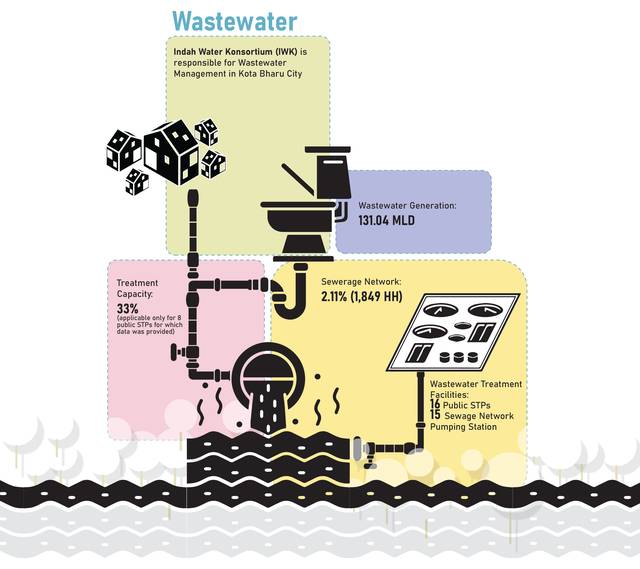
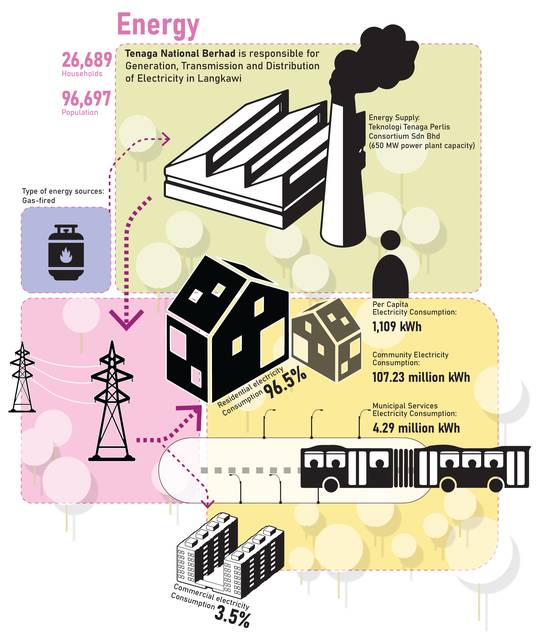
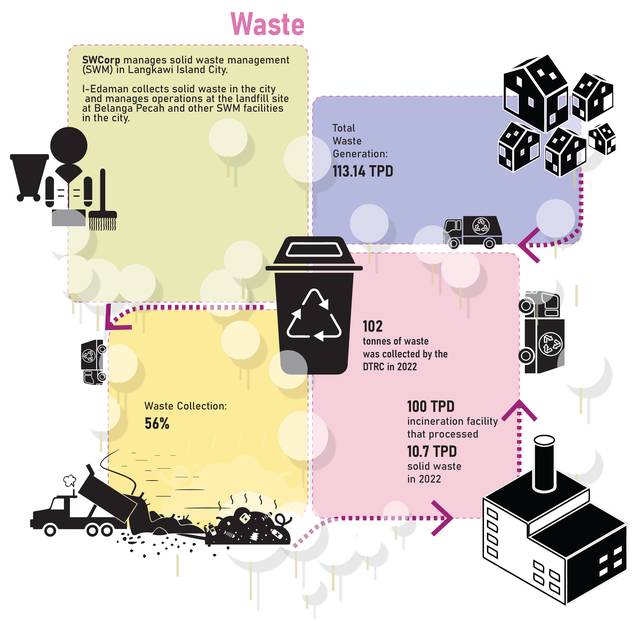
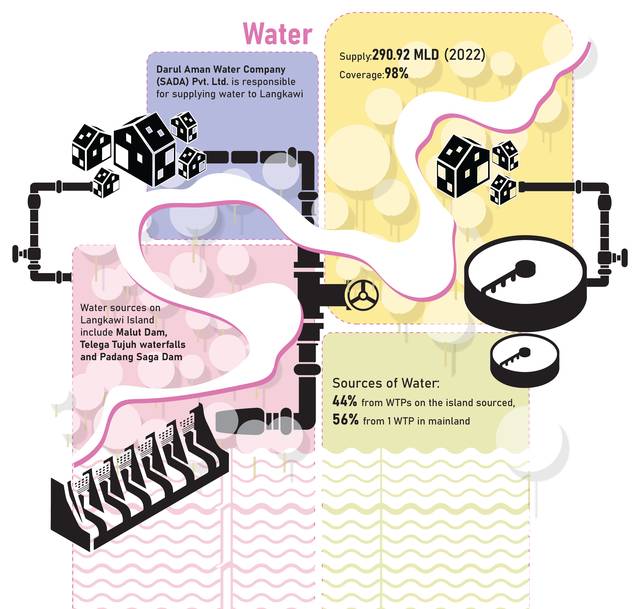
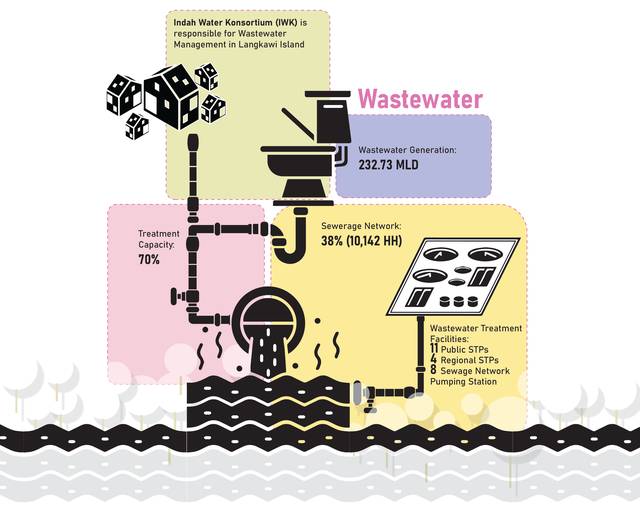
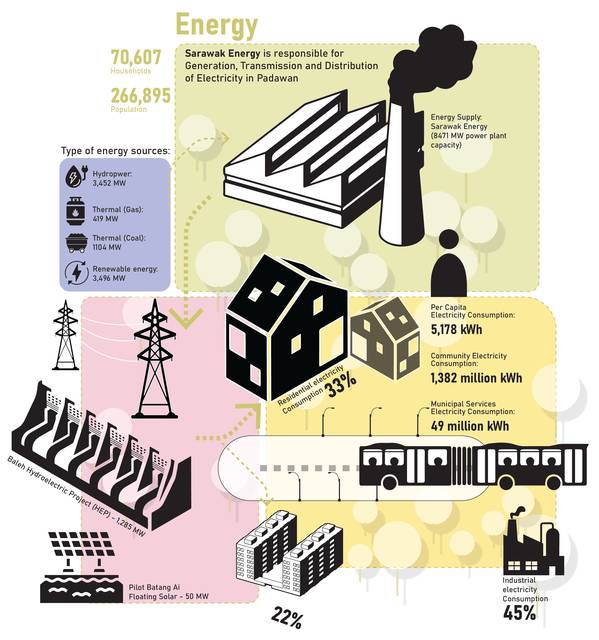
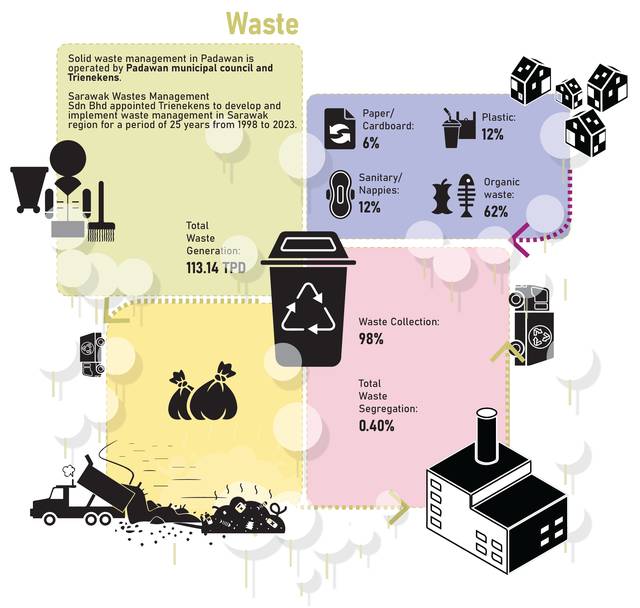
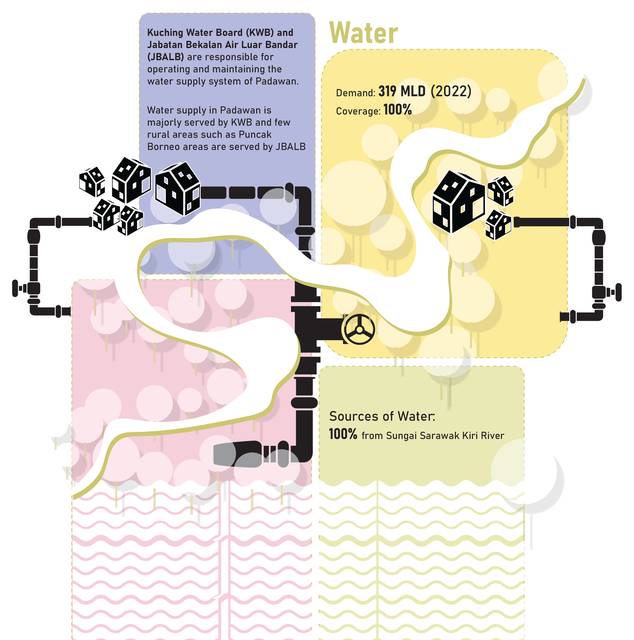
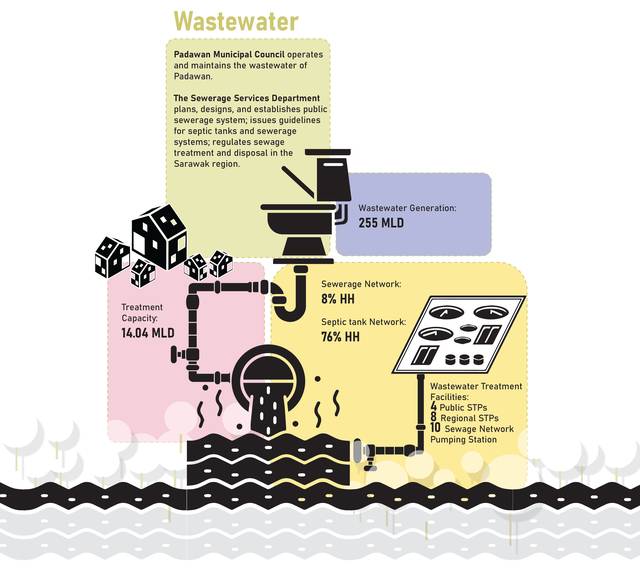
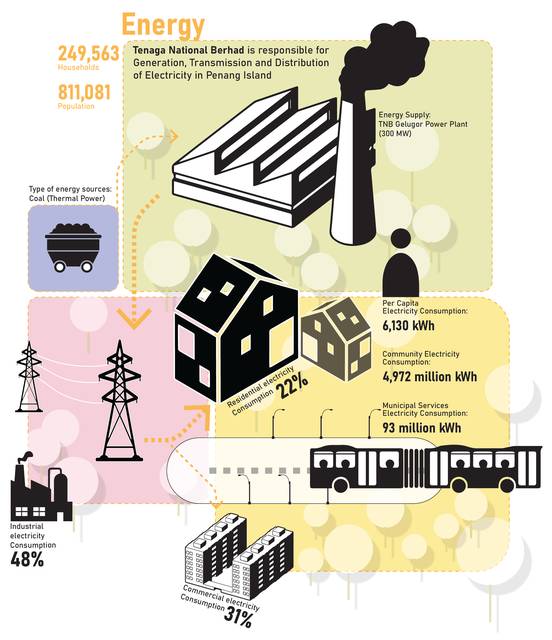
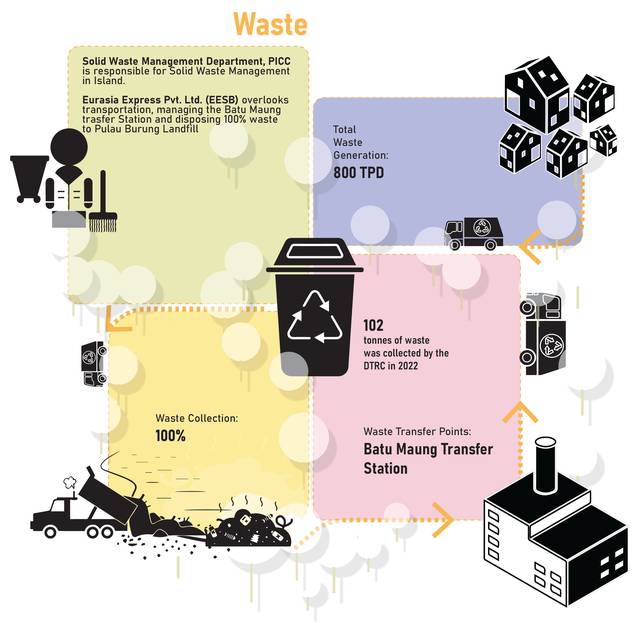
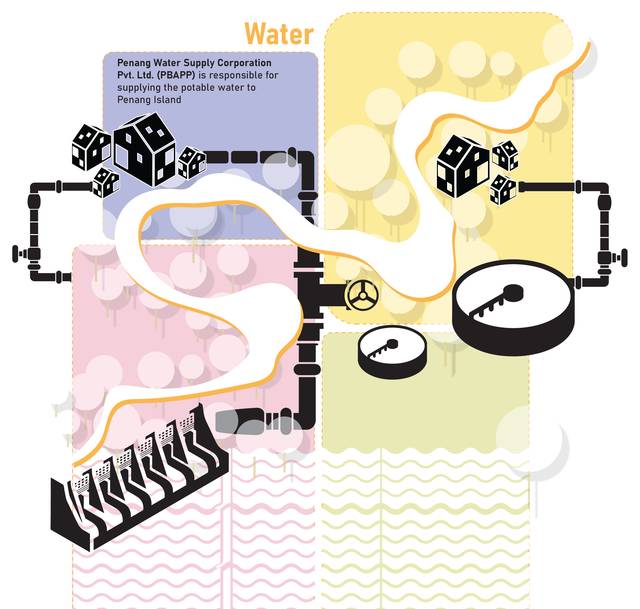
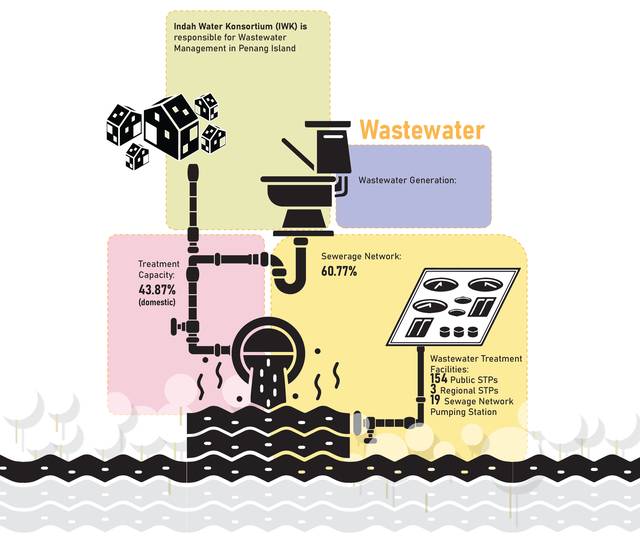
Before the risk and the carbon, the services. For each city, four diagrams (energy, waste, water, wastewater) on one drawing system: the agency responsible, the source, the supply and the demand, and the number that tells you where the city stands. Kota Bharu is 70 per cent coal-fed and 2 per cent sewered. Langkawi pipes more than half its water from the mainland. Padawan runs on Sarawak's hydropower, uses five times the electricity per person that Kota Bharu does, and has 76 per cent of its households on septic tanks. Penang collects all of its 800 tonnes of waste a day and sends it across the bridge to a landfill.
Sixteen drawings, one legend. Read a sector at a time, four cities across, they are the comparison the secretariat asked for, before a single table.
Four ledgers on one protocol
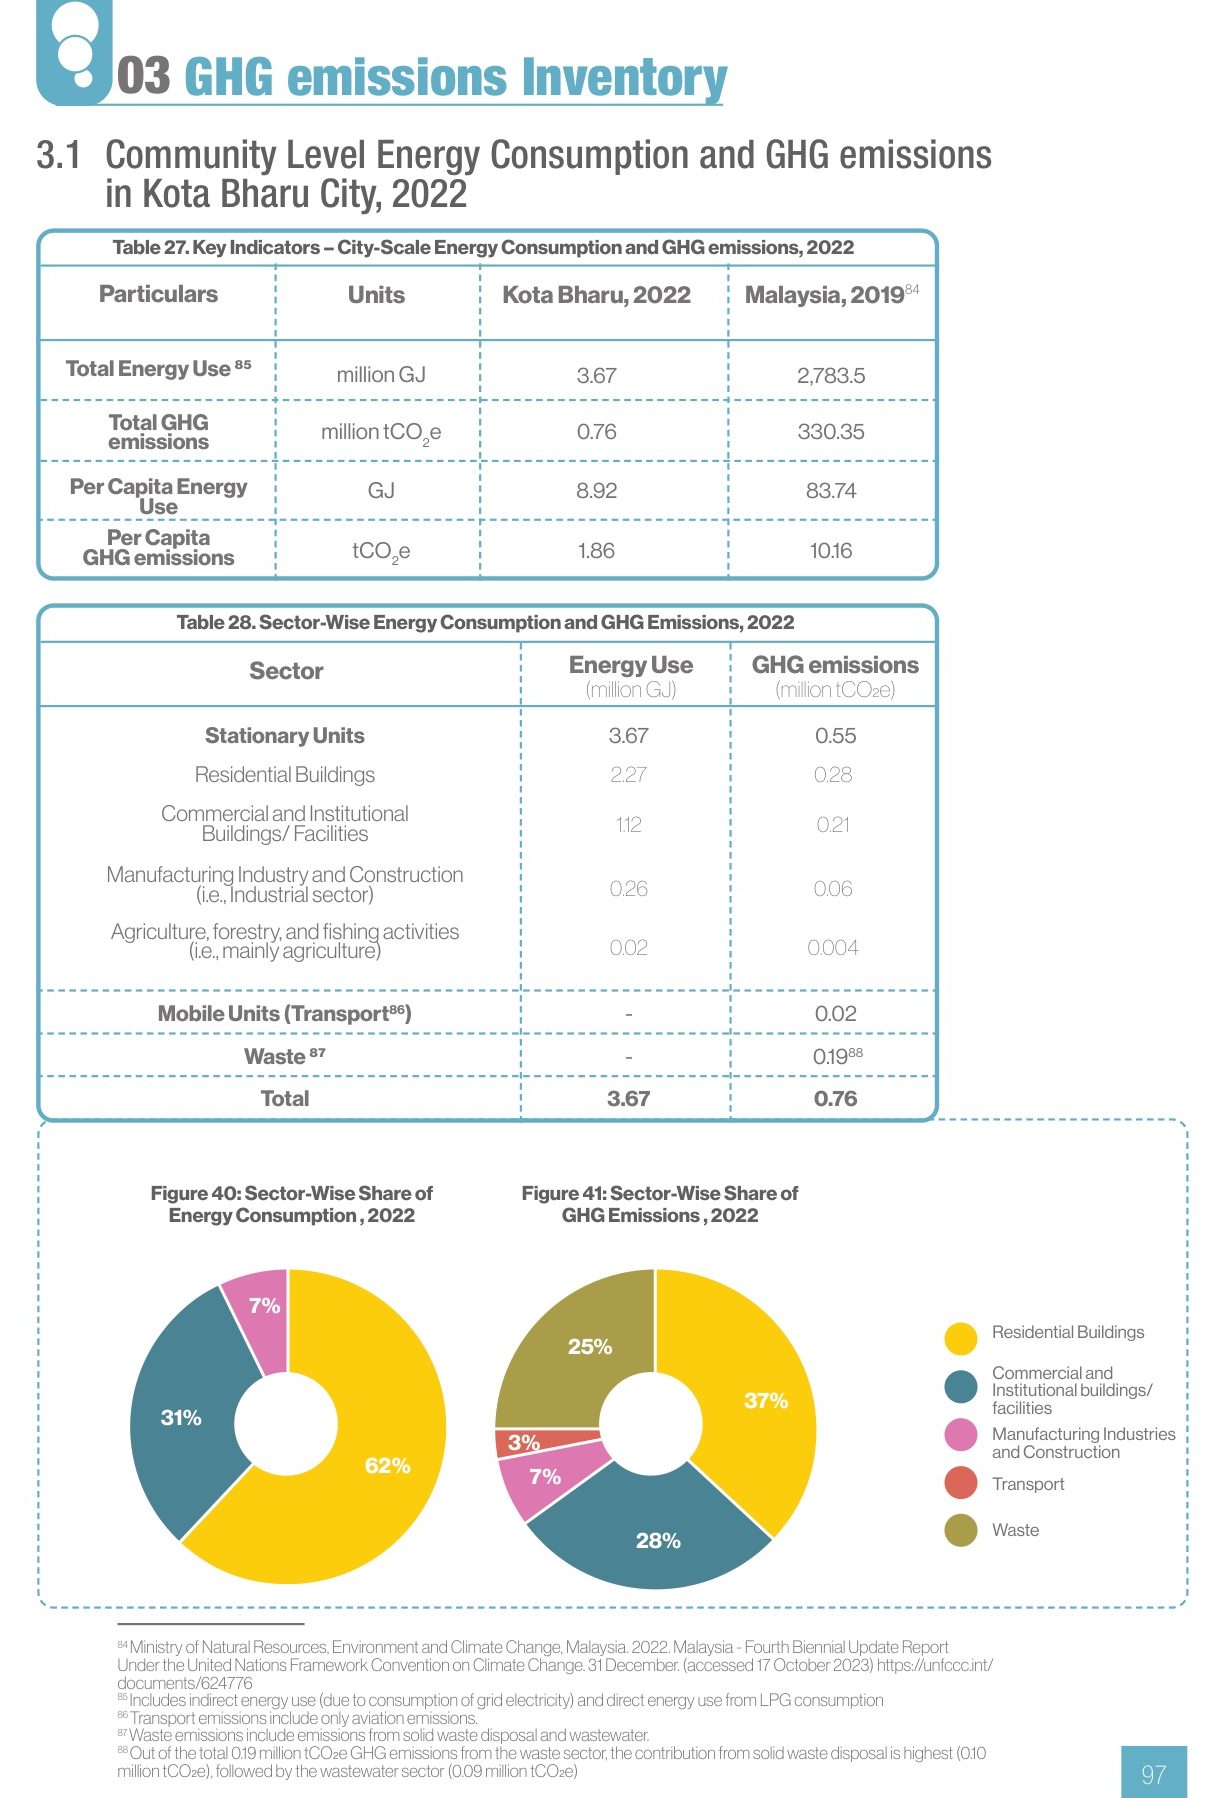
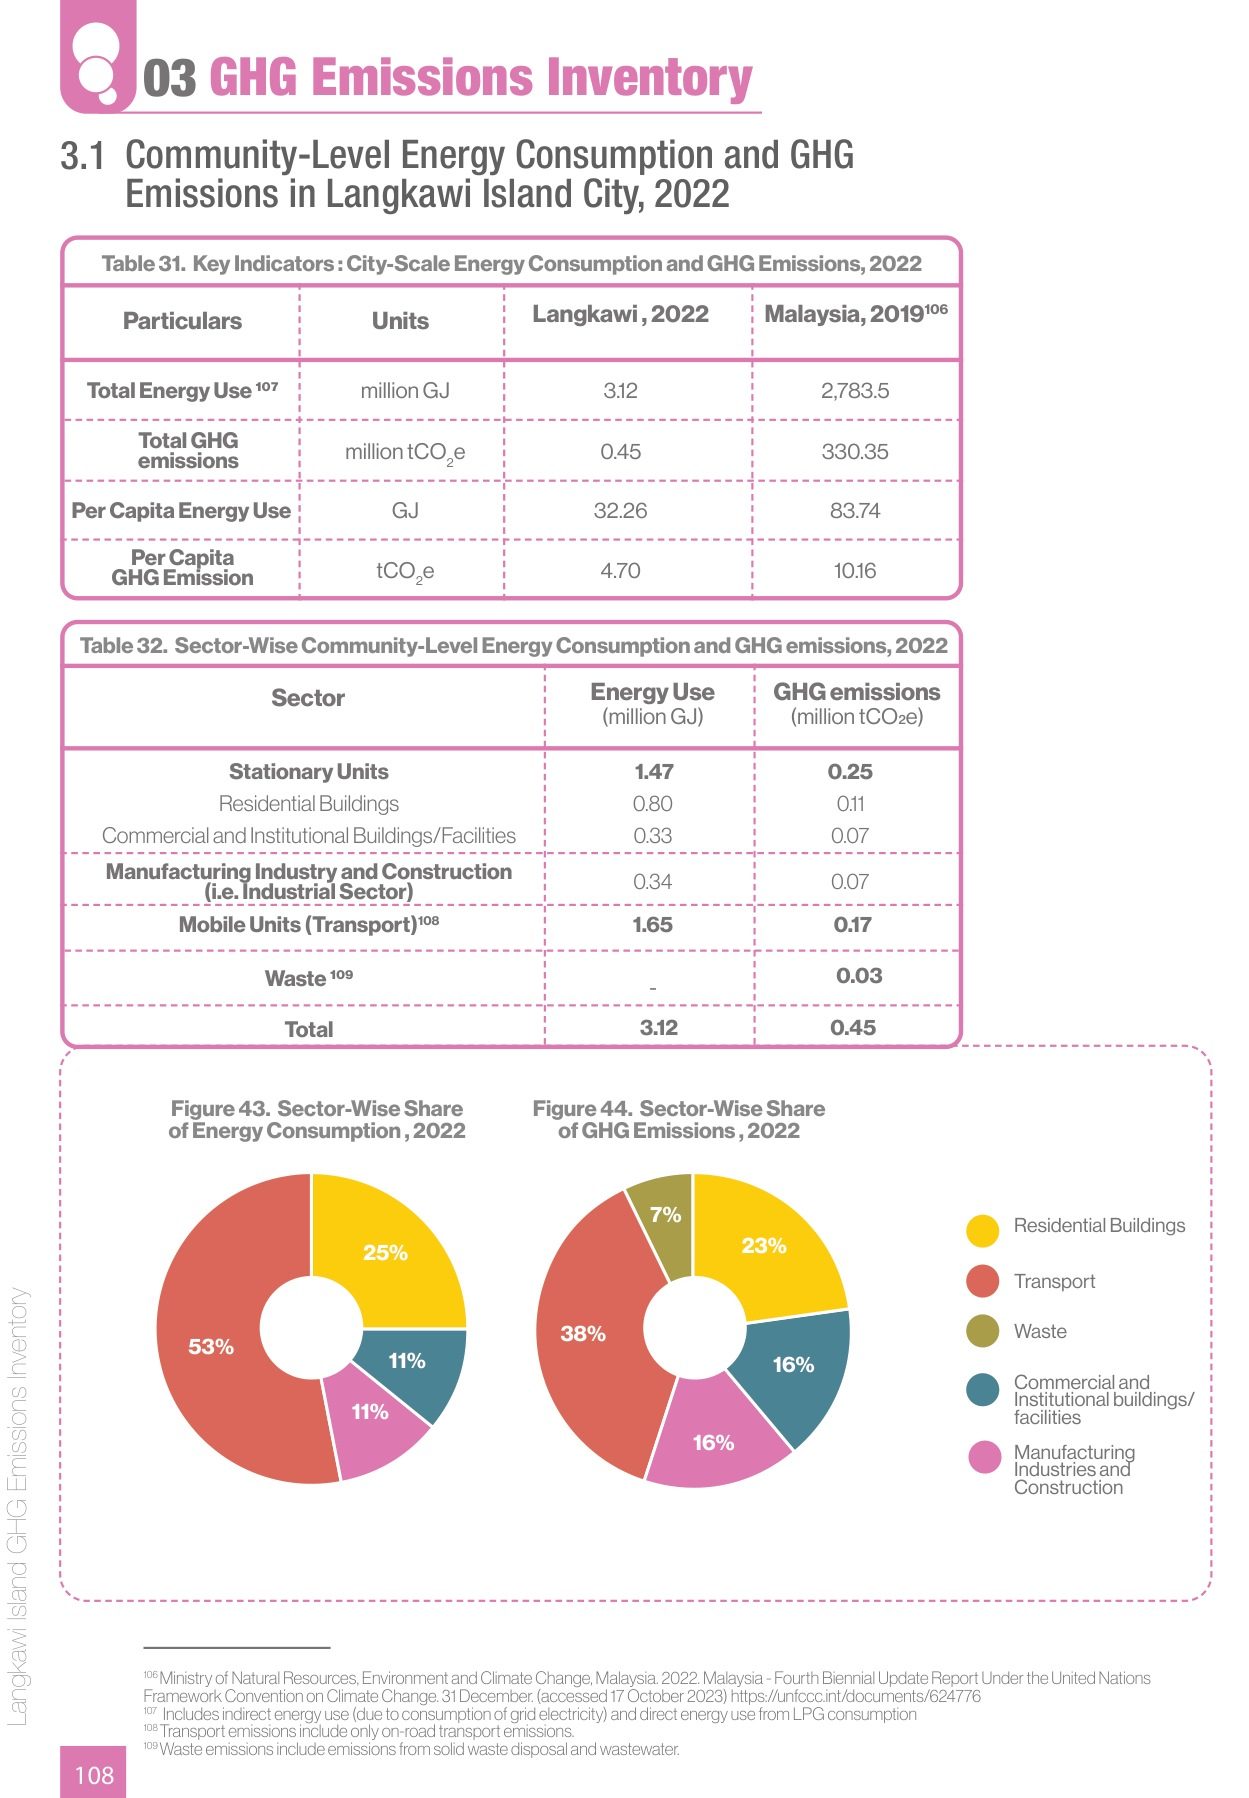
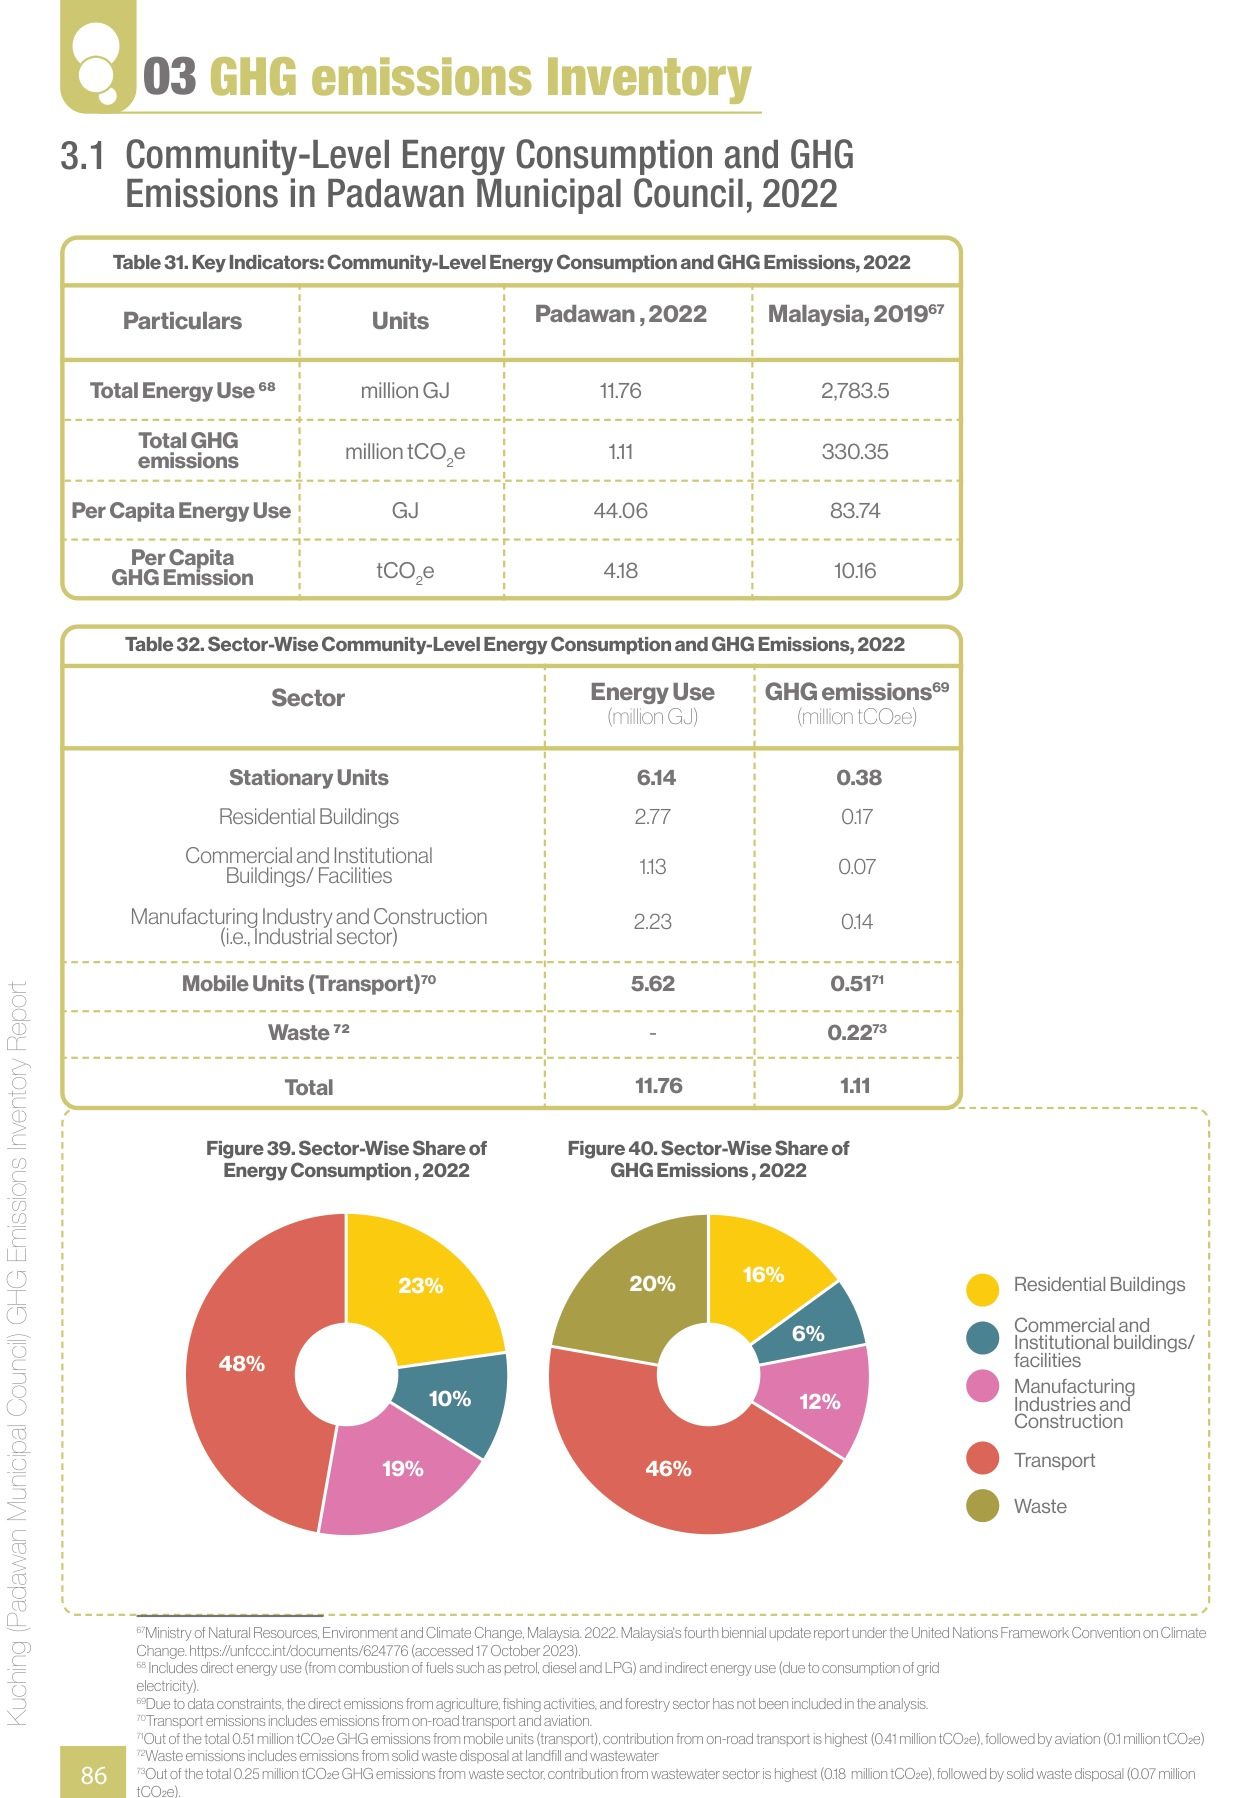
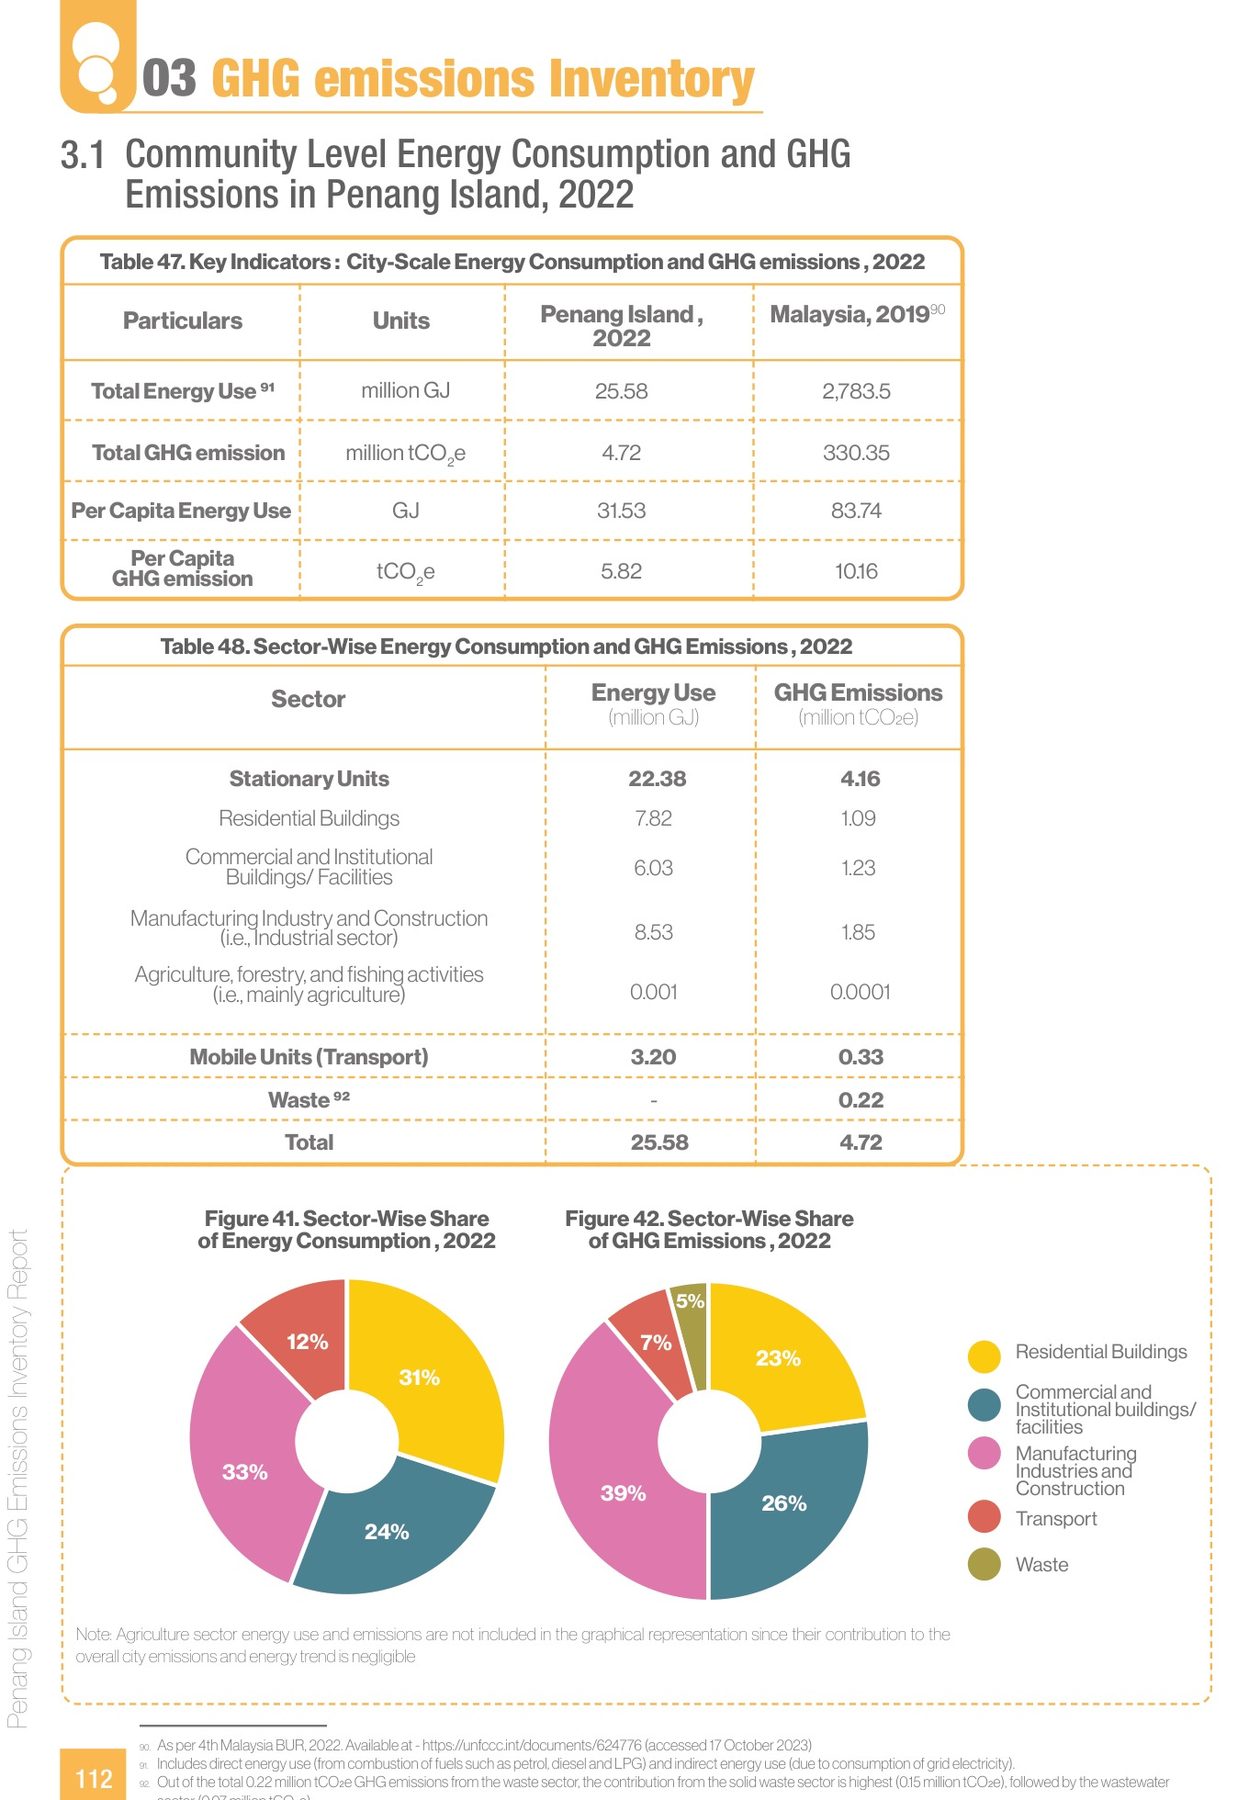
The inventory is the ledger, and the same table appears in each book: energy use by sector, emissions by sector, the per-capita line, Malaysia's 10.16 tonnes beside it. Penang Island used 25.58 million gigajoules in 2022 and emitted 4.72 million tonnes, 5.82 a person, with manufacturing first. Padawan is 1.11 million tonnes and 4.18 a person, transport nearly half and waste a fifth, its electricity light because the grid is hydro. Langkawi is 0.45 million tonnes and 4.70 a person, transport first, and its emissions grew 44 per cent in five years on tourism. Kota Bharu, with half Penang's people and no heavy industry, is 0.76 million tonnes and 1.86 a person. Four cities, 7.04 million tonnes, one protocol, and the differences between them are the plan.
Priority sectors and what to fund
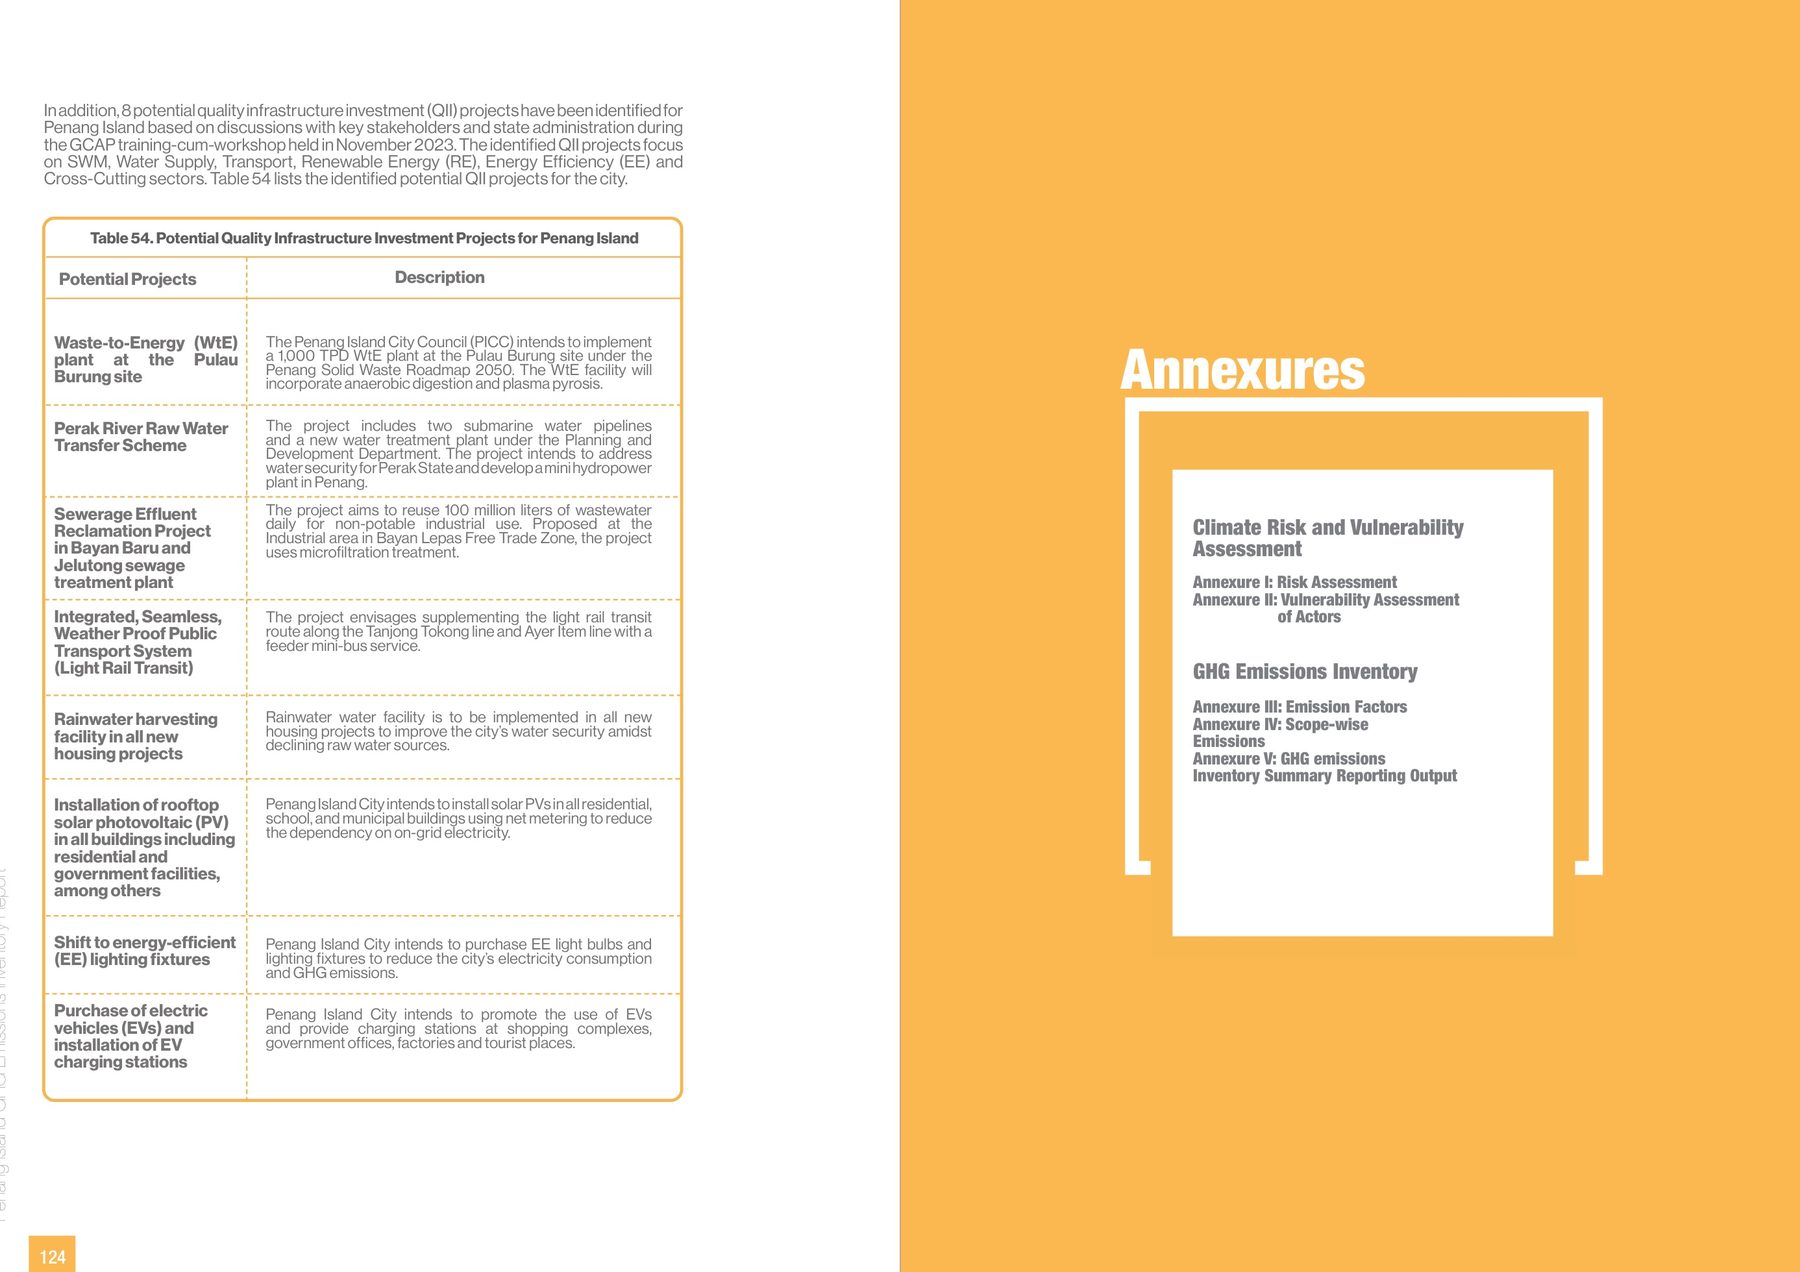
Each plan closes with the priority sectors that fall out of its profile, its risks and its inventory, and a shortlist of quality infrastructure investment projects a development bank can pick up: for Penang, waste-to-energy at Pulau Burung, a raw-water transfer from the Perak, effluent reclamation at two treatment plants, a light rail, rooftop solar on every public building, an electric fleet. The lists differ by city; the way they were arrived at does not.