can fifteen cities be read on one instrument, and what does the instrument miss?
Fifteen Indian cities, read side by side on one climate instrument for the first time.
A 72-page report that puts fifteen Indian cities on the same page, one template fifteen times, so that a city's energy, emissions, risks and plans can be read against its neighbours' for the first time. This is what a country's cities look like once someone insists they be read in one format.
- (role)
- co-author · data · design
- (period)
- 2023
- (context)
- niua · c-cube · fifteen indian cities
- (status)
- published
The city as the unit of account
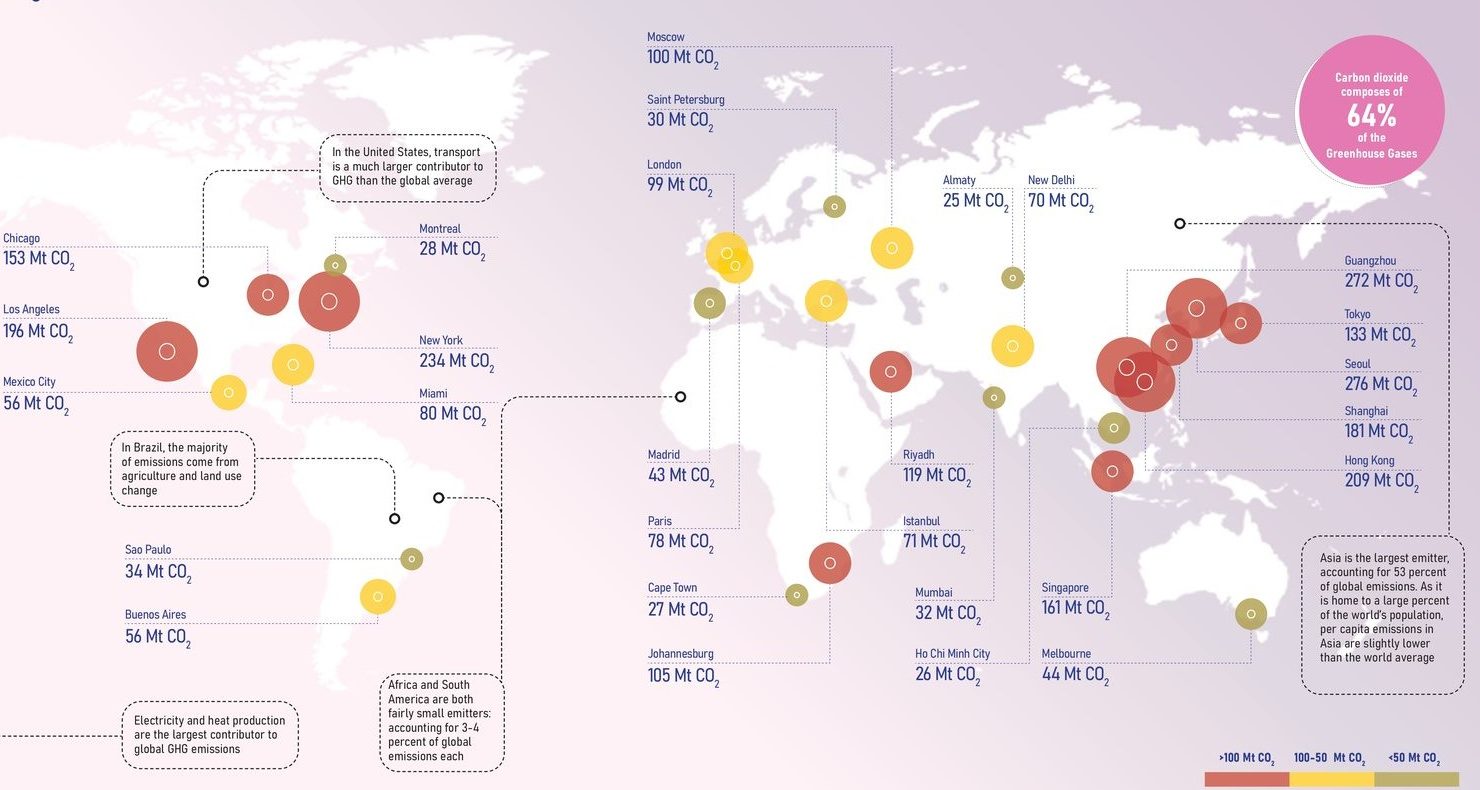
Cities are where emissions are made and where the data is worst. The report starts with the world's cities as the unit of account: fifty footprints on one map, a handful of them larger than most countries, because that is the scale at which anything gets decided and the scale at which almost nothing is measured well.
Two lines after 2019
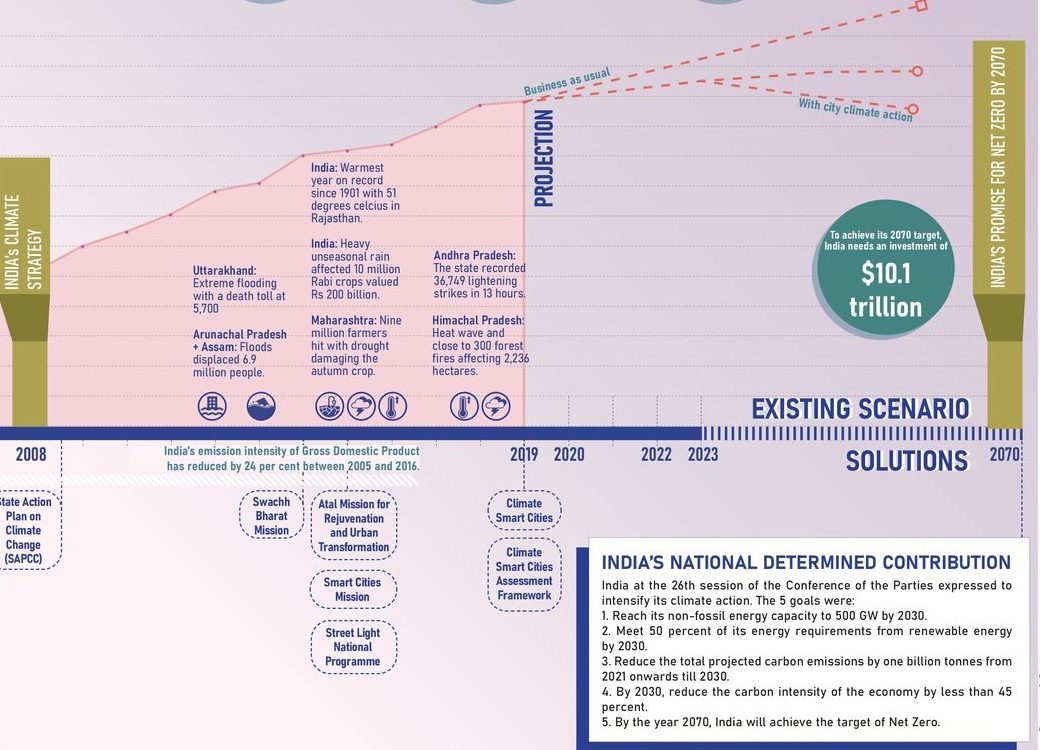
India's curve runs up to 2019 and then splits: business as usual, or what the cities could do. The national commitments (500 GW of non-fossil capacity, a billion tonnes cut by 2030, net zero by 2070) are made in Delhi and delivered, if at all, by municipalities.
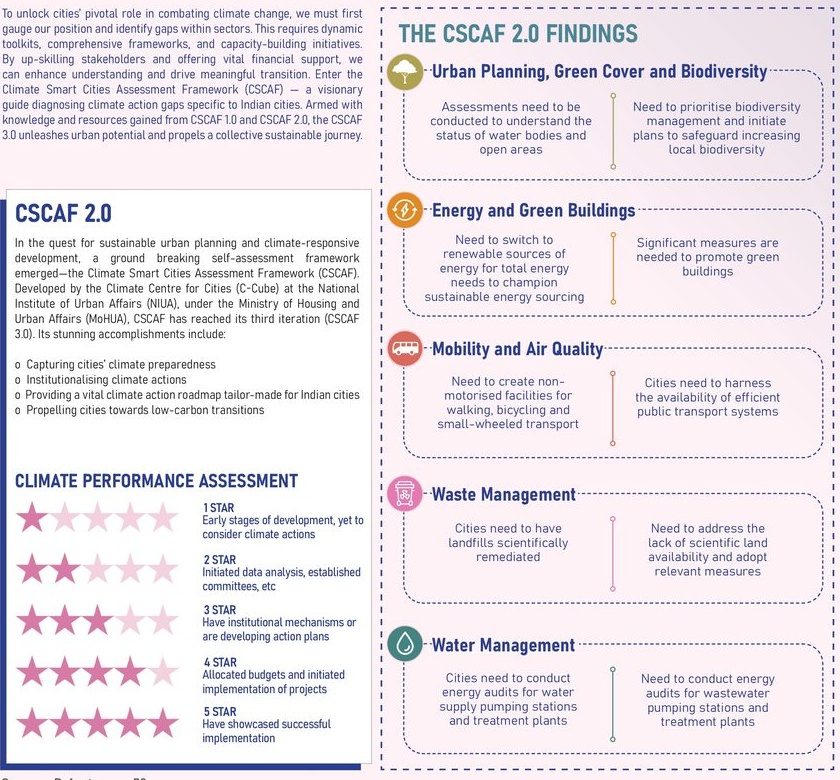
A city as a star rating
CSCAF 2.0 is the framework that turns a city into a rating: five sectors, five stars, from "yet to consider" to "showcased successful implementation." It is the first instrument that lets fifteen Indian cities be read against each other at all. Ten of them were already acting on it.
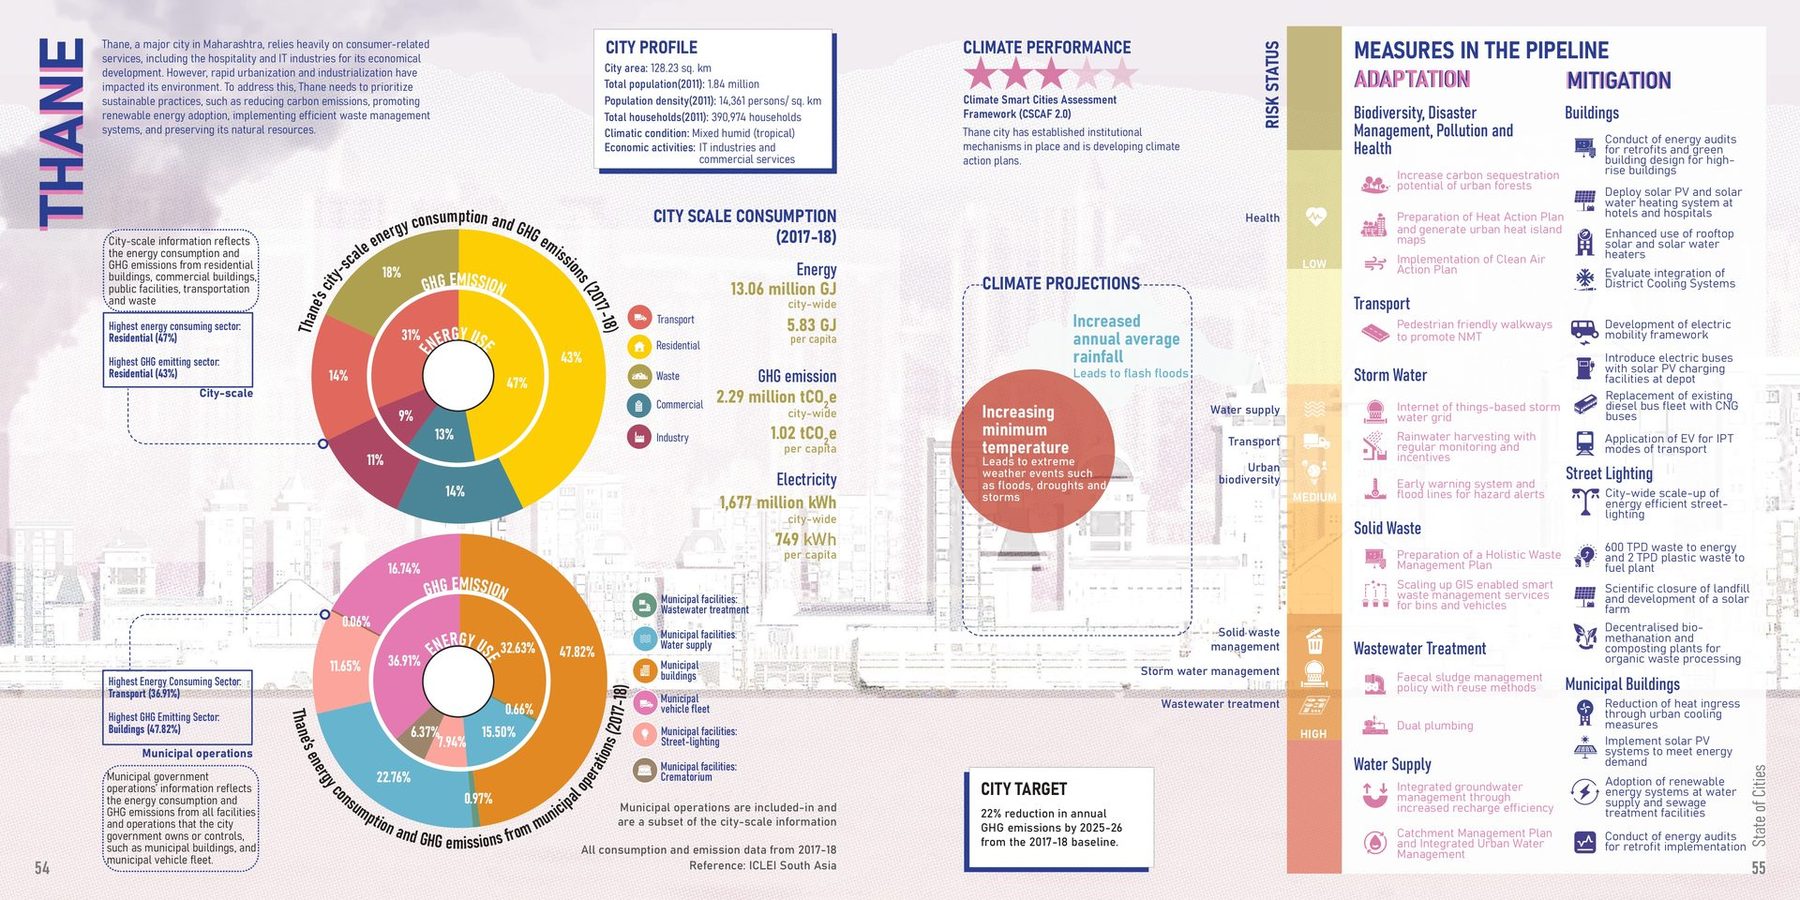
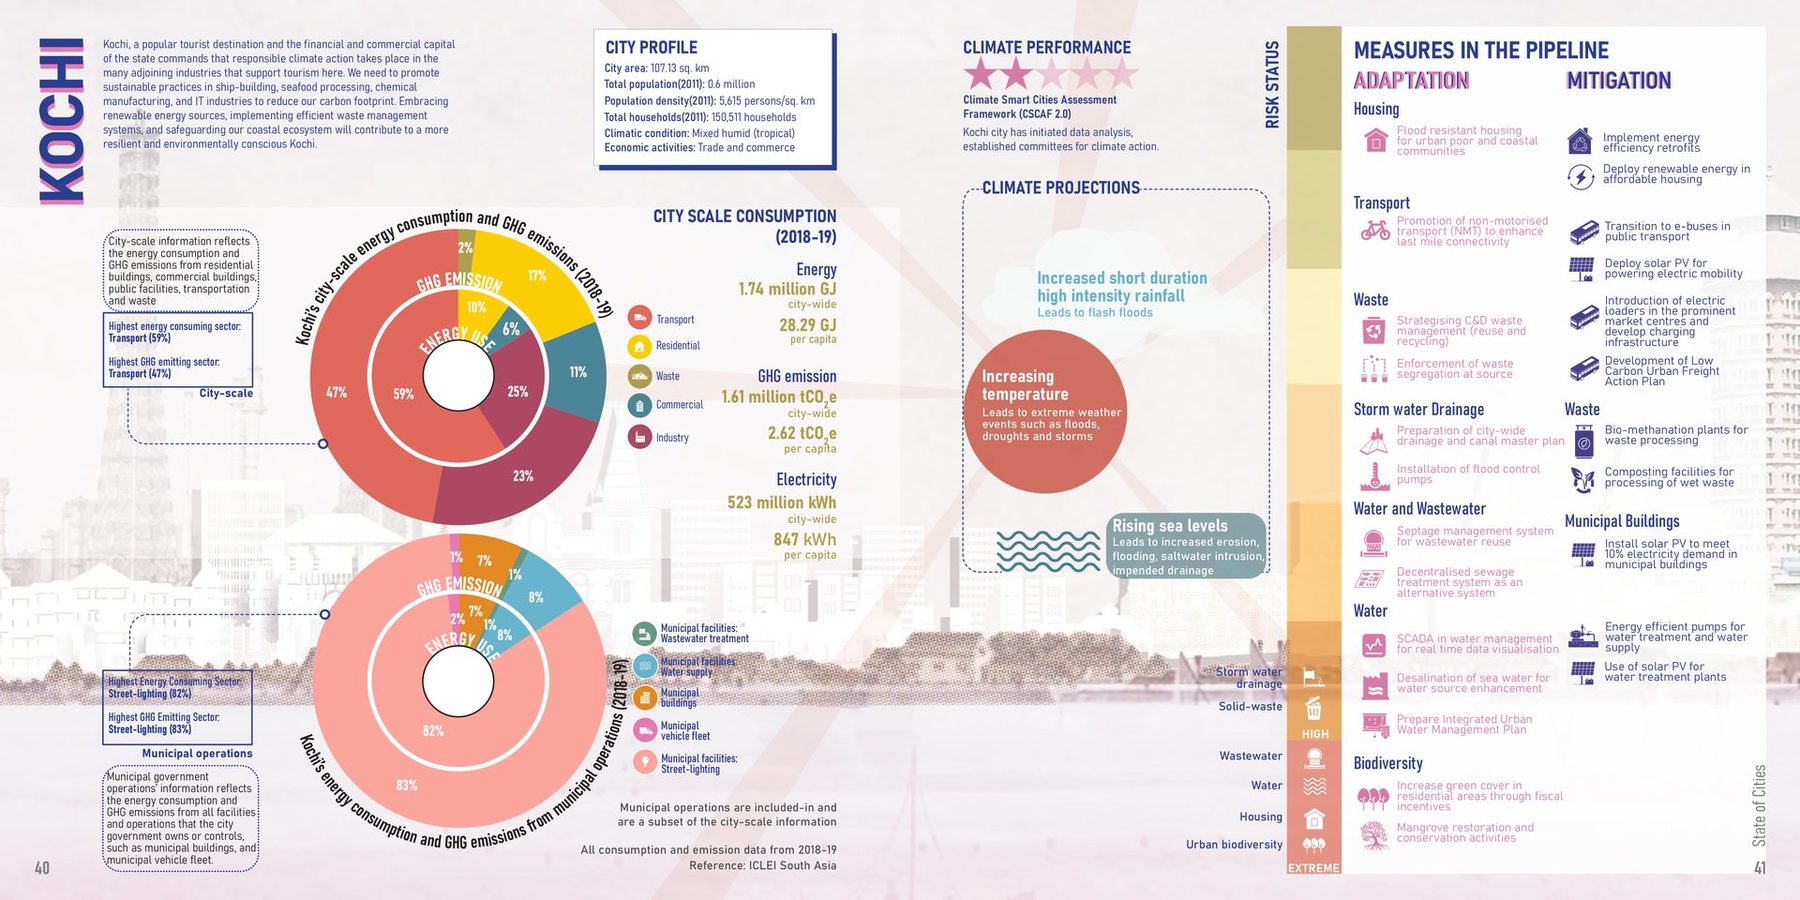
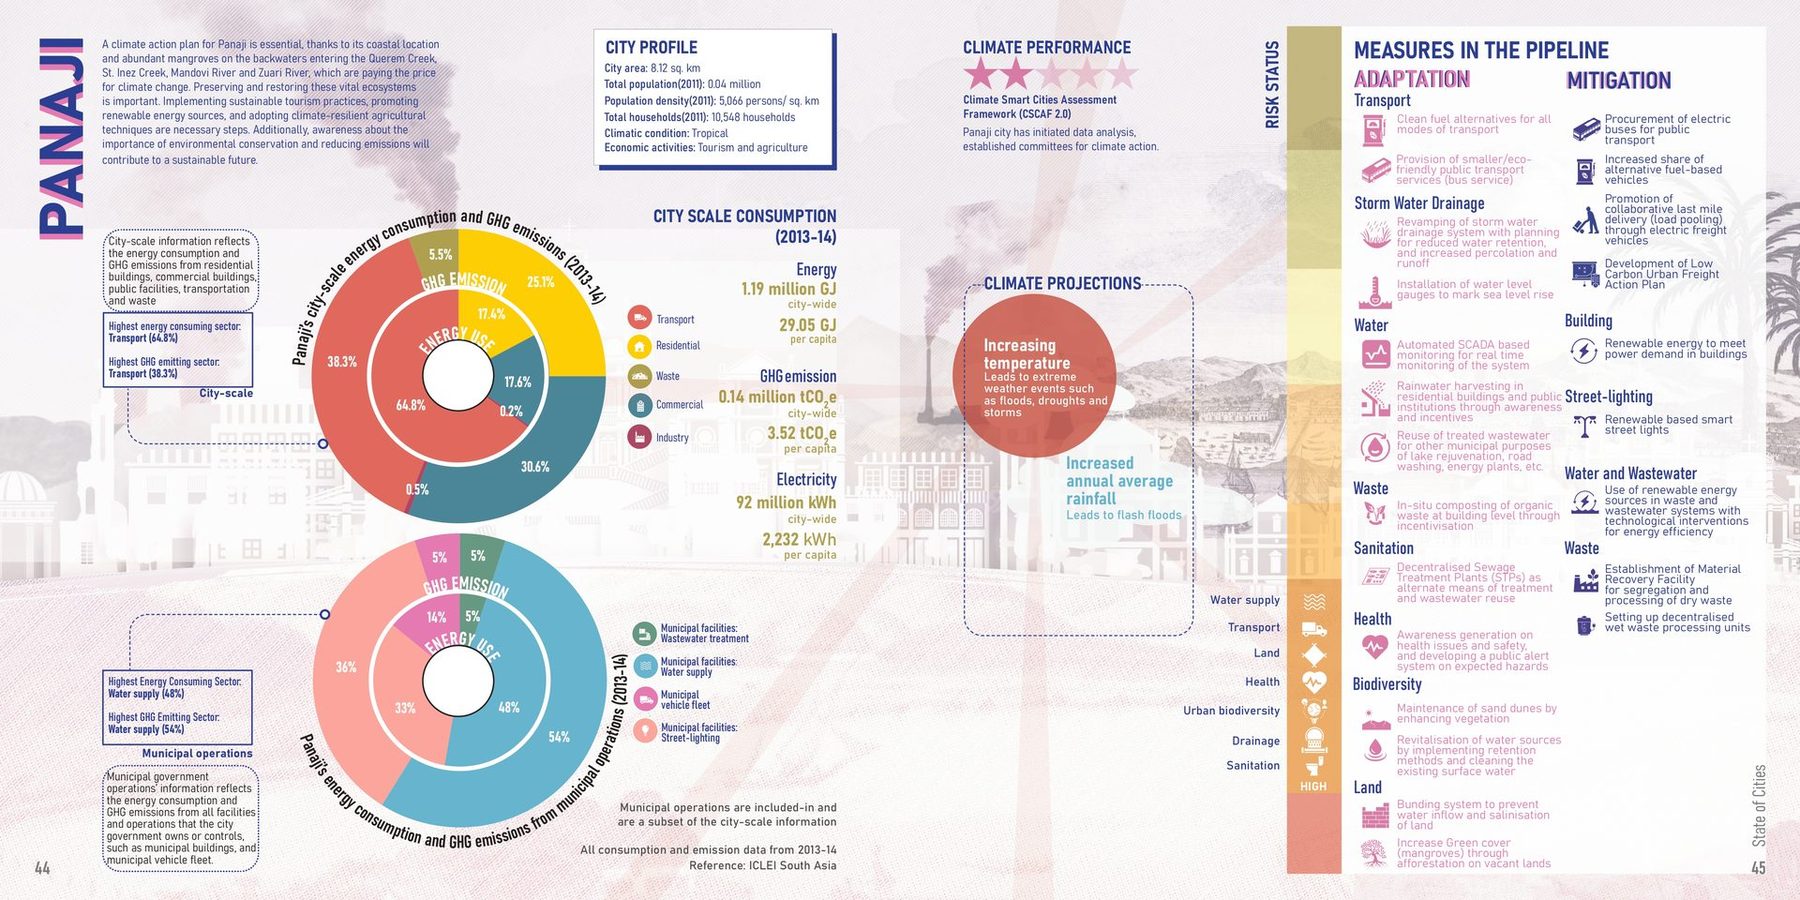
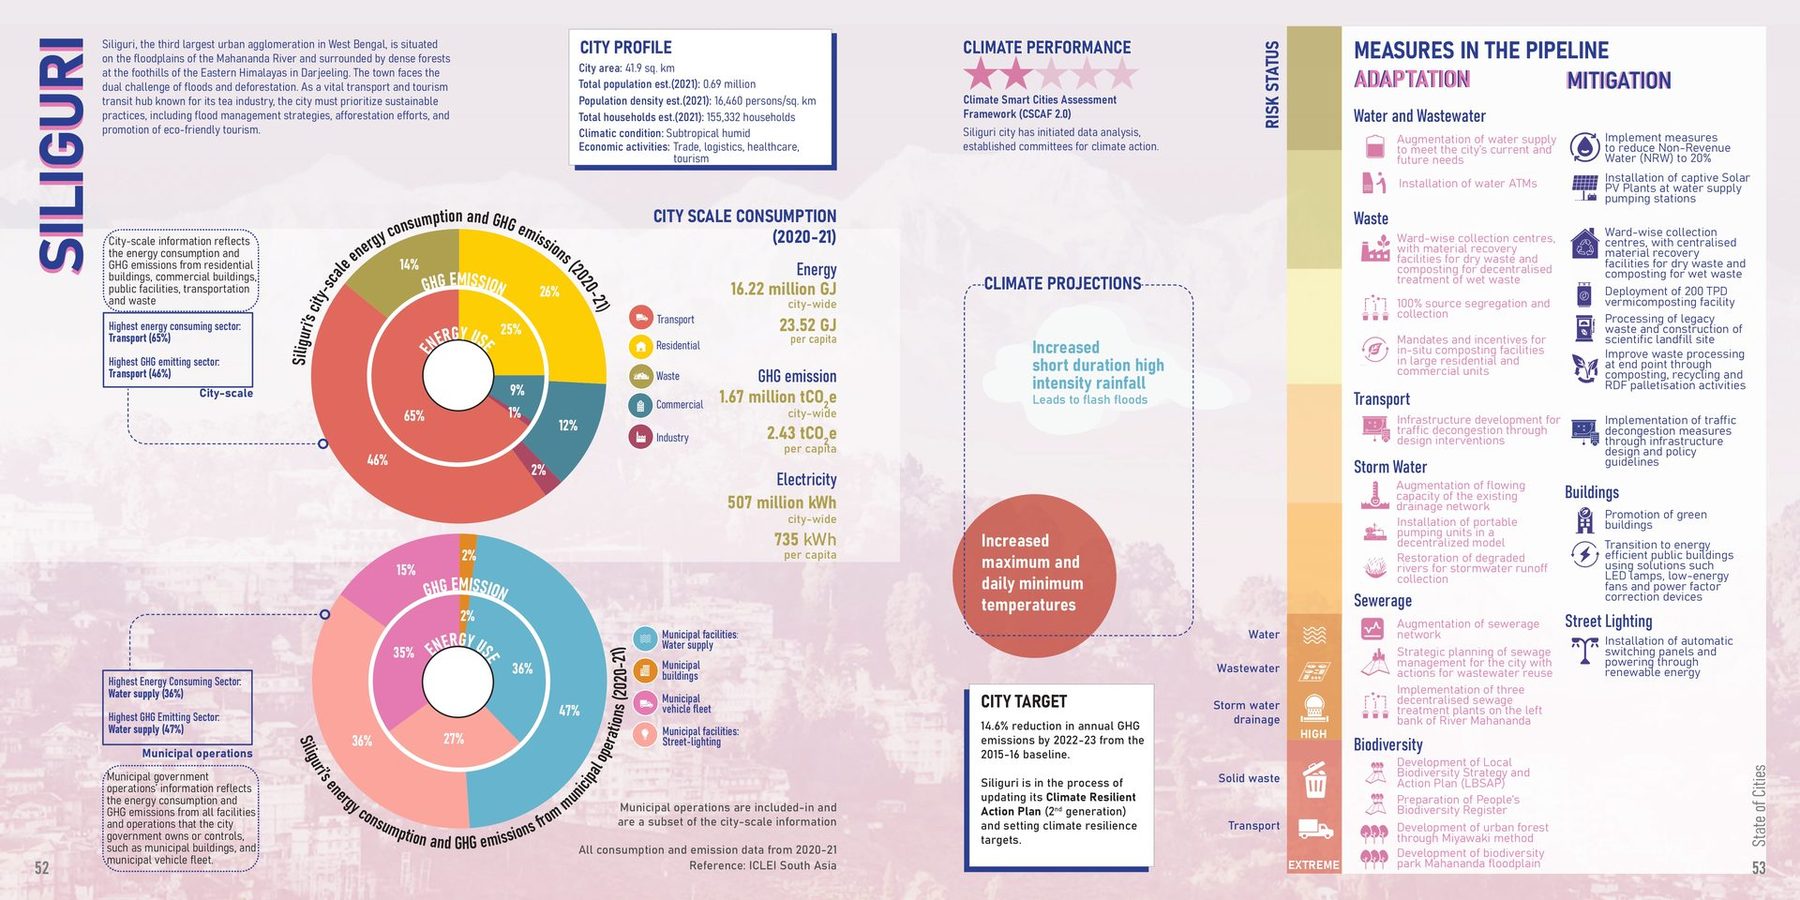
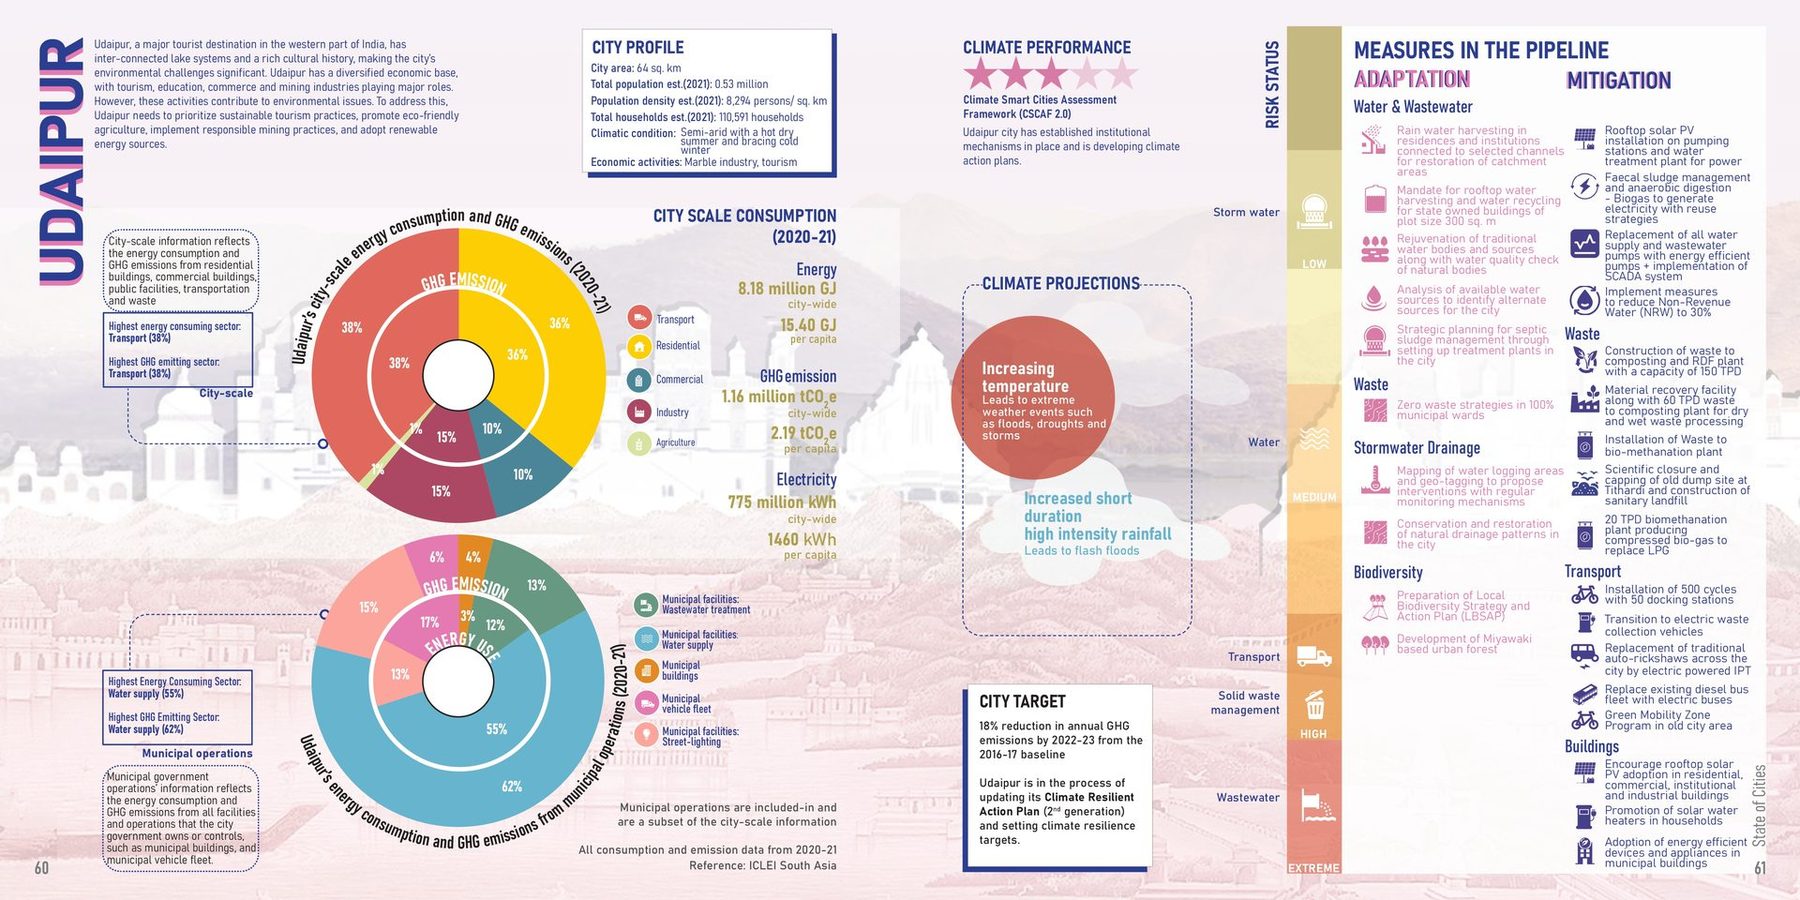
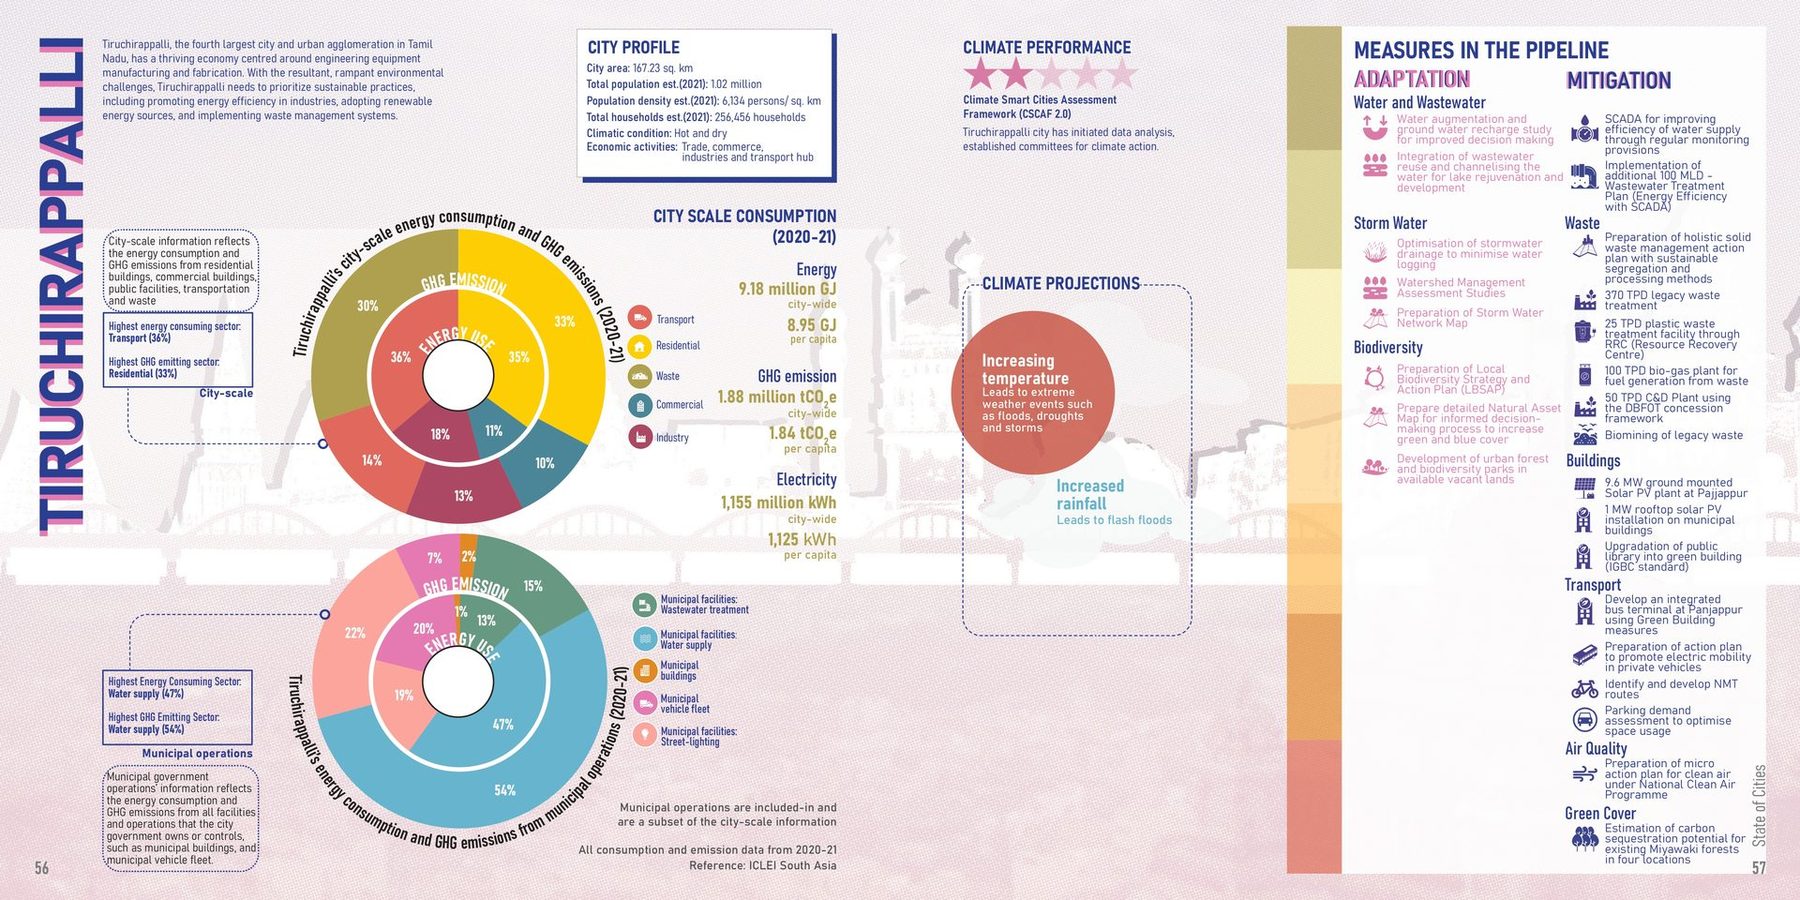
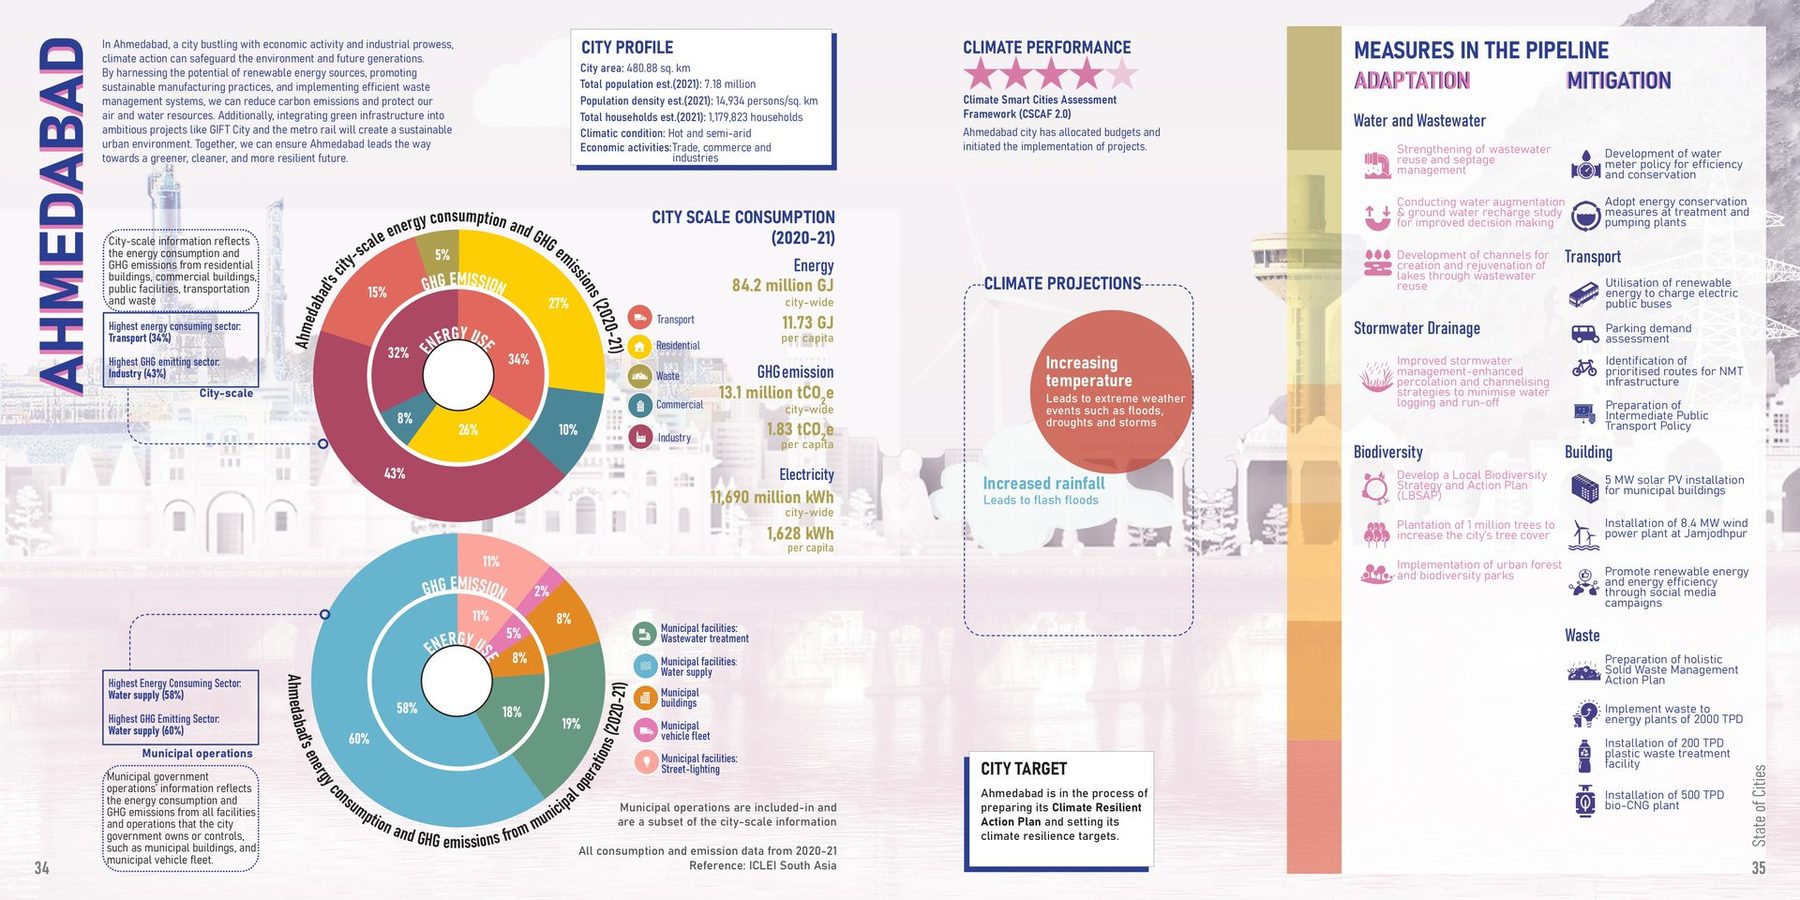
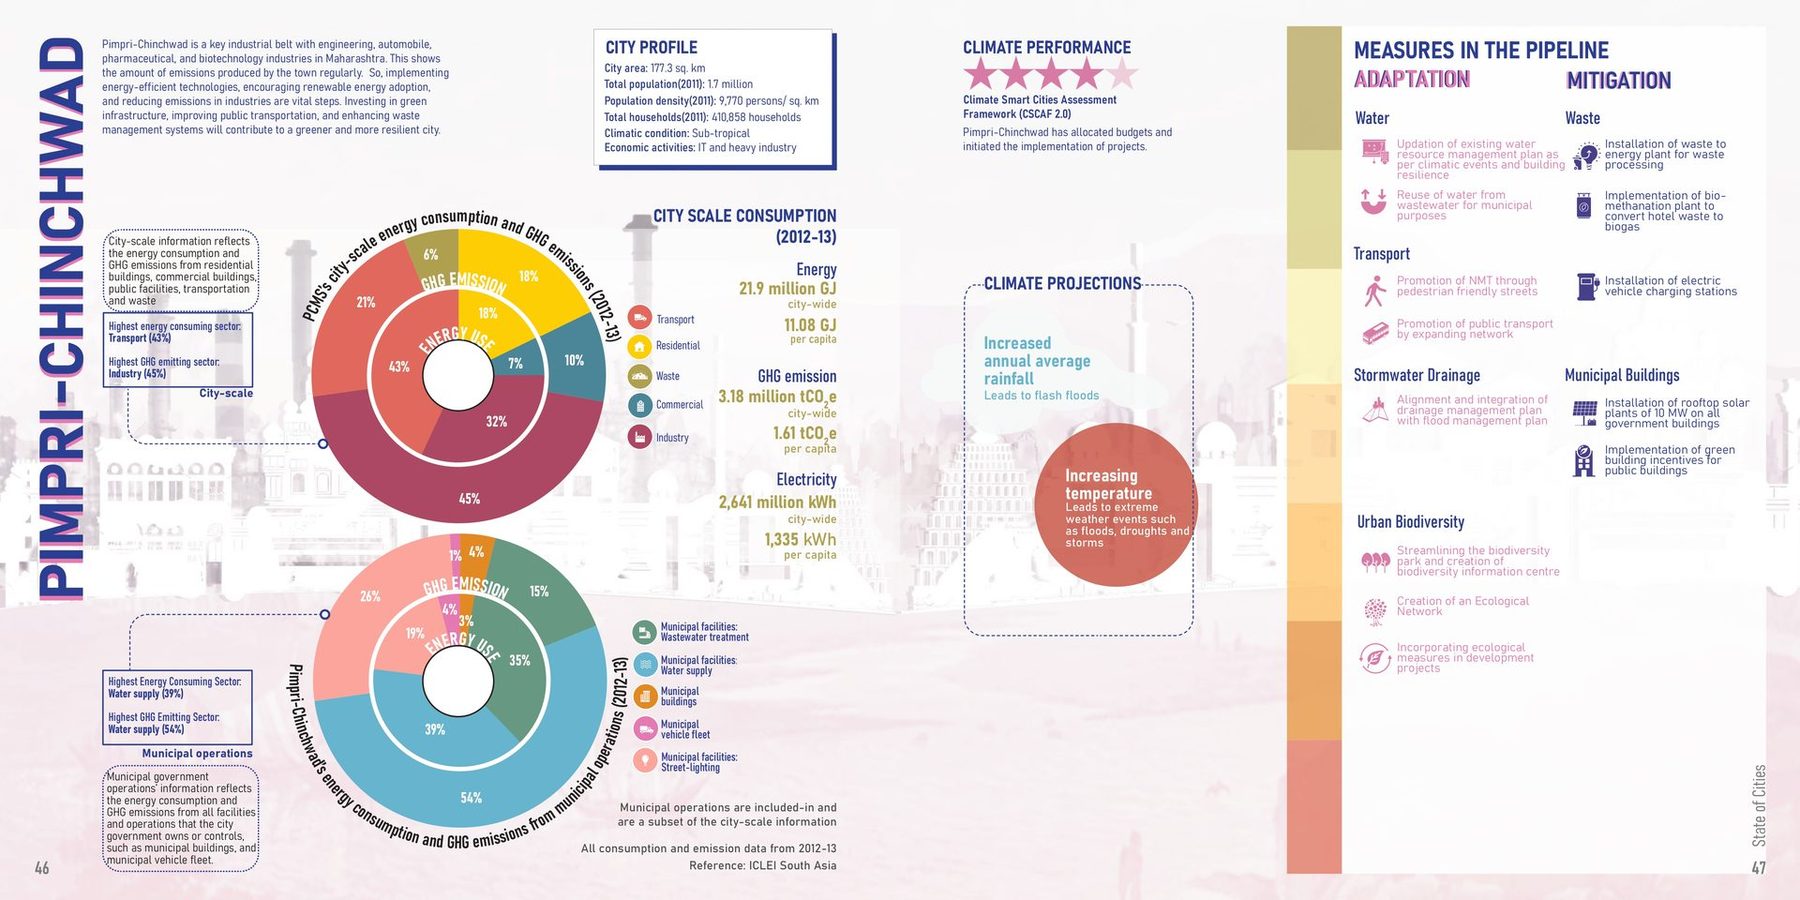
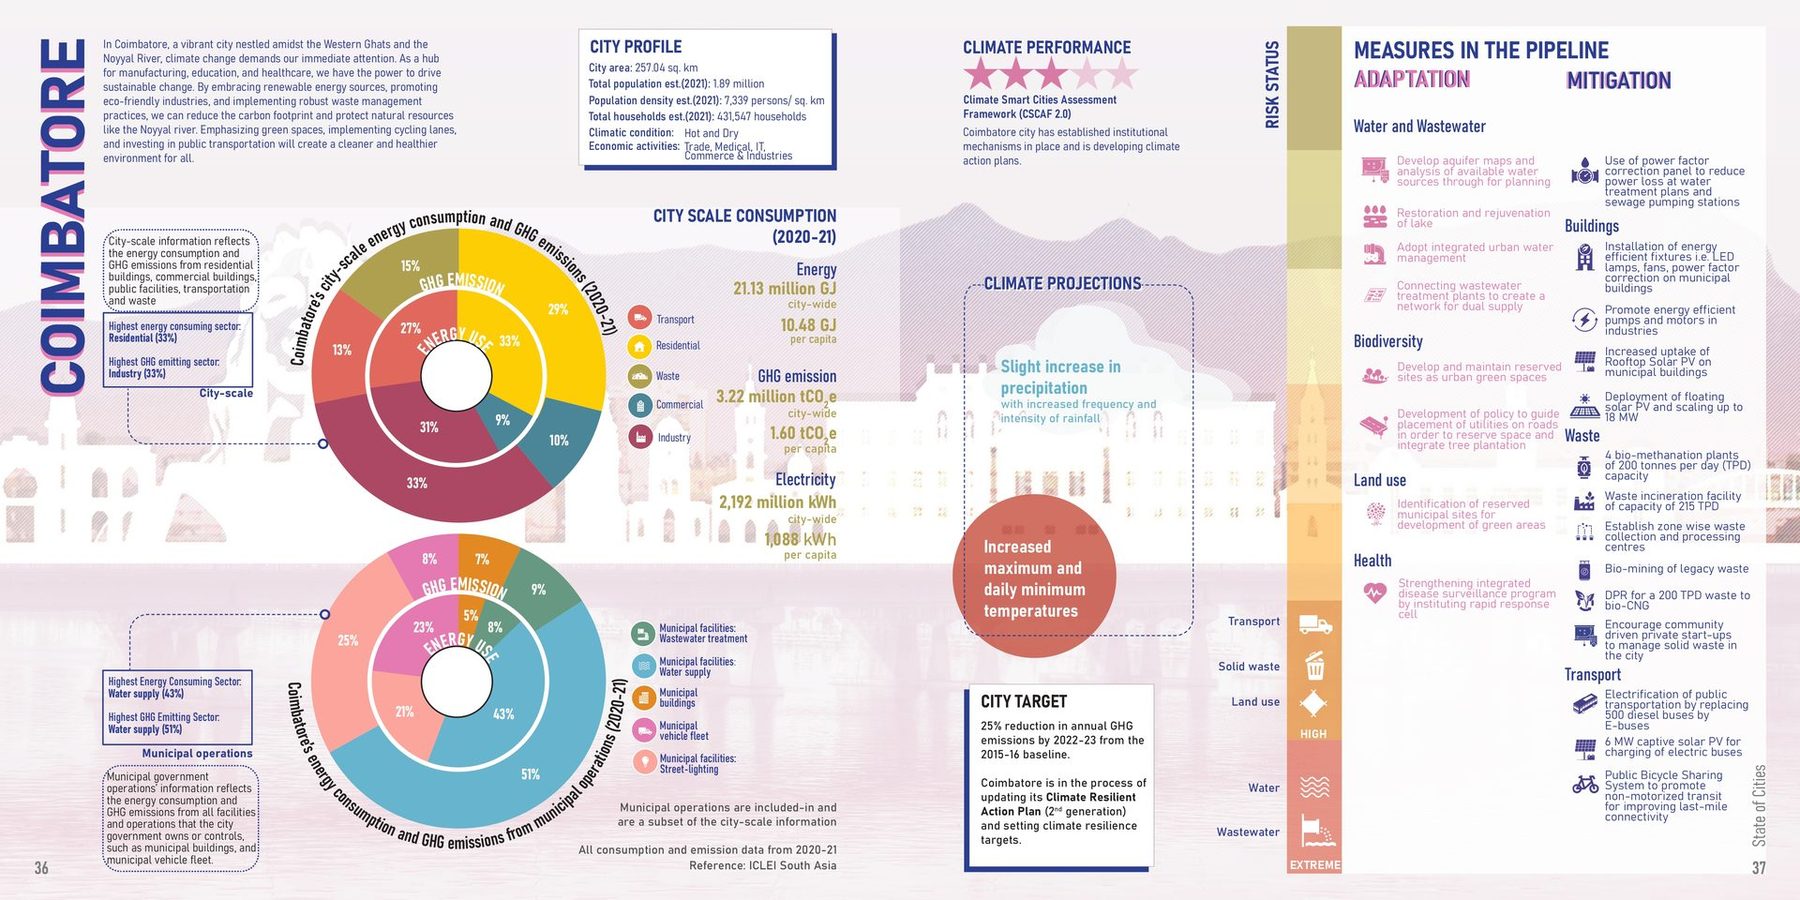
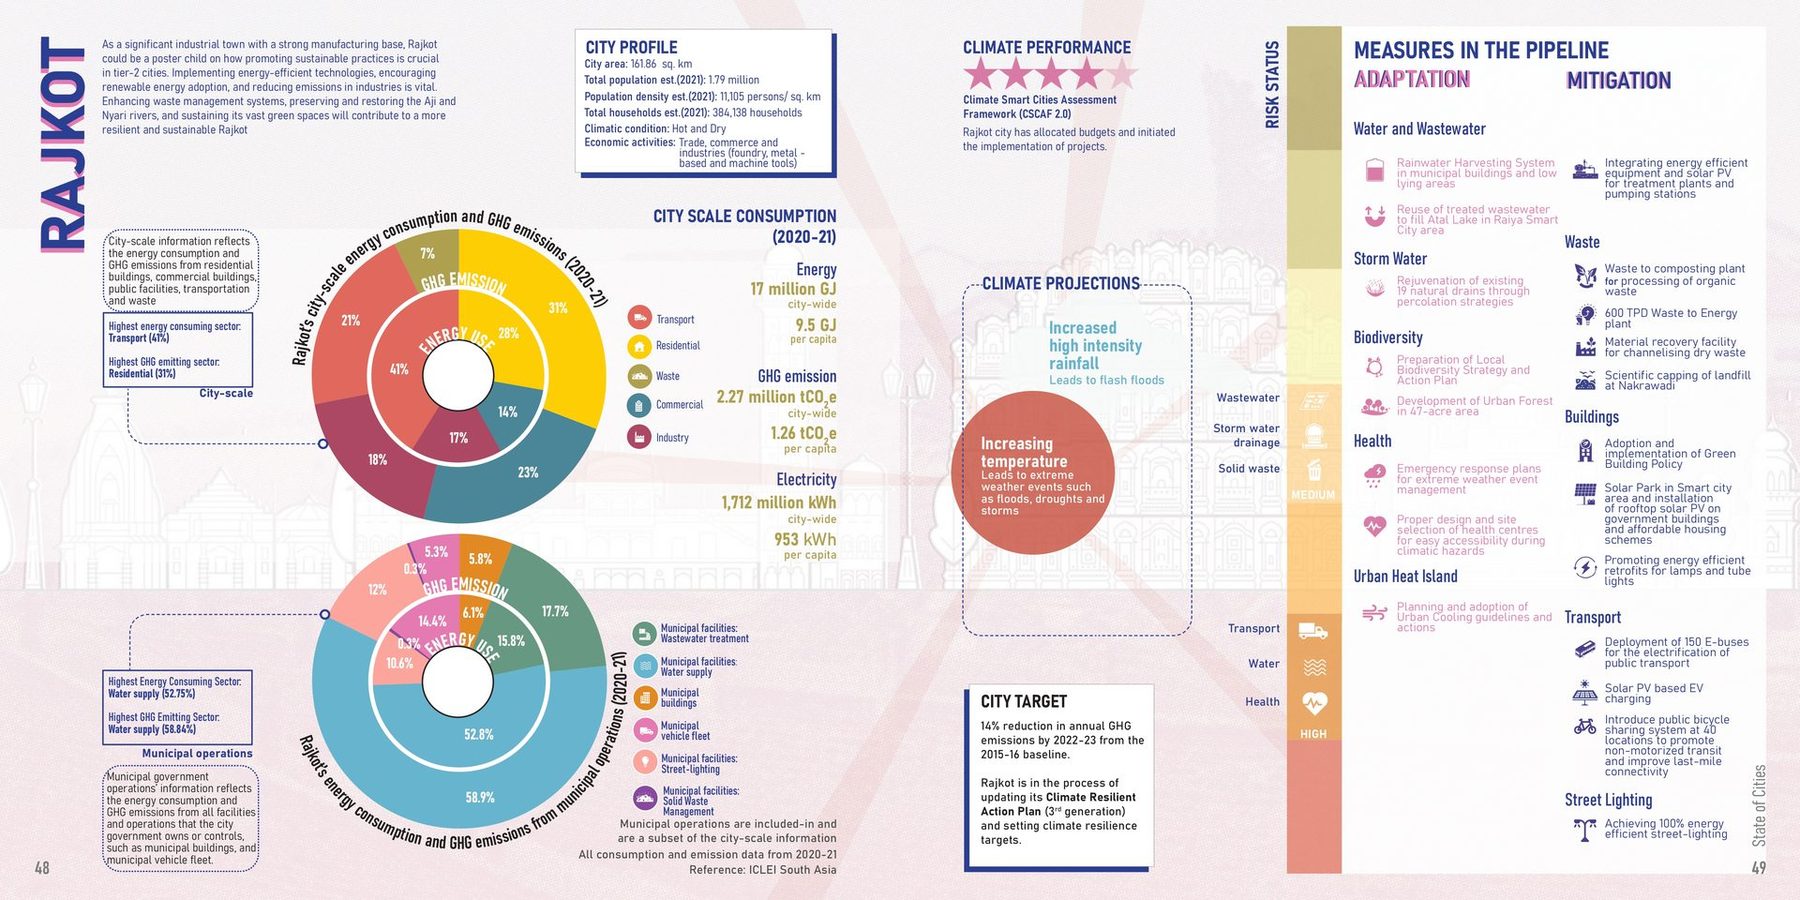
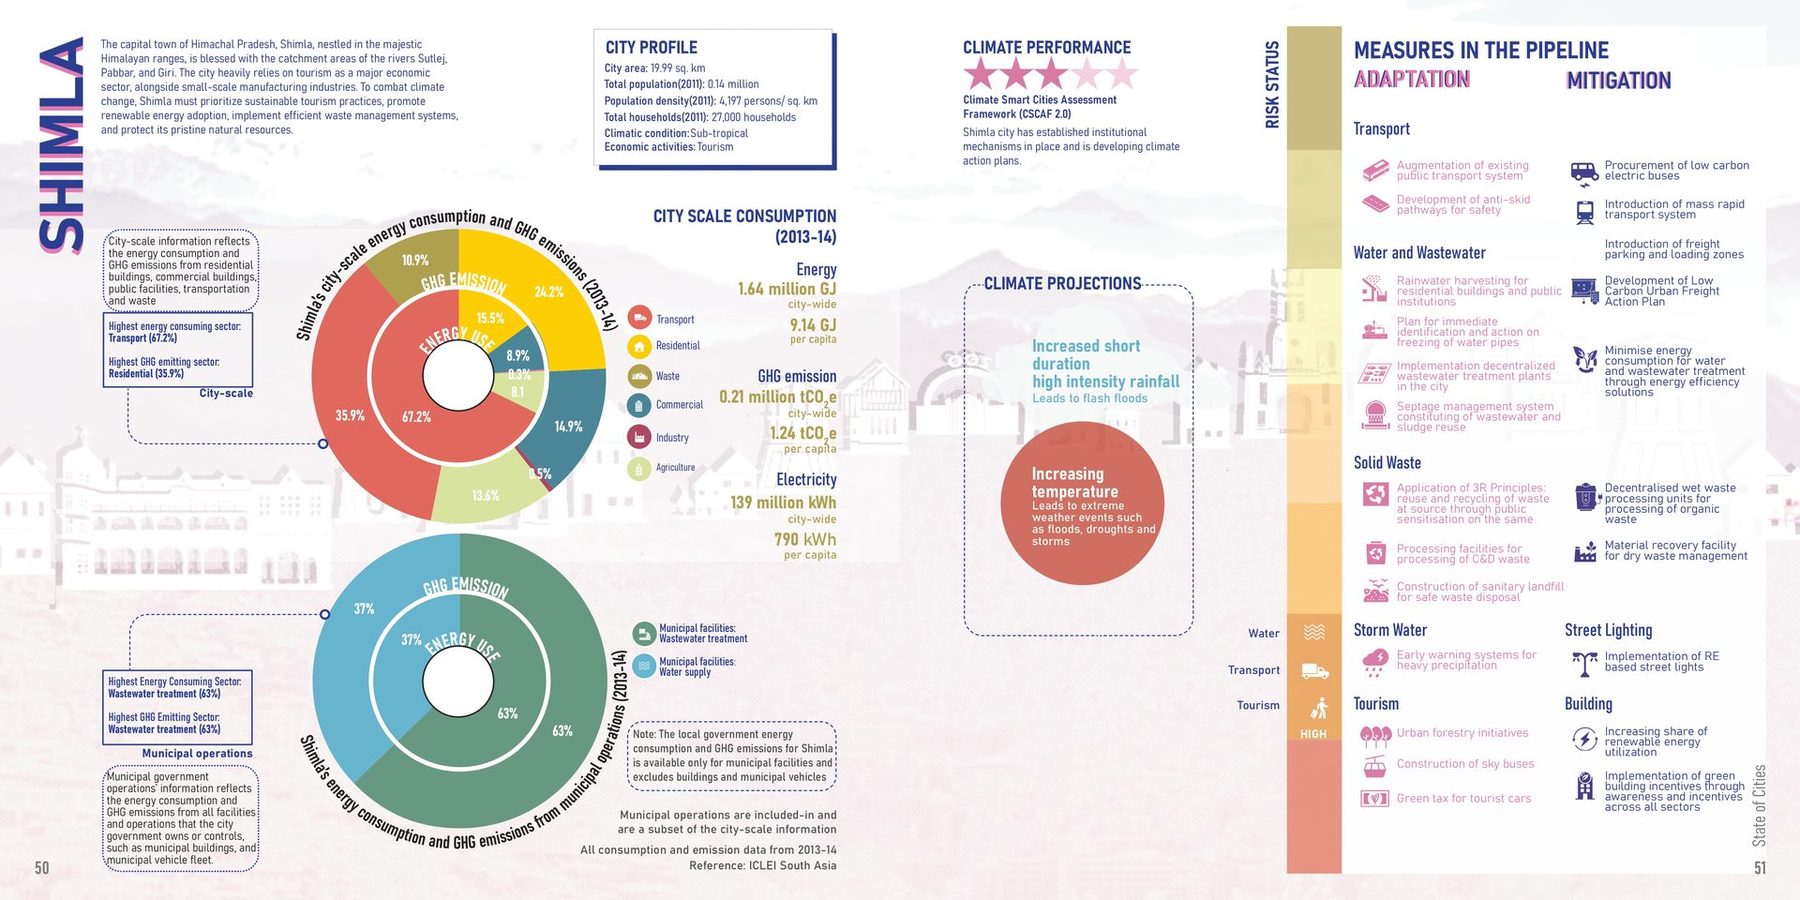
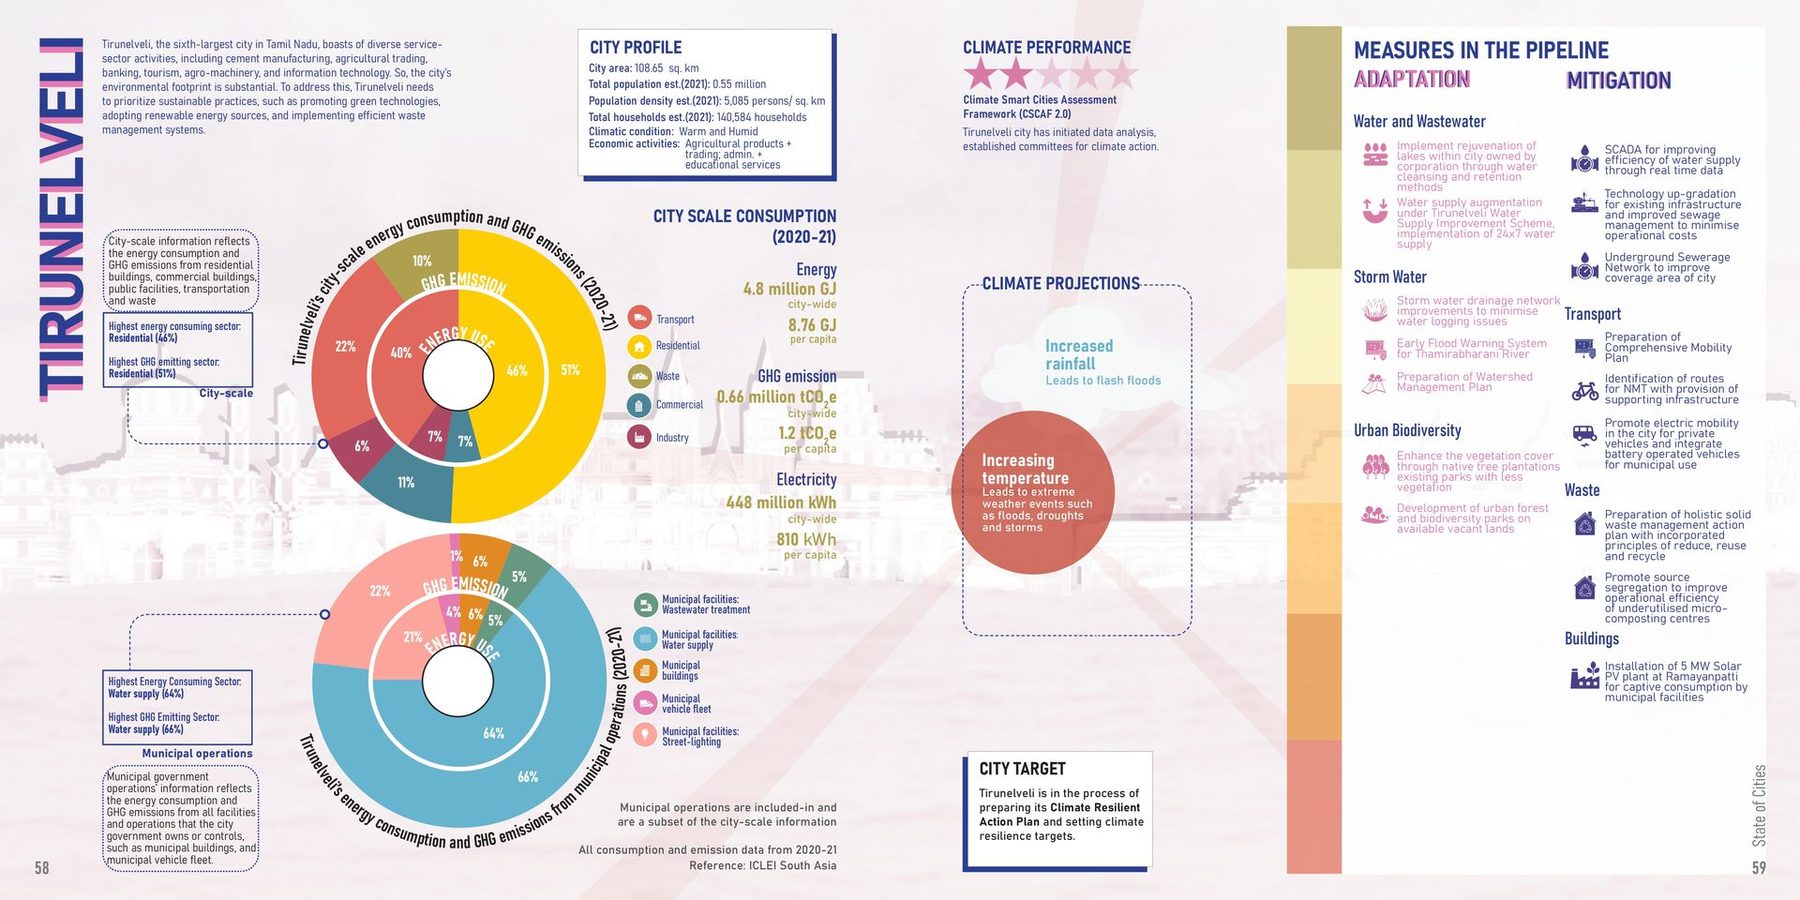
City view
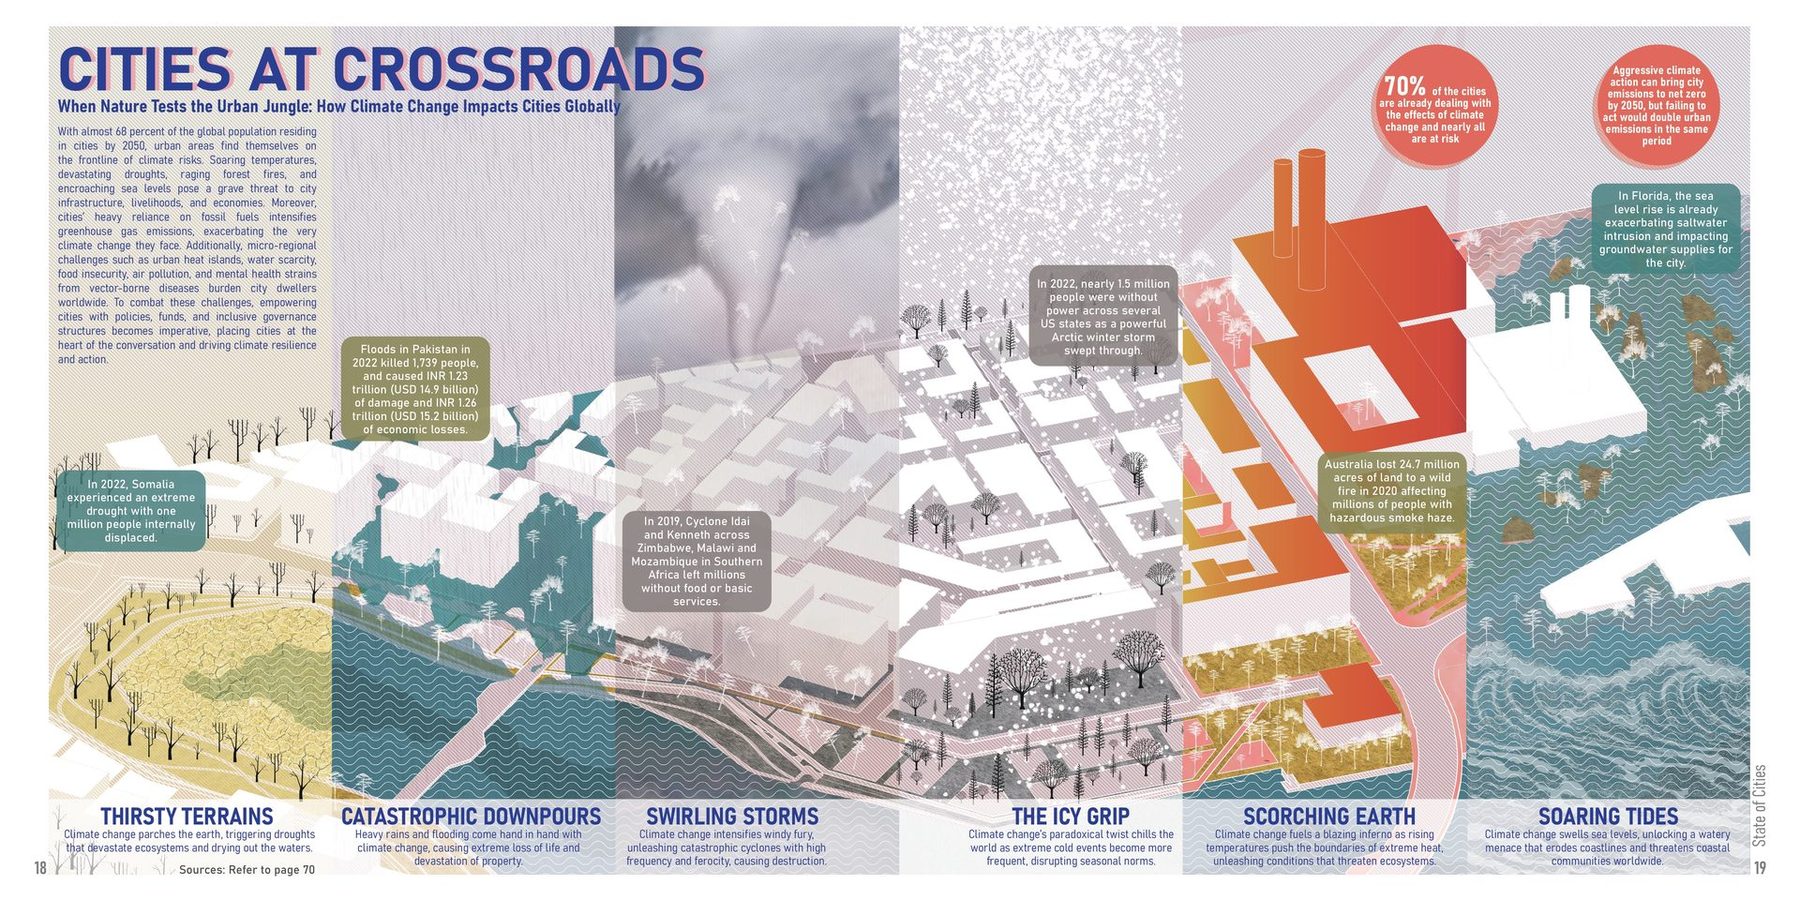
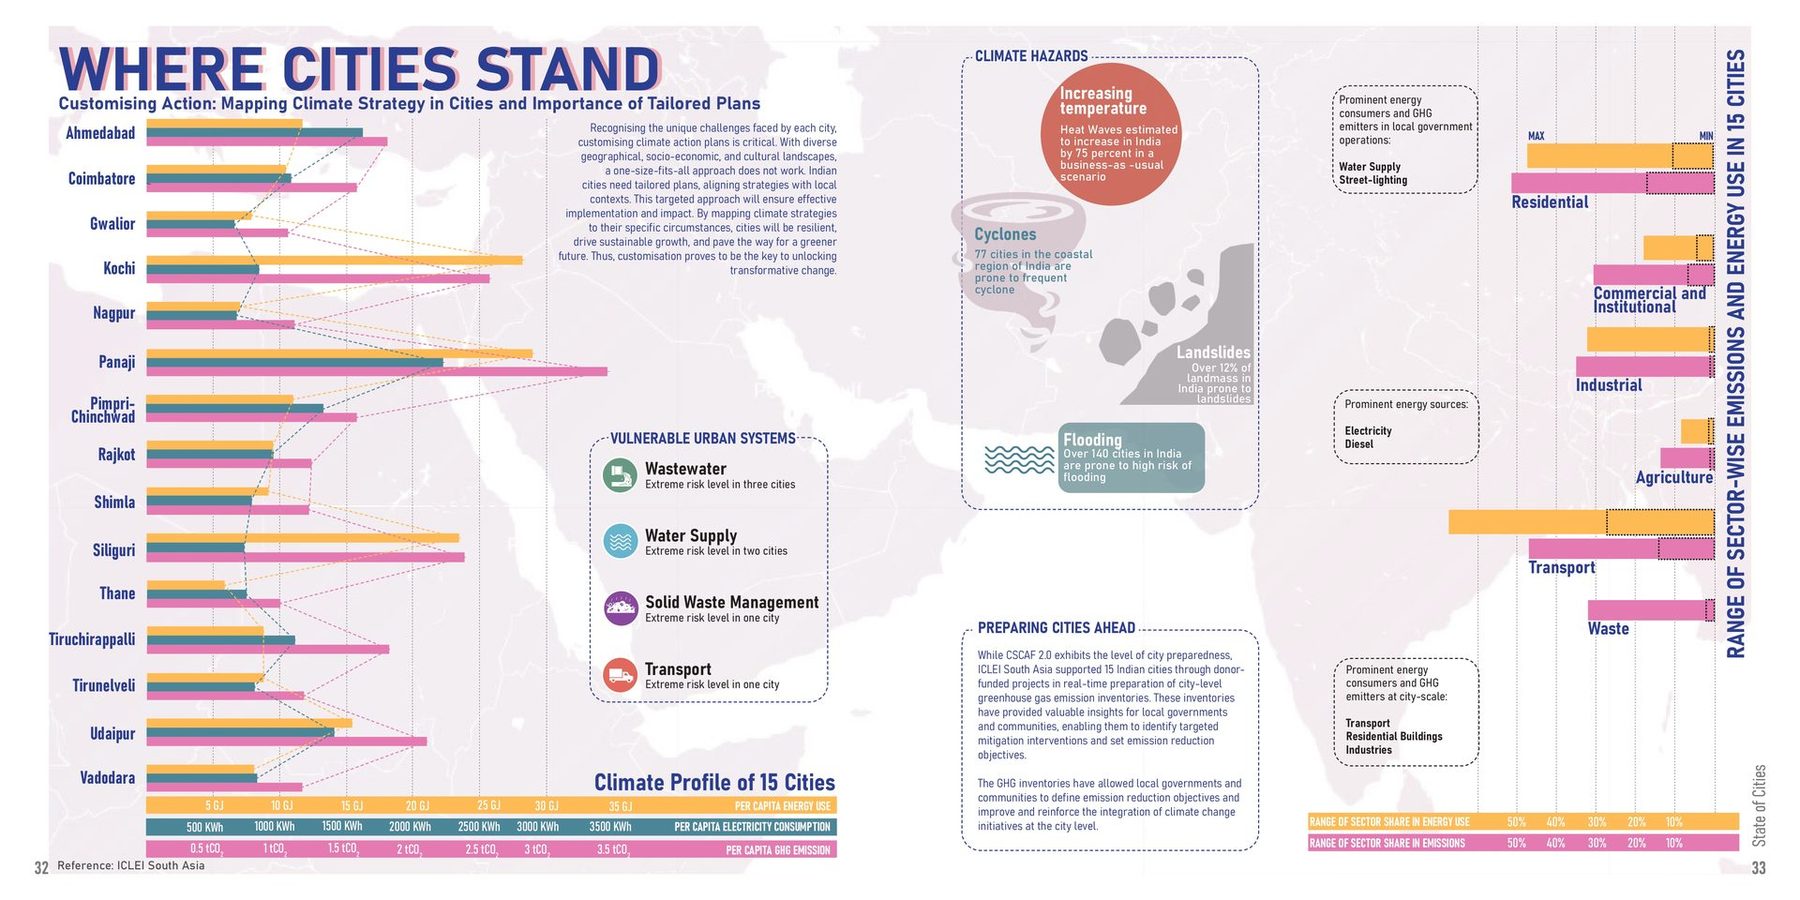
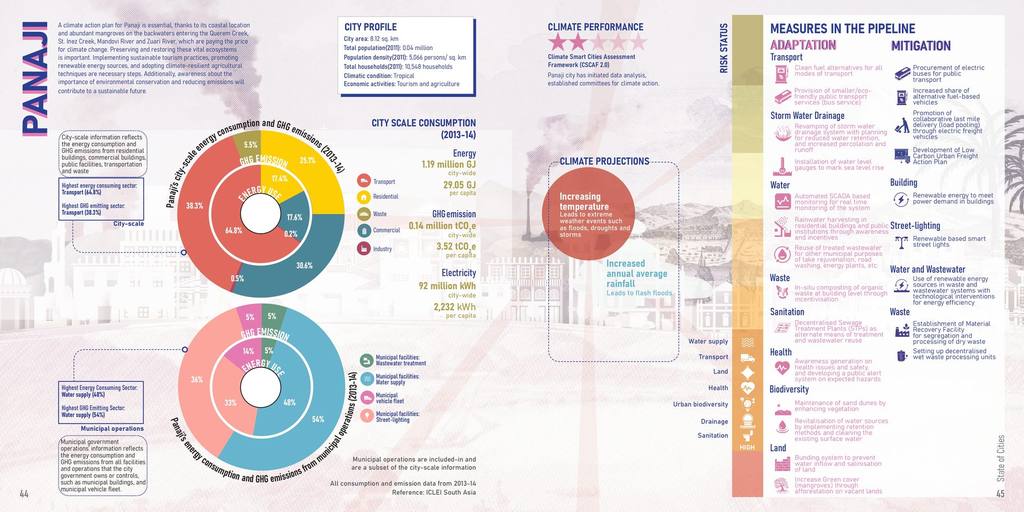
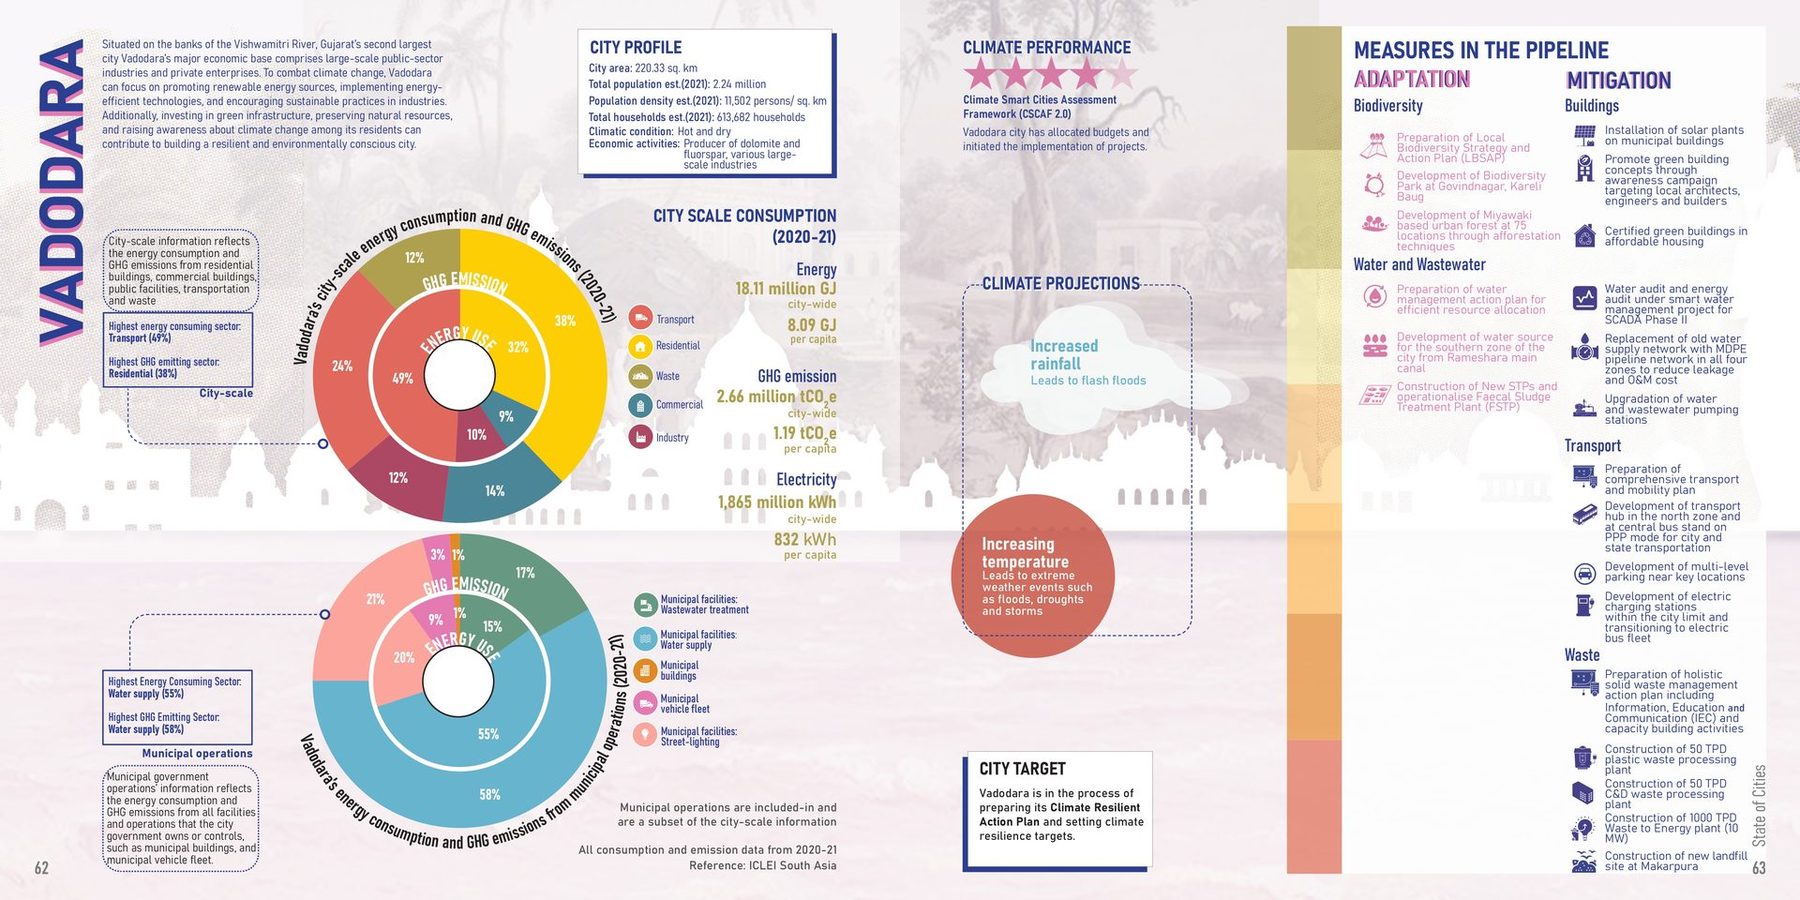
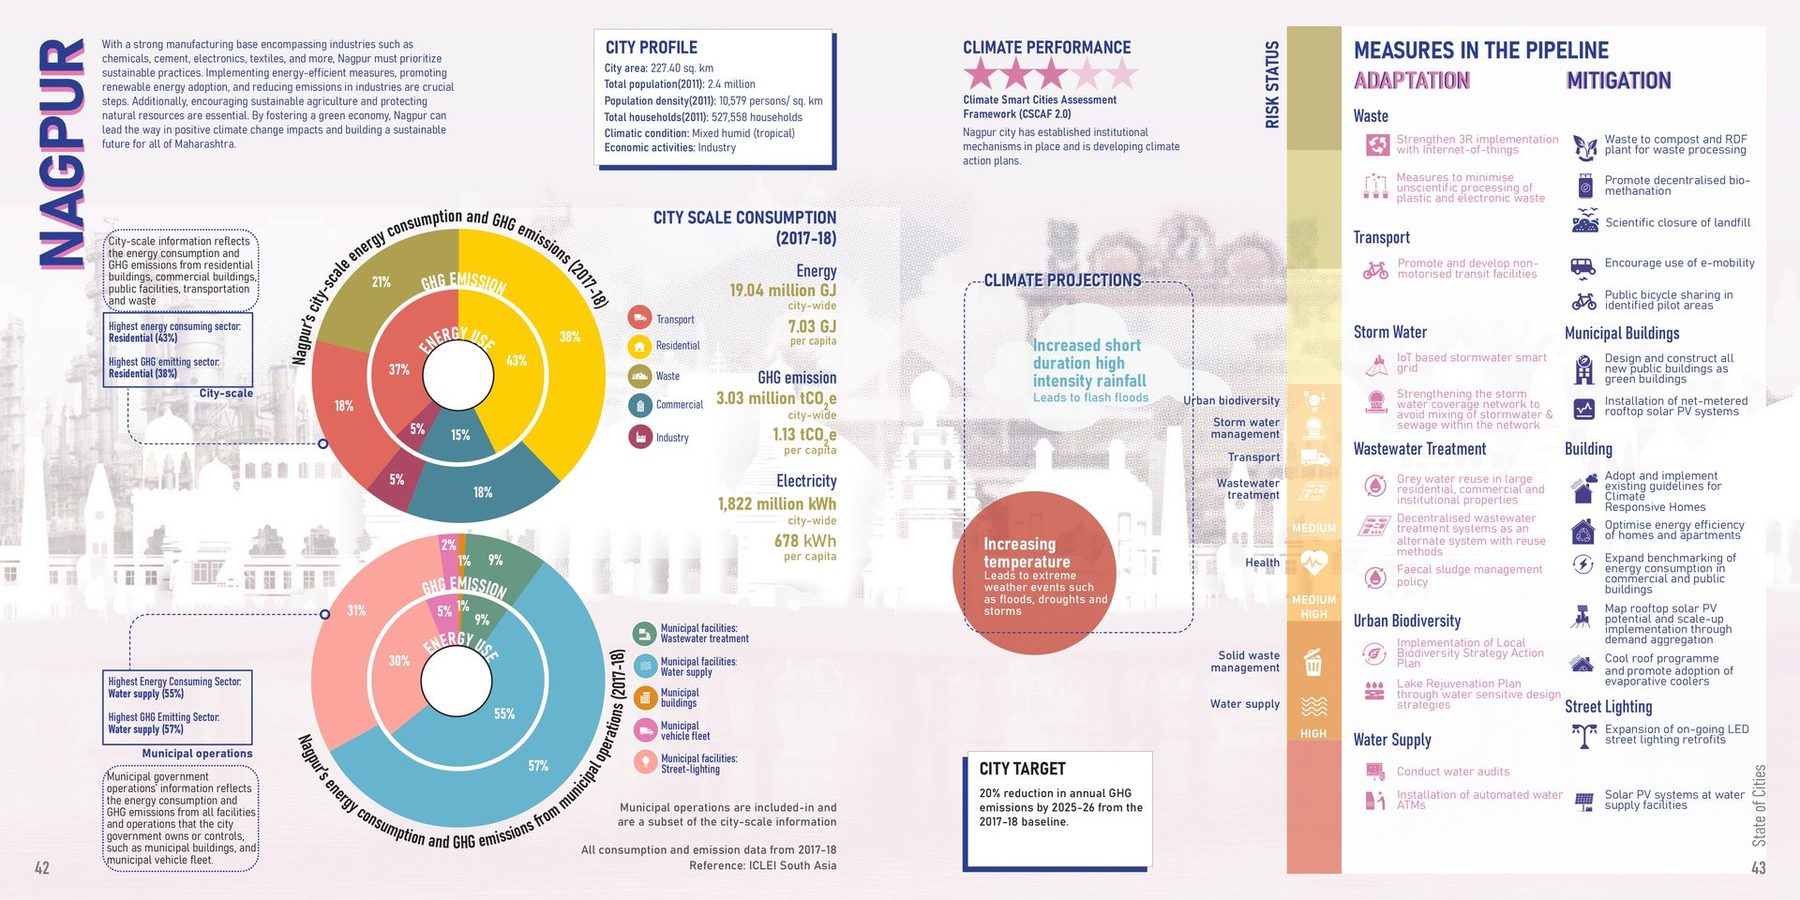
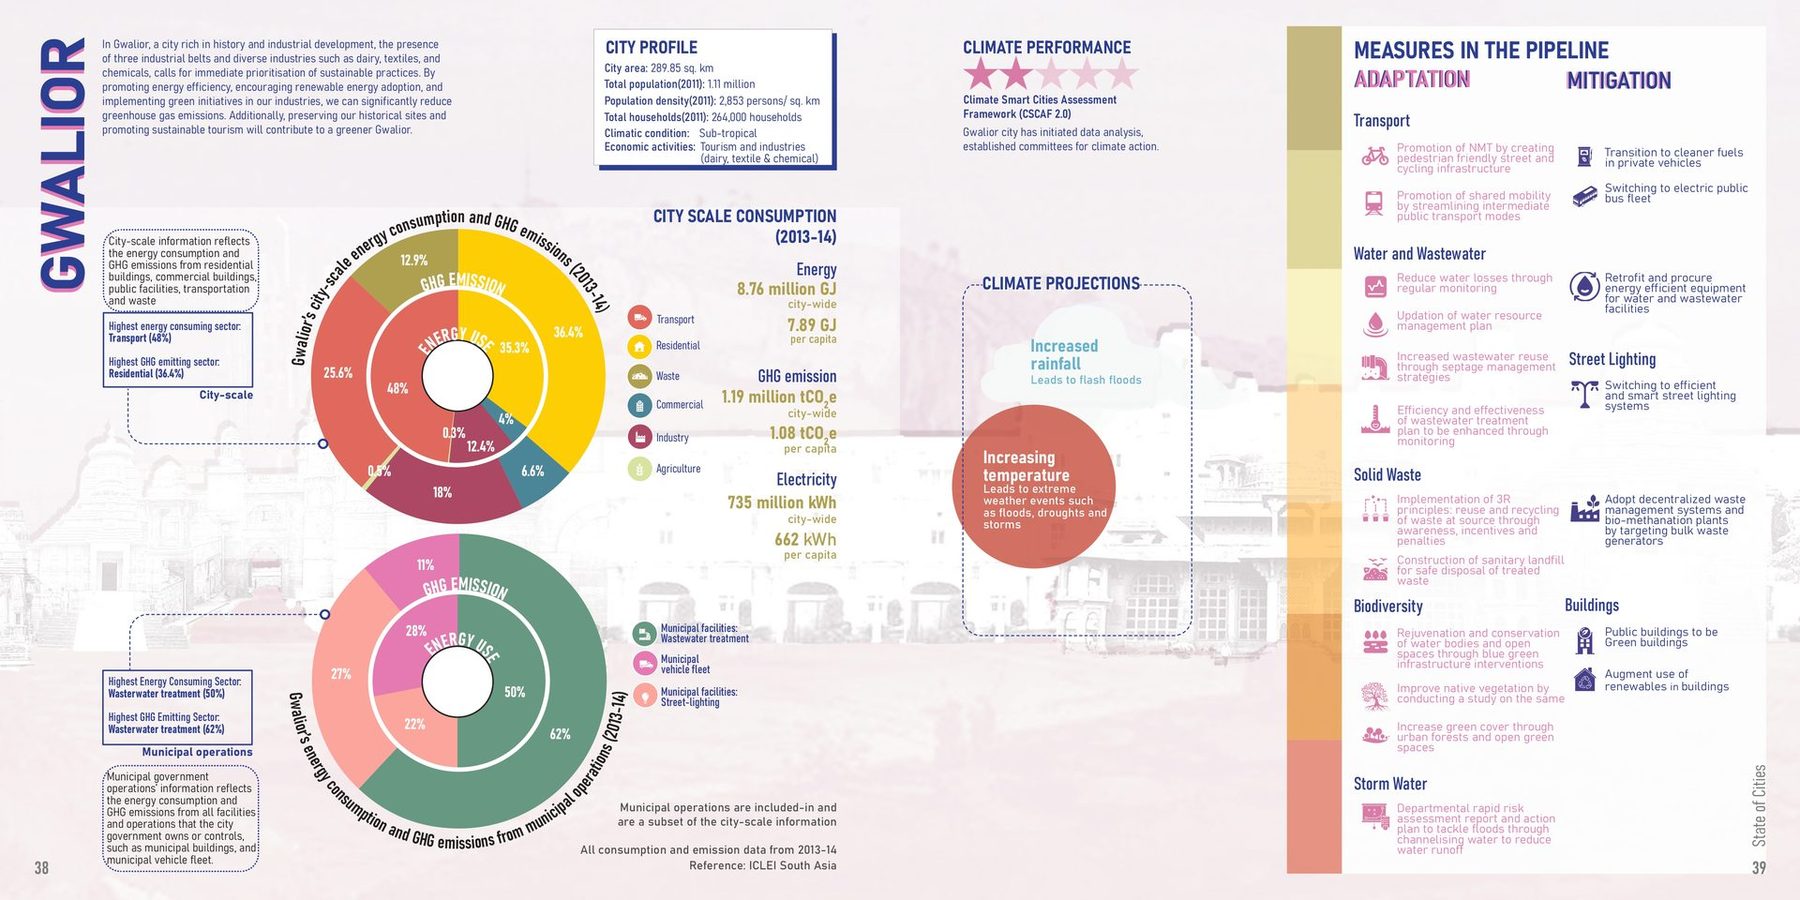
The climate challenge in India's cities has its own shape. Growing emissions land on top of what the cities already carry: rising temperatures, air pollution, water scarcity, extreme weather. Some have moved: renewable energy, waste systems, a first inventory. But none of it becomes a country's plan until the cities can be read together. So the report reads fifteen of them the same way: twenty-four million people, 246 million GJ of energy, 38 million tonnes of CO₂e in a year, and 319 actions, 147 for adaptation and 172 for mitigation, with one profile, one rating and one set of measures on the same page.
A person in Panaji is charged three and a half tonnes a year, a person in Thane one. Transport leads energy use almost everywhere; water supply is most of what a municipality itself burns. And the inventories run from 2012 to 2021: the page shows how unevenly the country measures its cities, and how much a common format still makes legible.
- Panaji
- Kochi
- Siliguri
- Udaipur
- Tiruchirappalli
- Ahmedabad
- Pimpri-Chinchwad
- Coimbatore
- Rajkot
- Shimla
- Tirunelveli
- Vadodara
- Nagpur
- Gwalior
- Thane
What the loop needs
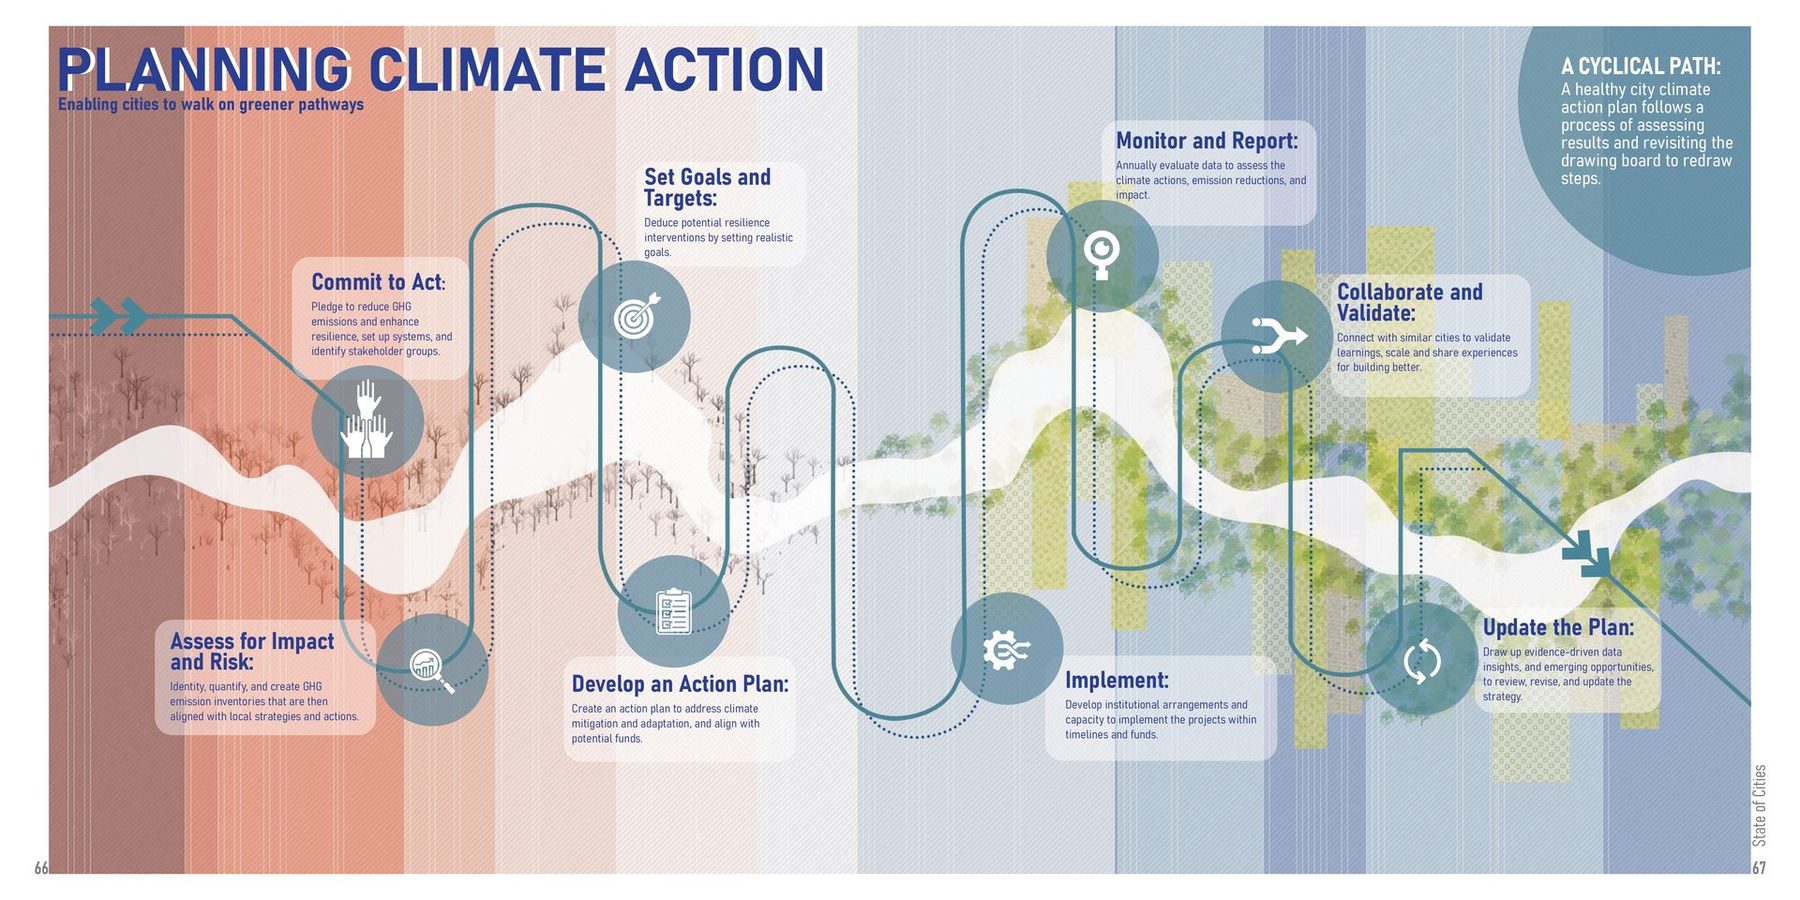
Assess, commit, plan, implement, monitor, revise. The book draws it as a loop. The loop needs one thing most cities do not have: a data layer they can maintain themselves, which is where the next five years of this work went.
What the loop costs, in two horizons
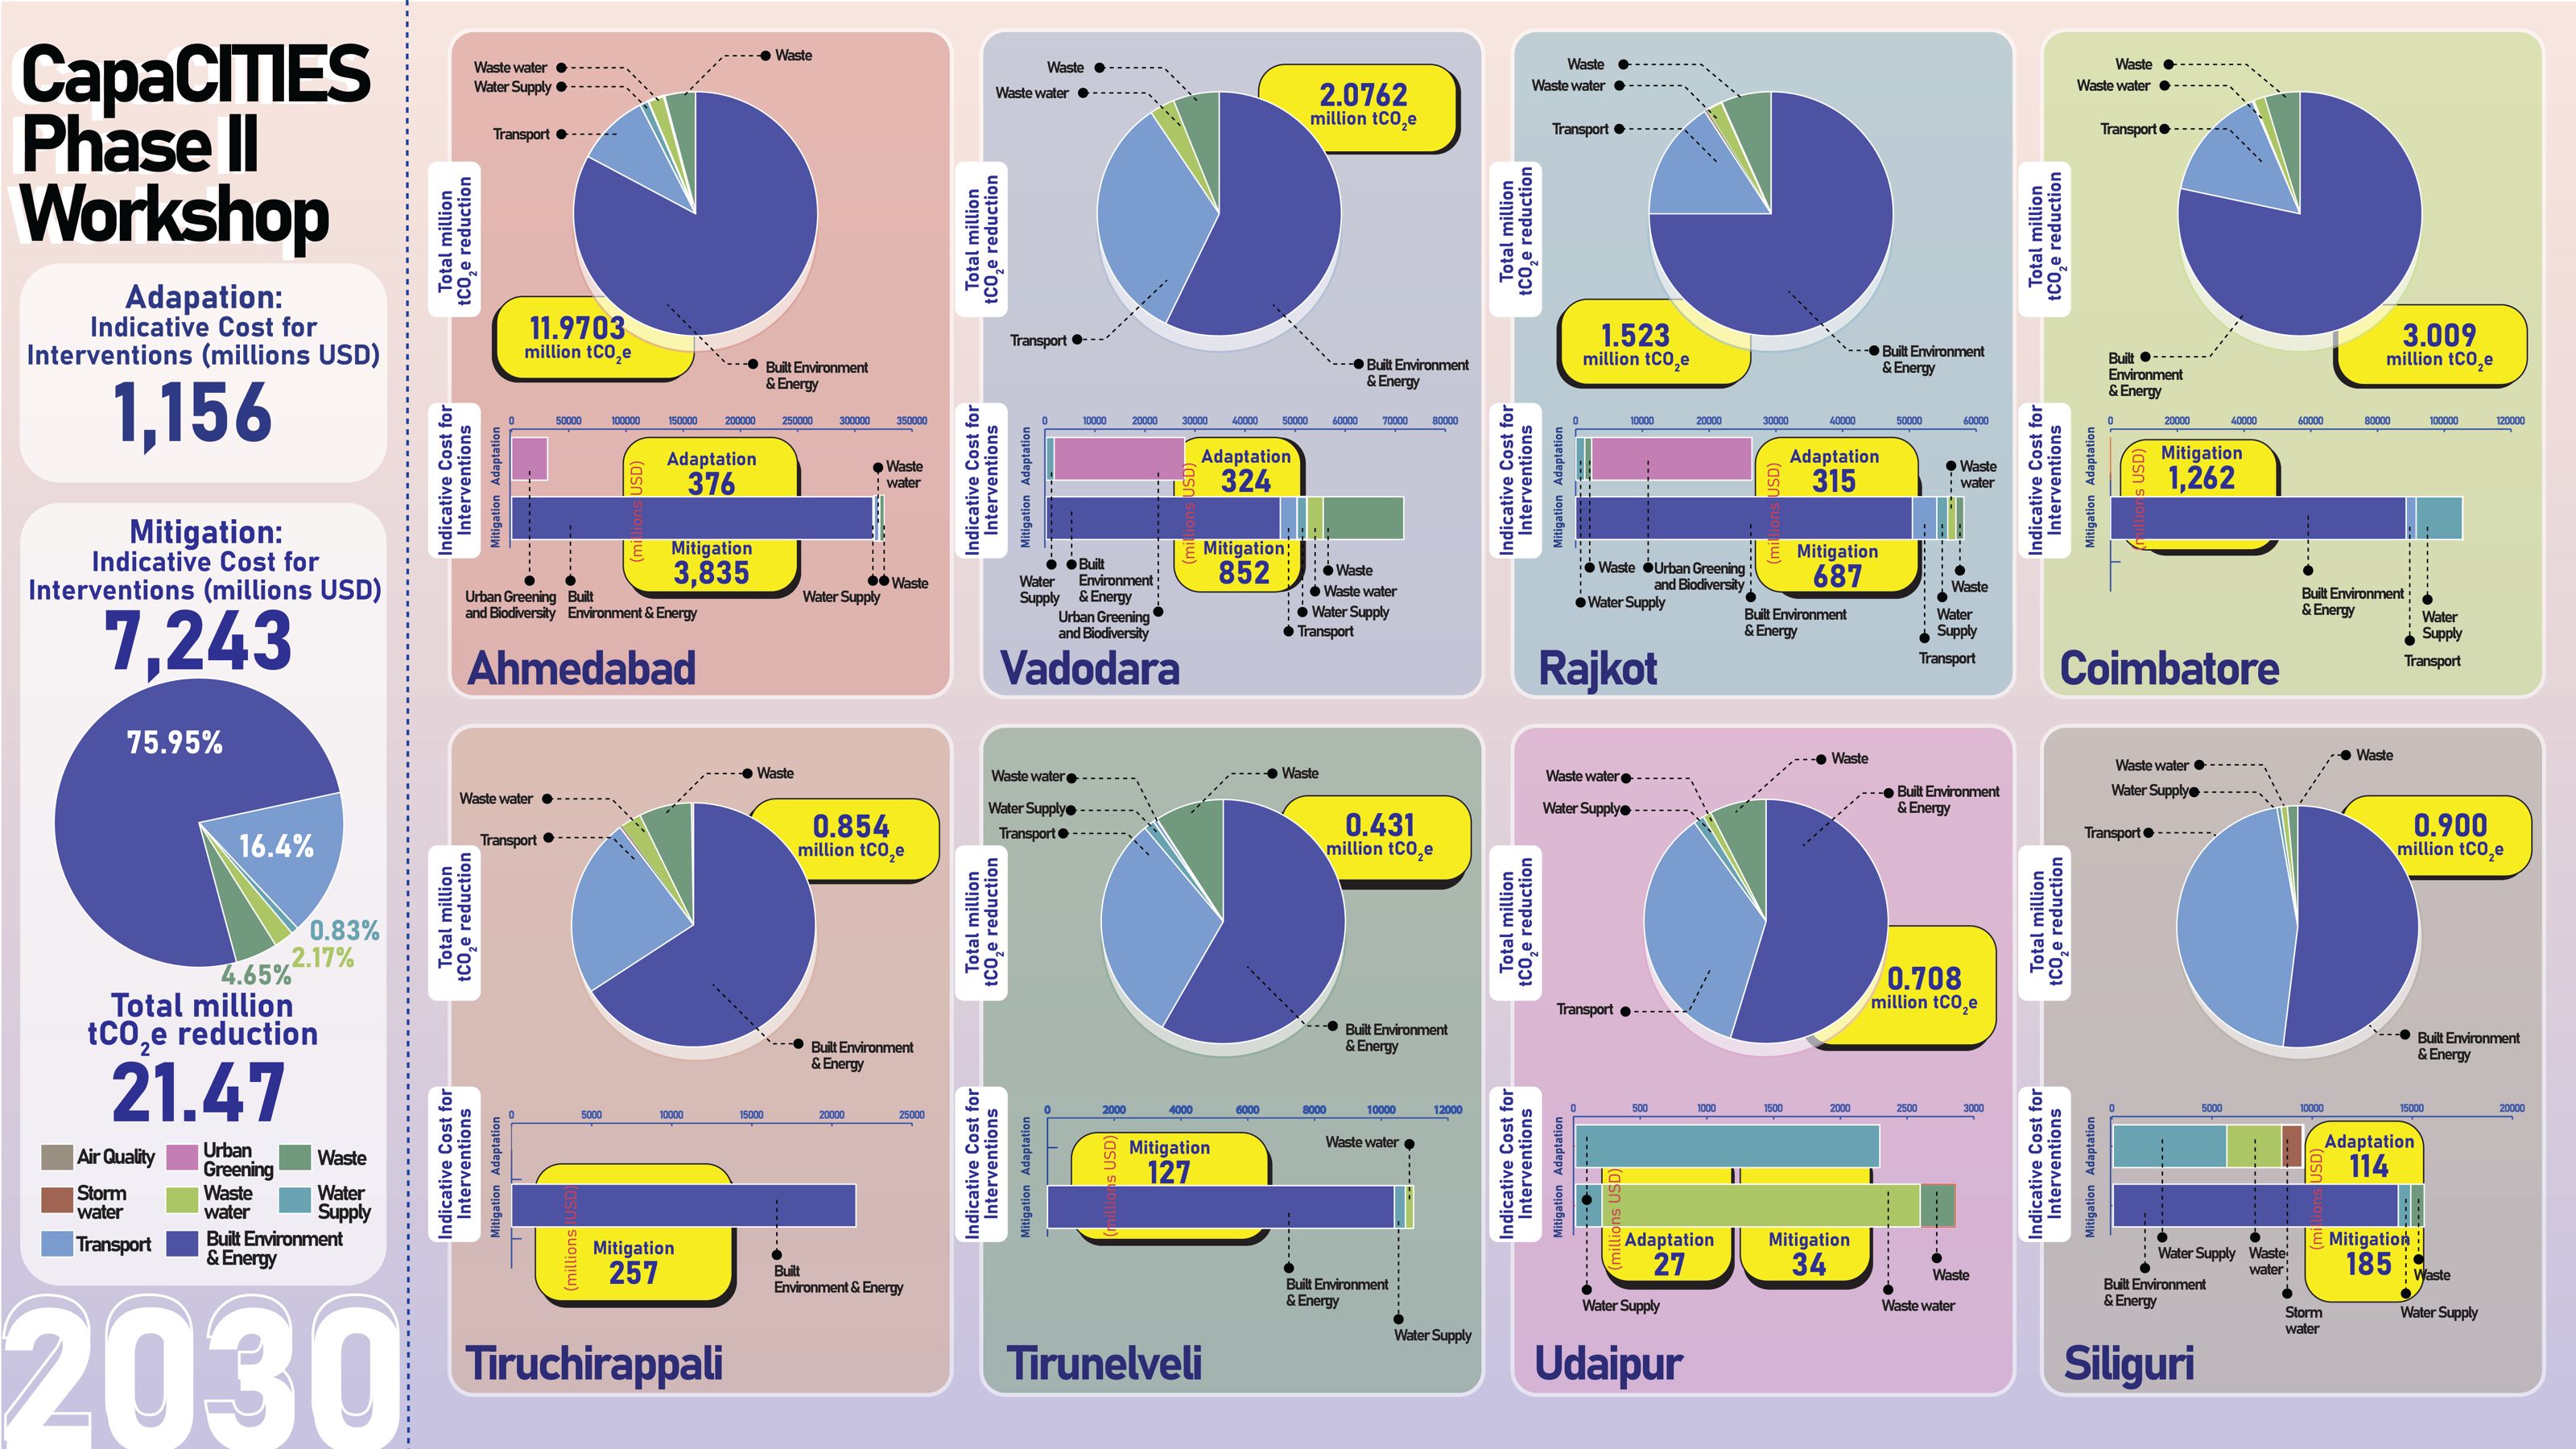
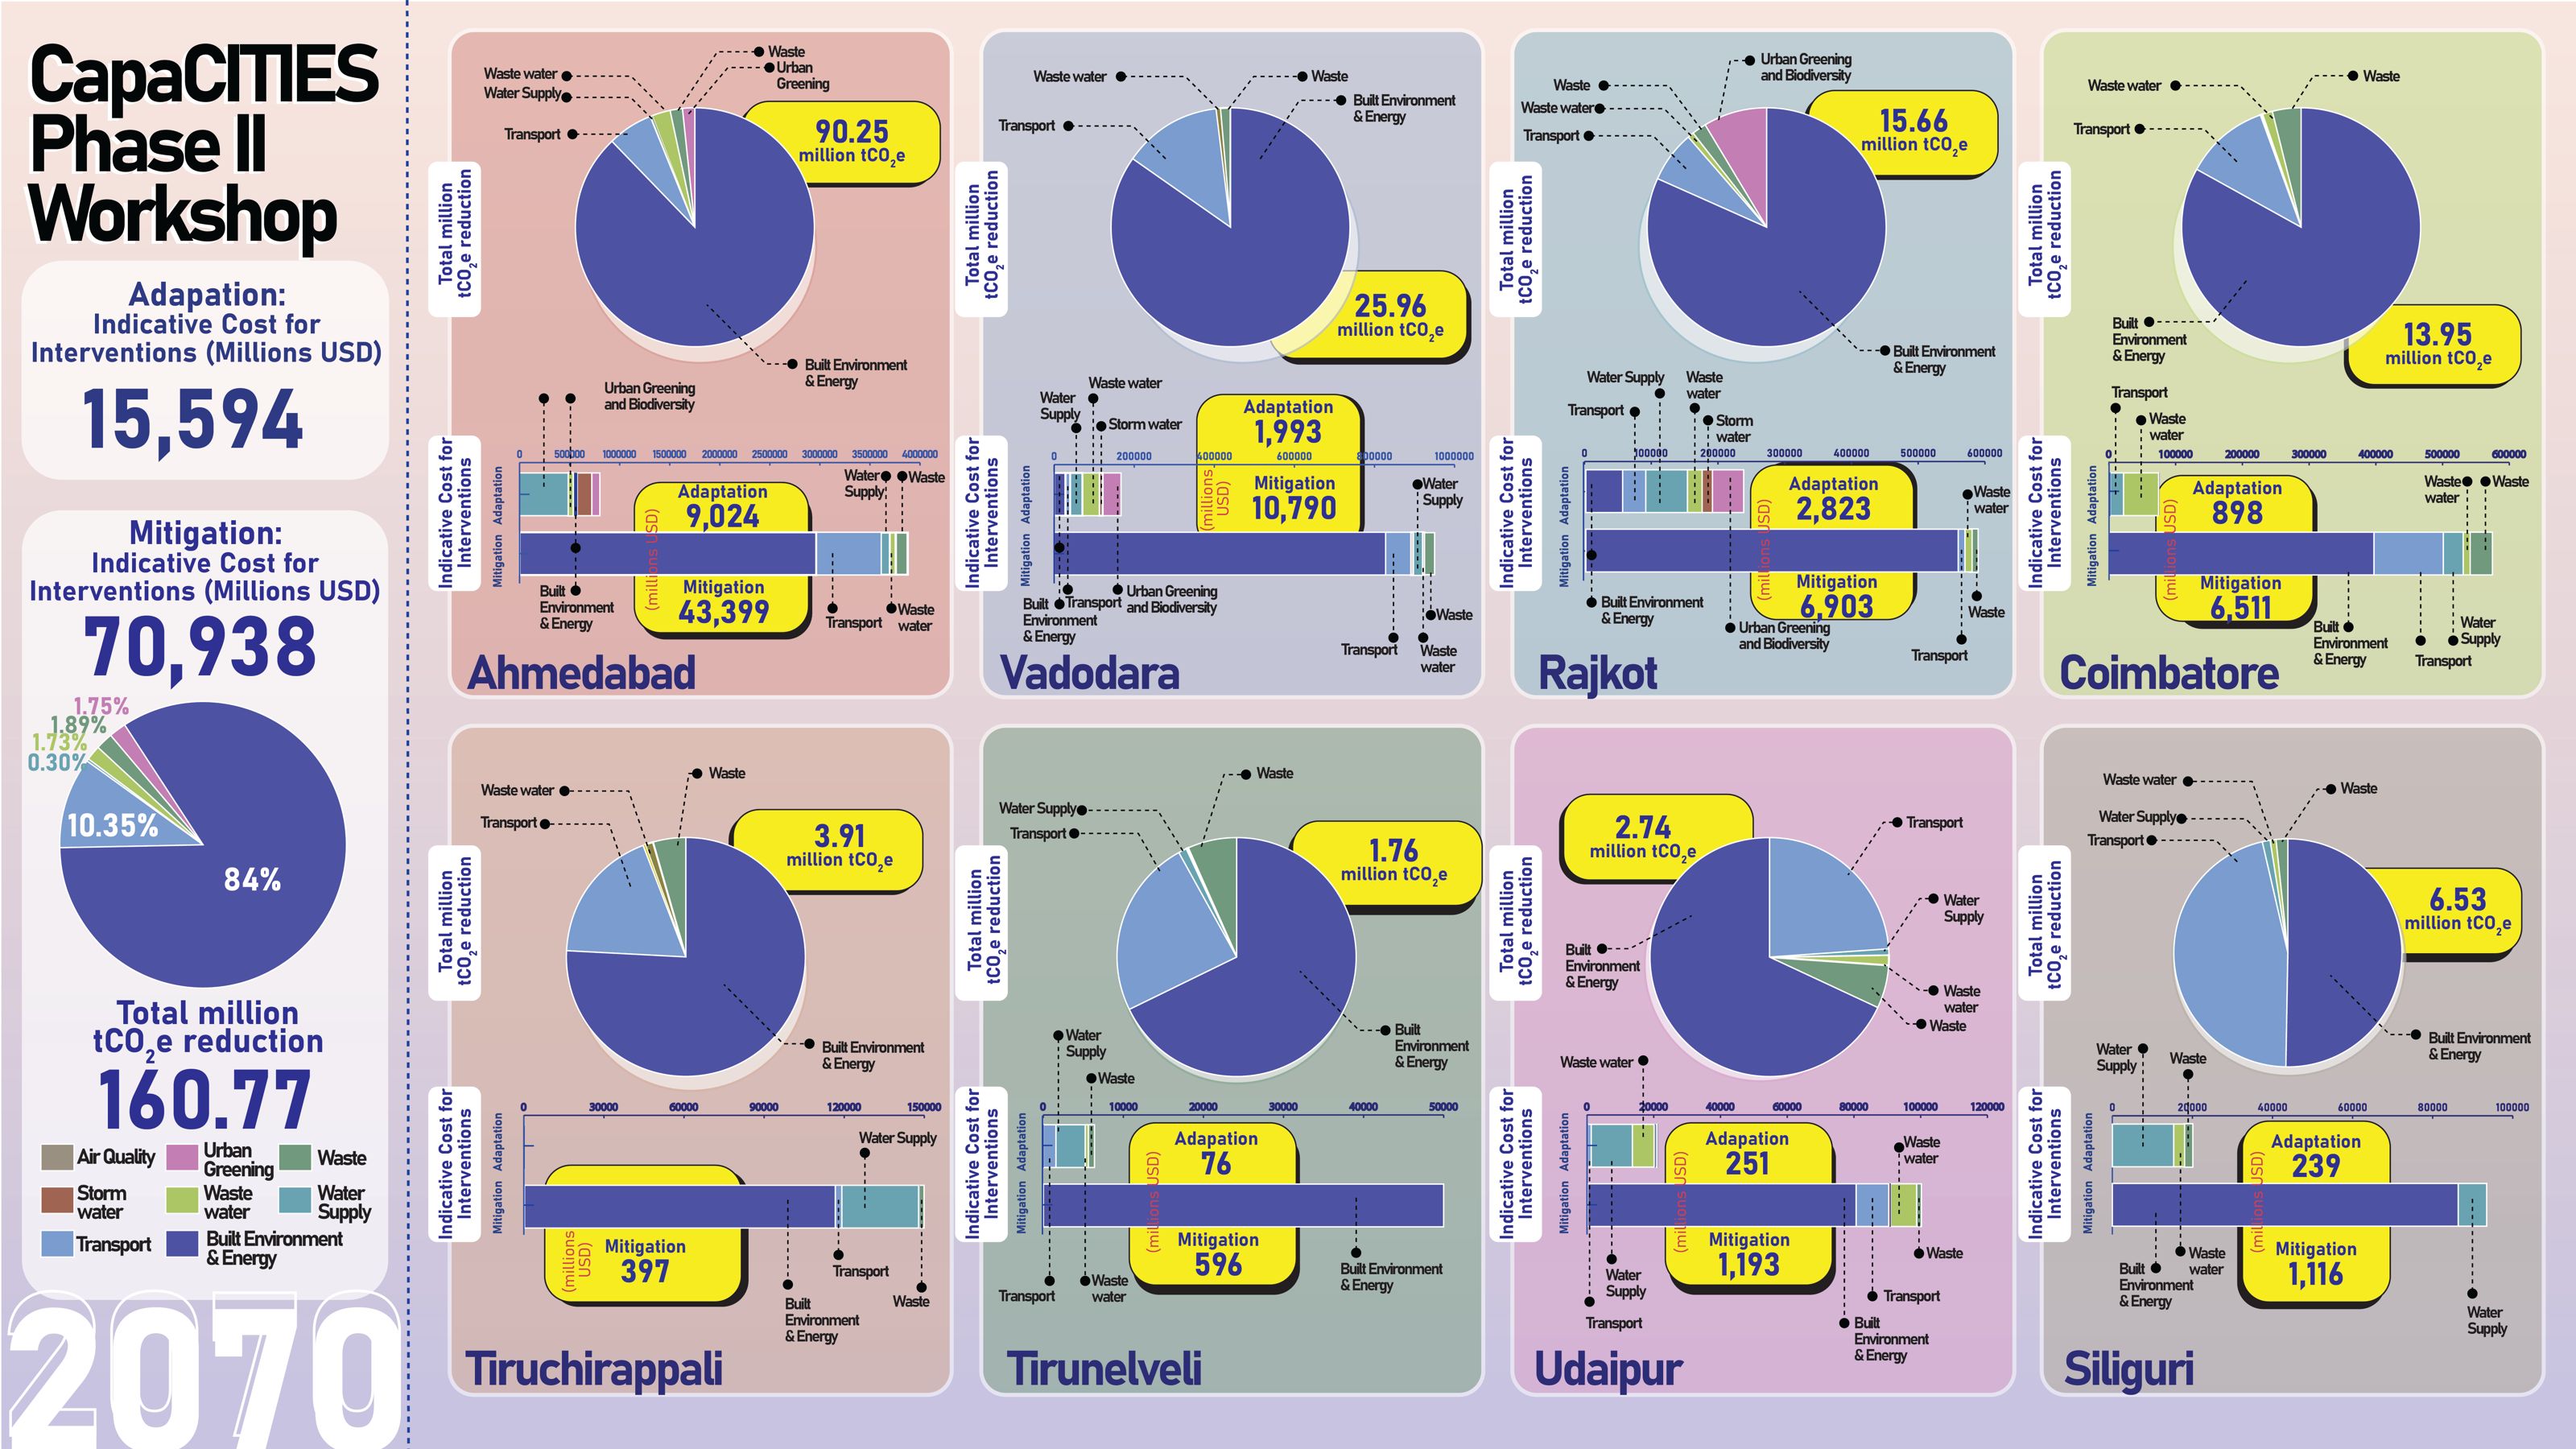
Reading the cities together was the first step; the second was putting a number on each. At the CapaCITIES Phase II workshop, eight of the fifteen (Ahmedabad, Vadodara, Rajkot, Coimbatore, Tiruchirappalli, Tirunelveli, Udaipur, Siliguri) costed their actions on the same sheet: the reduction each sector delivers, and the indicative cost of the interventions that deliver it, for 2030 and for net zero in 2070.
The two sheets are the same drawing at two scales, and the scale is the point. To 2030 the eight cities cut 21 million tonnes for 8.4 billion dollars; to 2070, 161 million tonnes for 87 billion. Almost all of it is buildings and energy. Adaptation is a seventh of the money in 2030 and a fifth in 2070: the bill for living with the climate grows faster than the bill for changing it. One template, eight cities, two horizons, and now with prices.