र.
(← selected work) (research question)

what does a city have to see about itself before it can promise net zero?

A city audited ward by ward, then given a pathway to net zero it could adopt.

Vadodara's Climate Resilient City Action Plan is the second of the CapaCities plans: a ward-level audit of how the city works and where it breaks, a greenhouse-gas inventory that puts a number on it, and a pathway from that number to net zero by 2070. Published by the Vadodara Municipal Corporation with the Government of Gujarat under CapaCities (SDC), with ICLEI South Asia, South Pole, econcept and NIUA. I co-authored the sector strategies and designed the book.

(role)
co-author · sector strategies · book design
(period)
2023–2024
(context)
vadodara · capacities · iclei south asia
(status)
published · august 2024
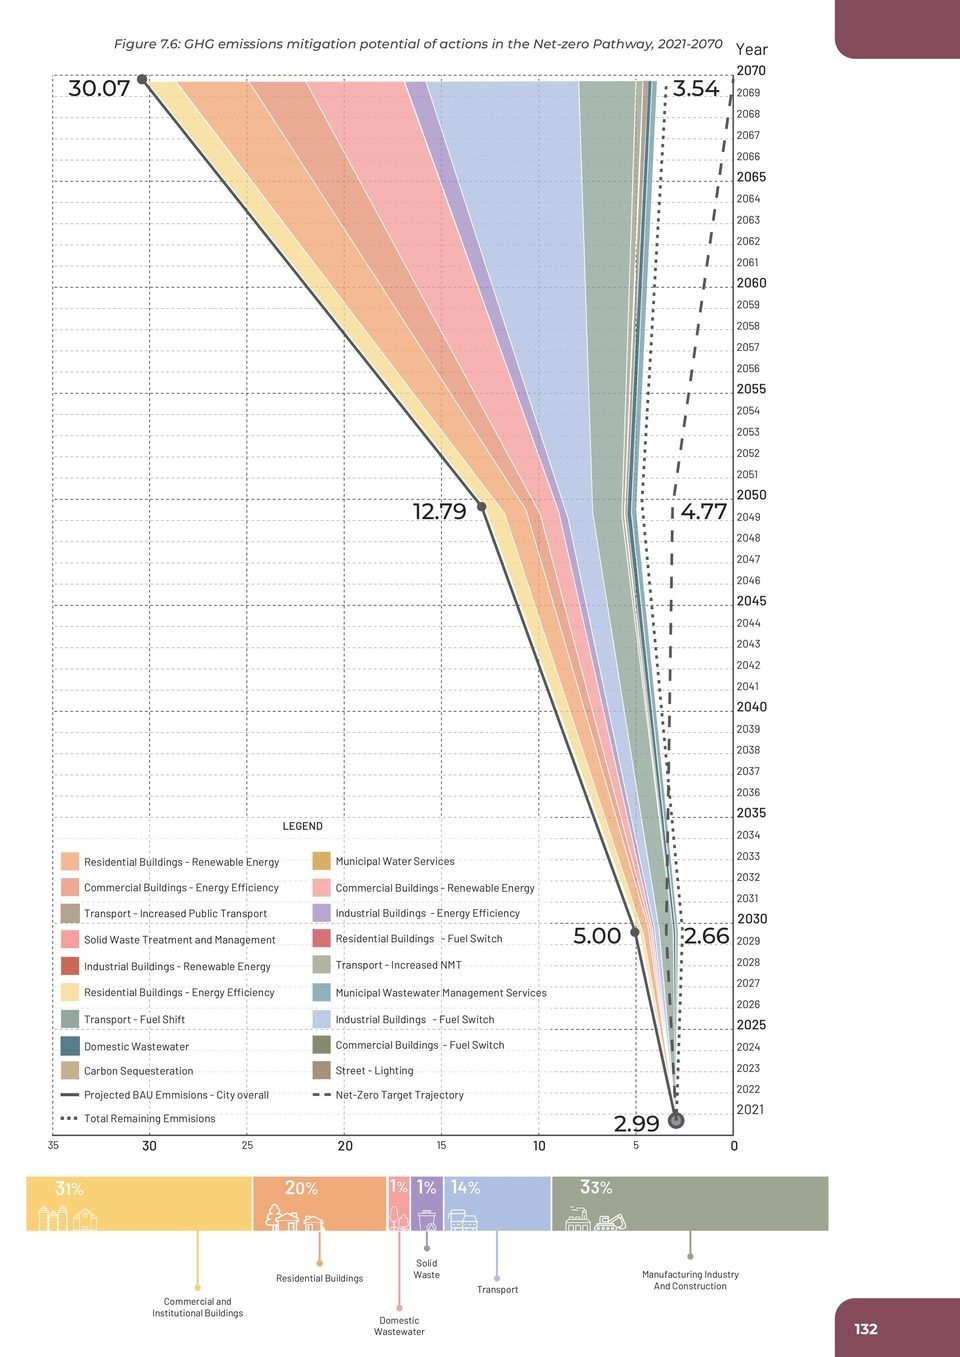
The net-zero pathway. Annual emissions 2021 to 2070, business-as-usual rising to 30 million tonnes, each mitigation action peeled away by sector until the remaining line meets the target trajectory: 88.2% below BAU in 2070.
fig.01The net-zero pathway. Annual emissions 2021 to 2070, business-as-usual rising to 30 million tonnes, each mitigation action peeled away by sector until the remaining line meets the target trajectory: 88.2% below BAU in 2070.
(00) the city

One municipality, 2021–22

A climate action plan is only as good as the picture of the city it starts from. This one starts from a single municipality in a single year, Vadodara, 2021–22, a city of two and a half million on the Vishwamitri, with a development plan already in force and a set of utilities that keep it running. The plan is written for the people who run those things, in the units they use.
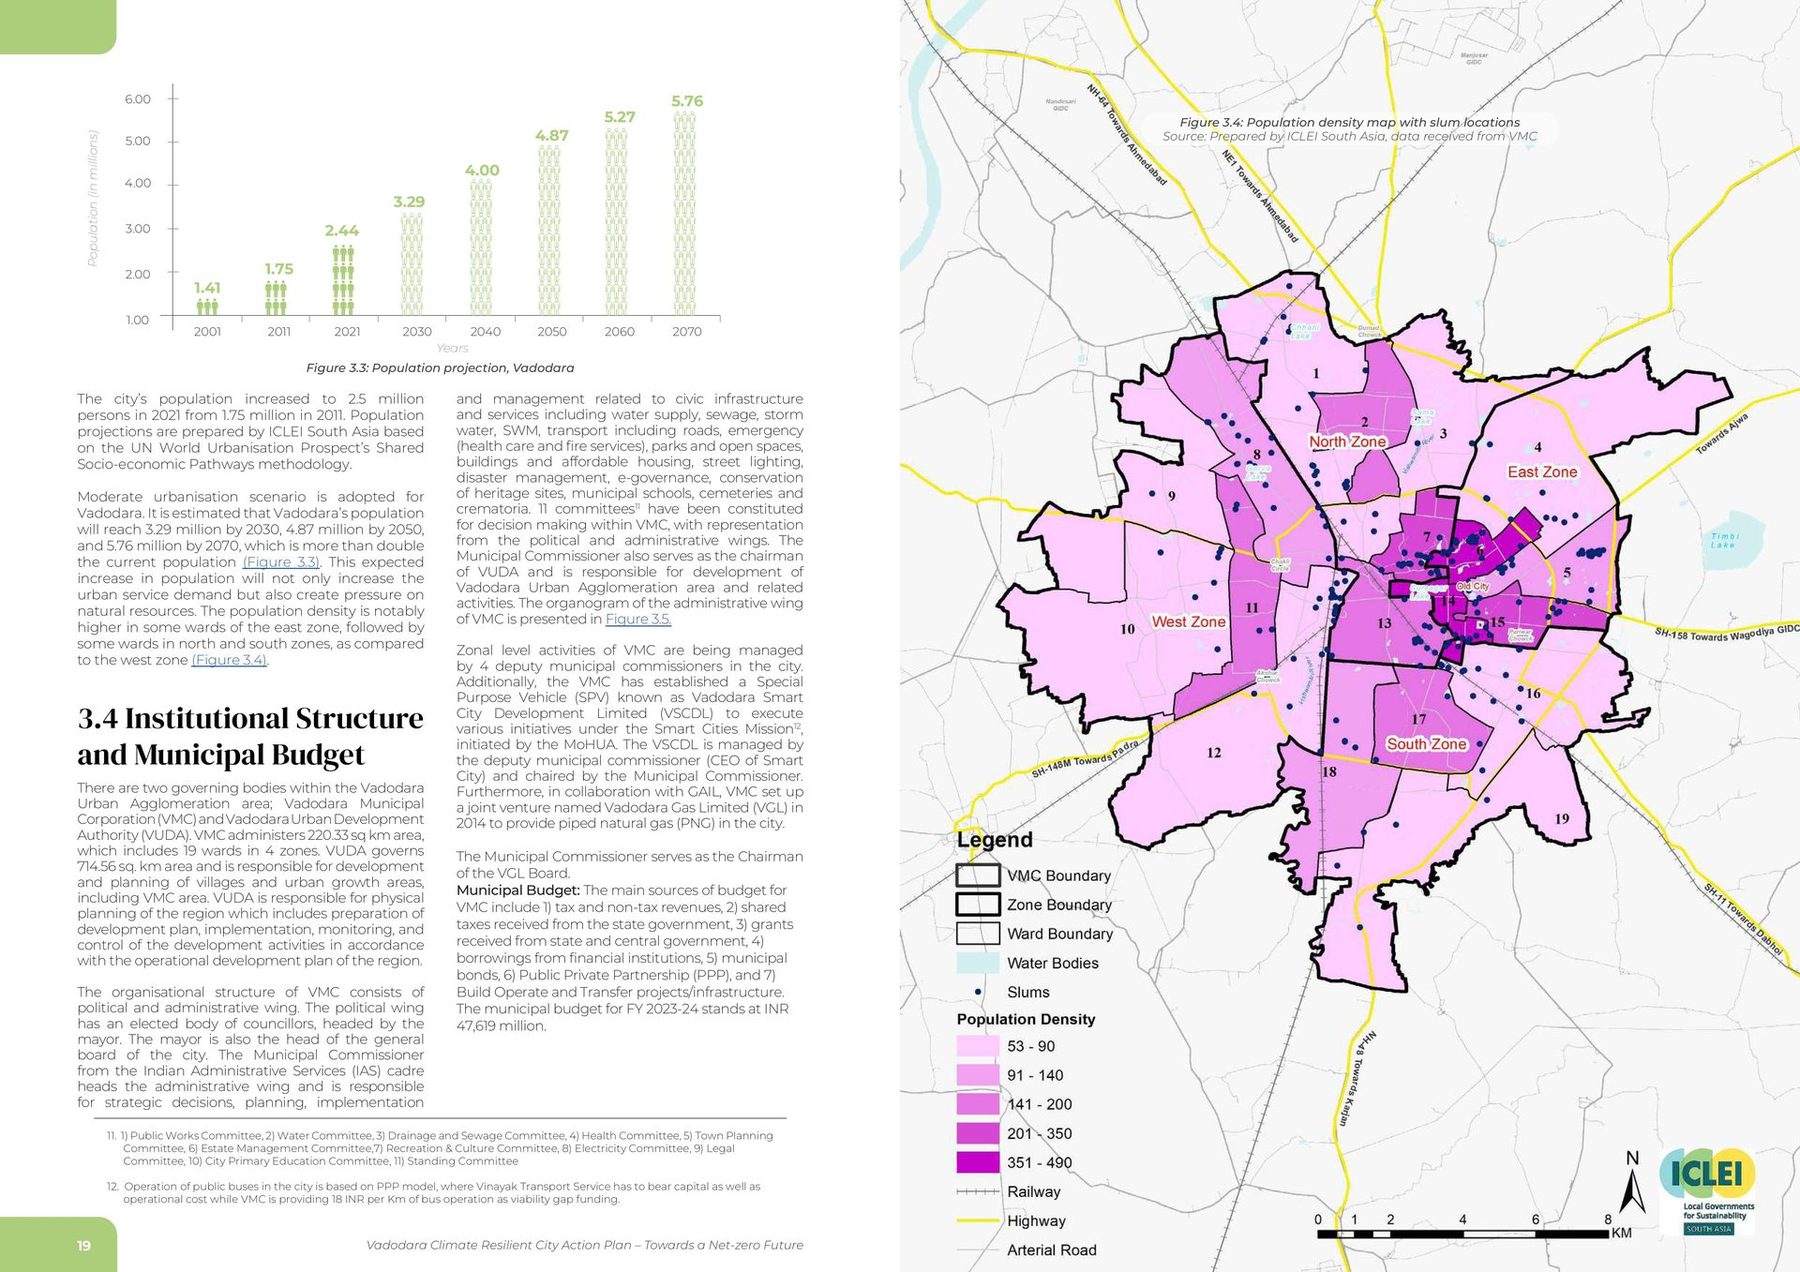
Demography. The city by ward, and the population the plan is written for.
fig.02Demography. The city by ward, and the population the plan is written for.
The development plan the city already has. VUDA's plan, and the region the climate plan sits inside.
fig.03The development plan the city already has. VUDA's plan, and the region the climate plan sits inside.
(01) the atlas

The city, drawn one layer at a time

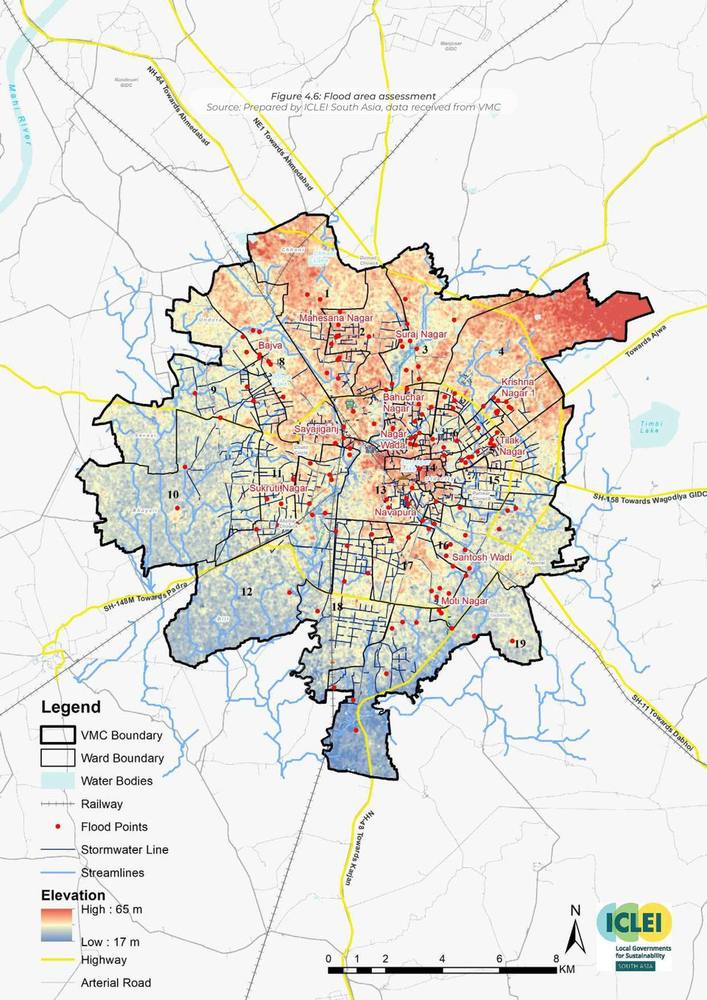
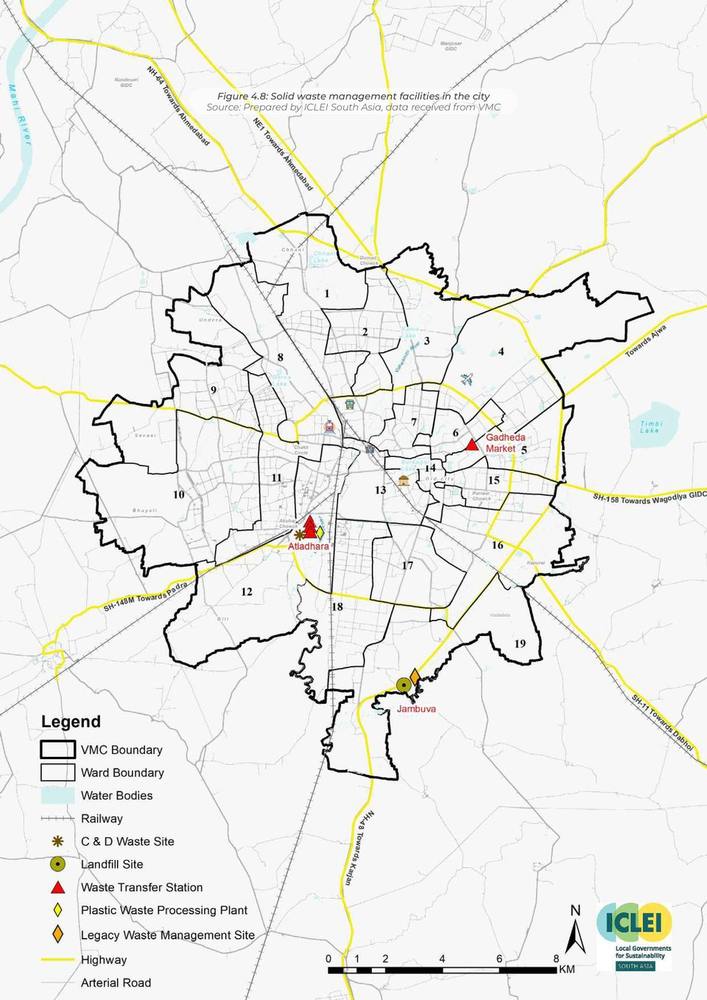
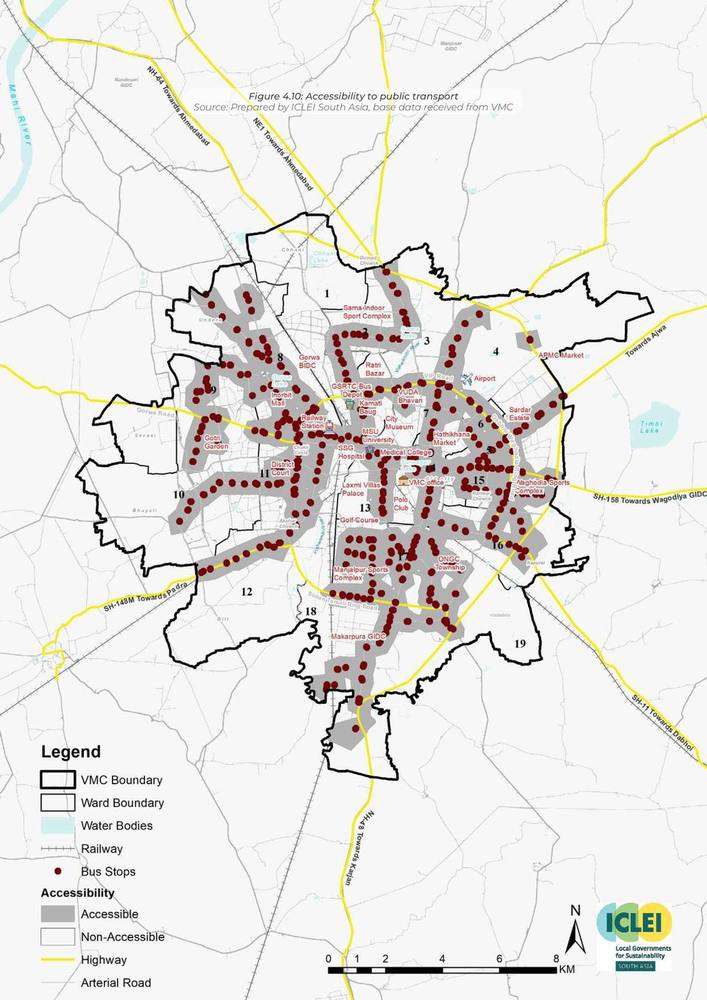
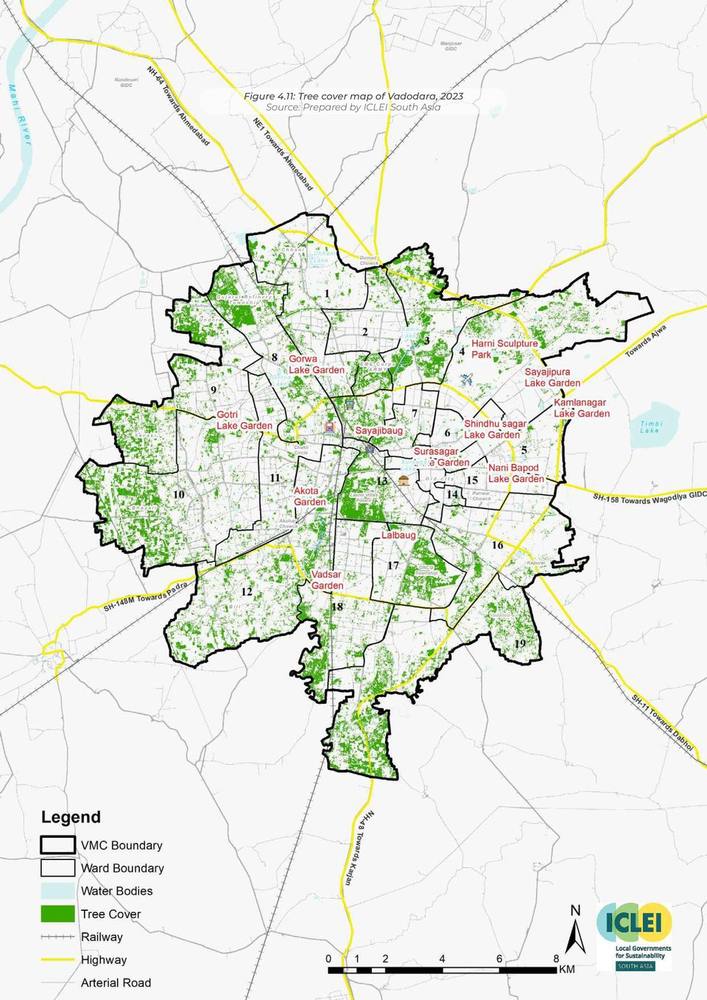
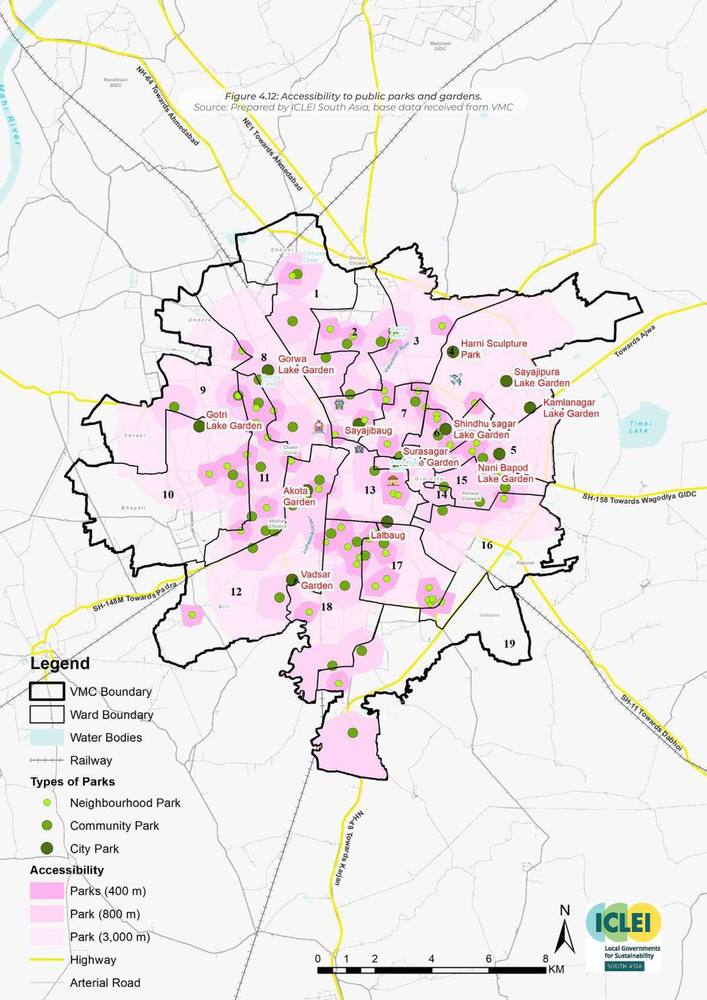
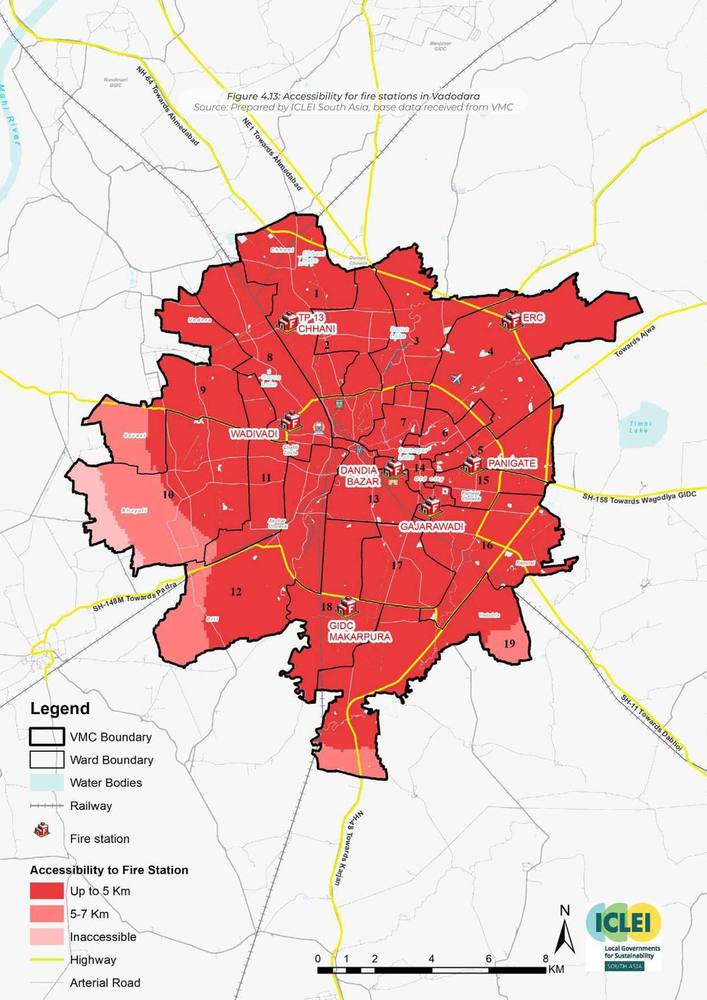
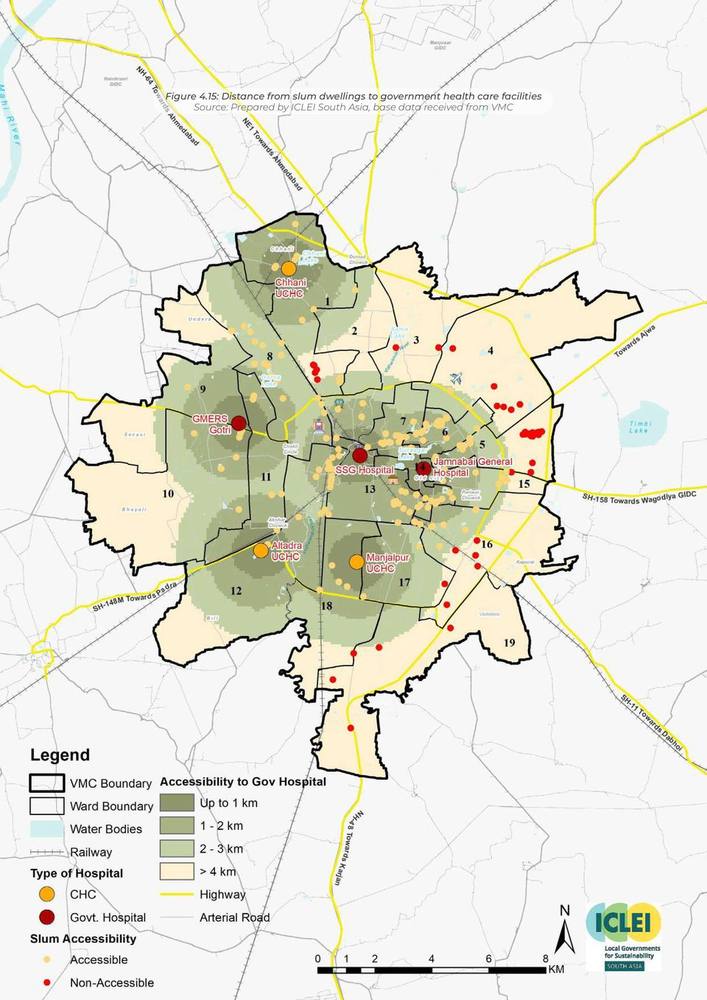
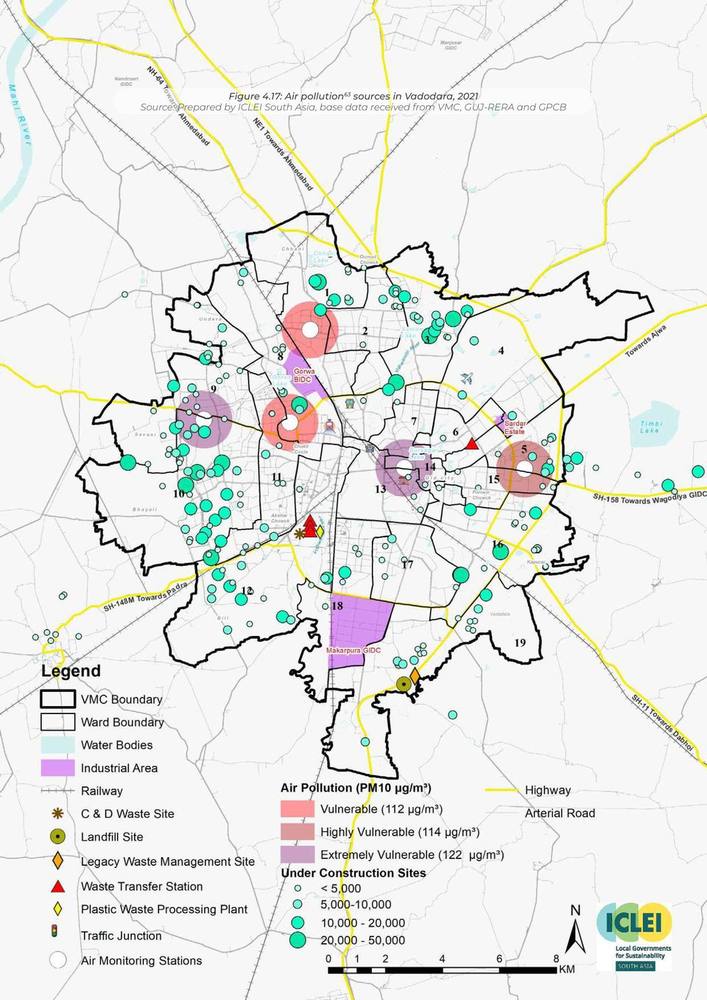
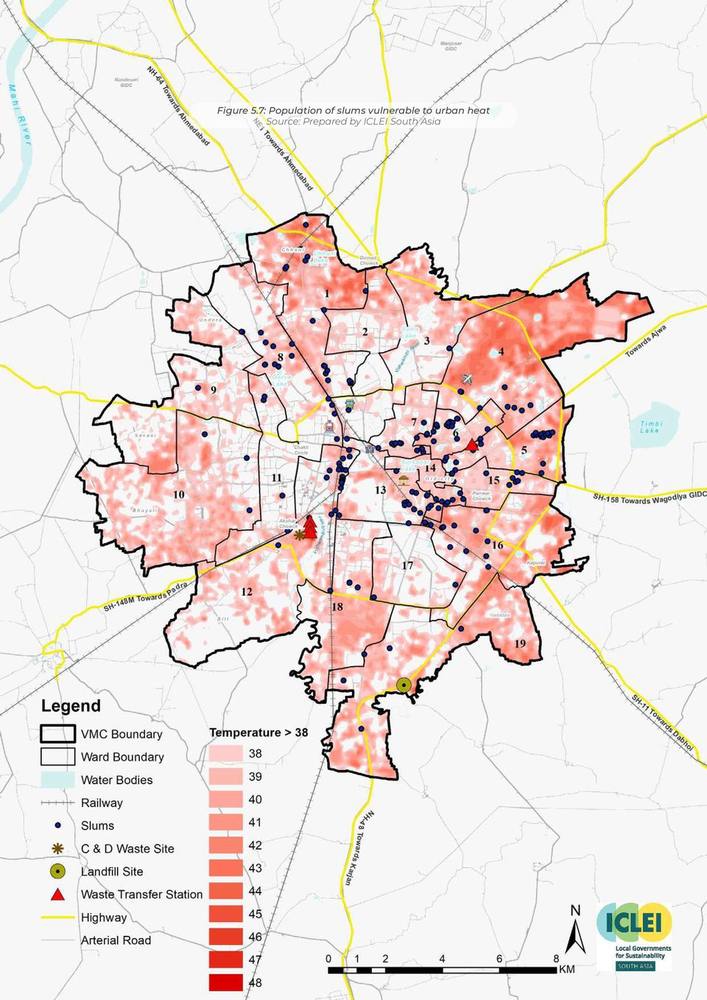
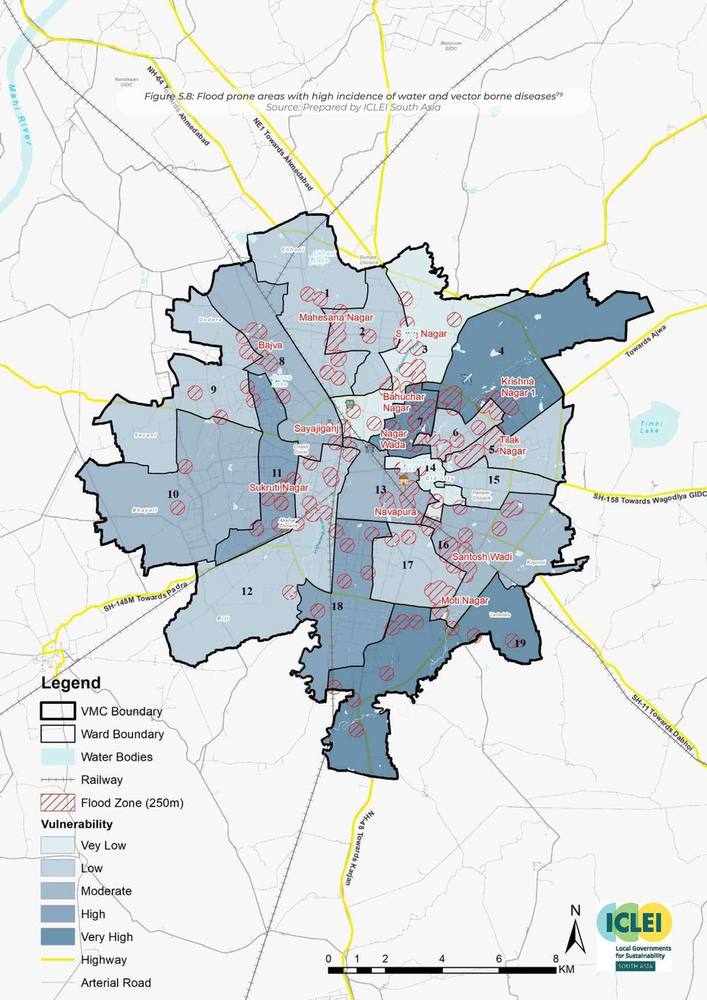
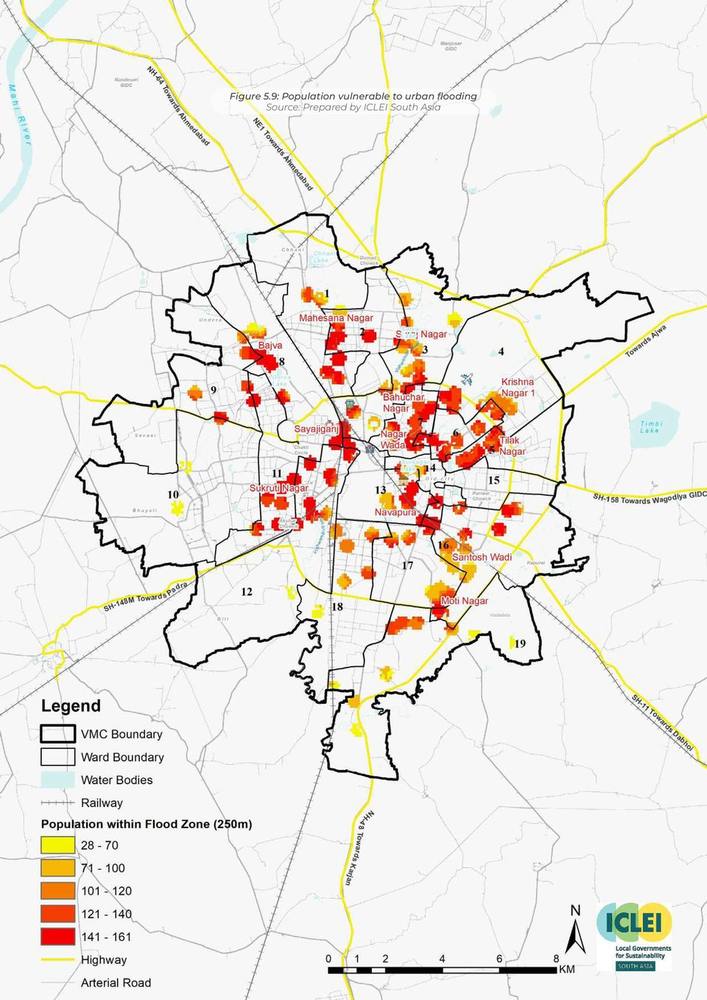
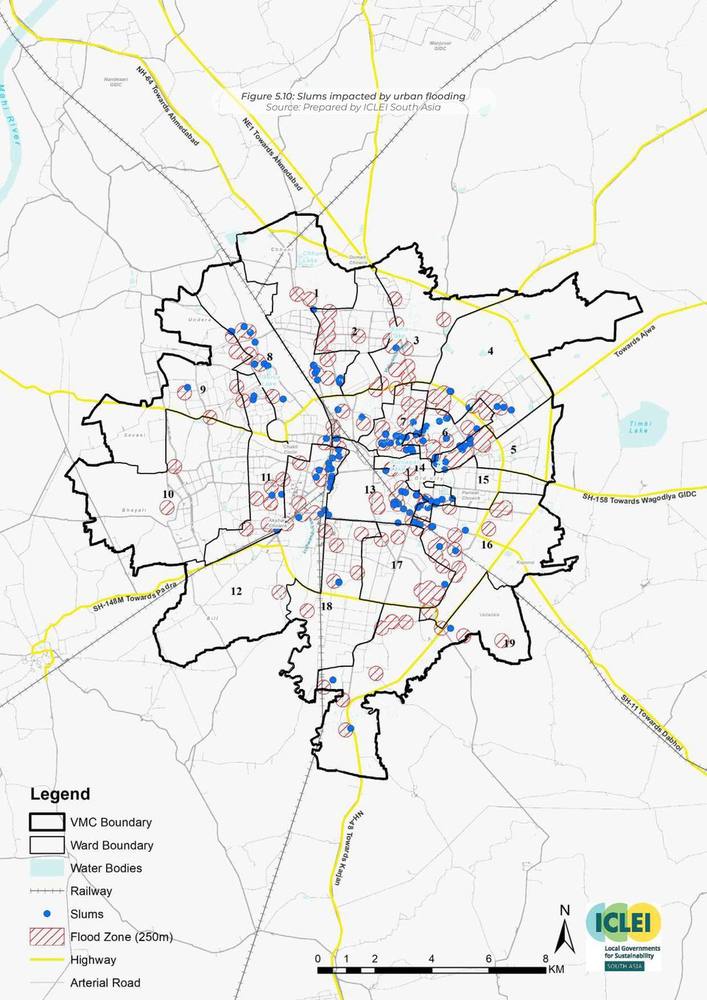
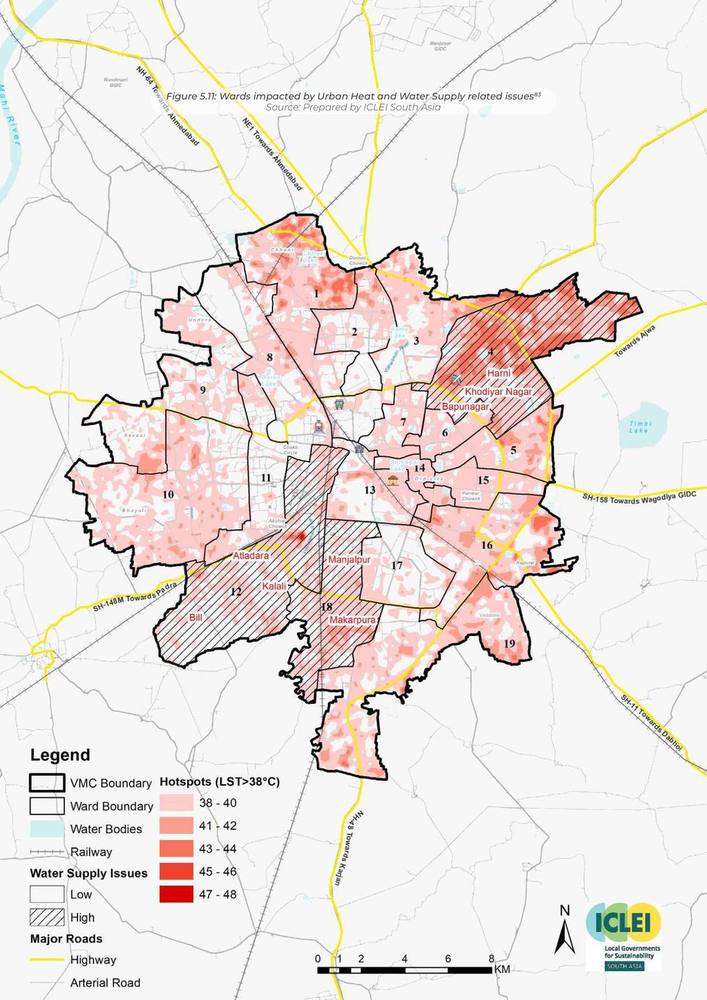
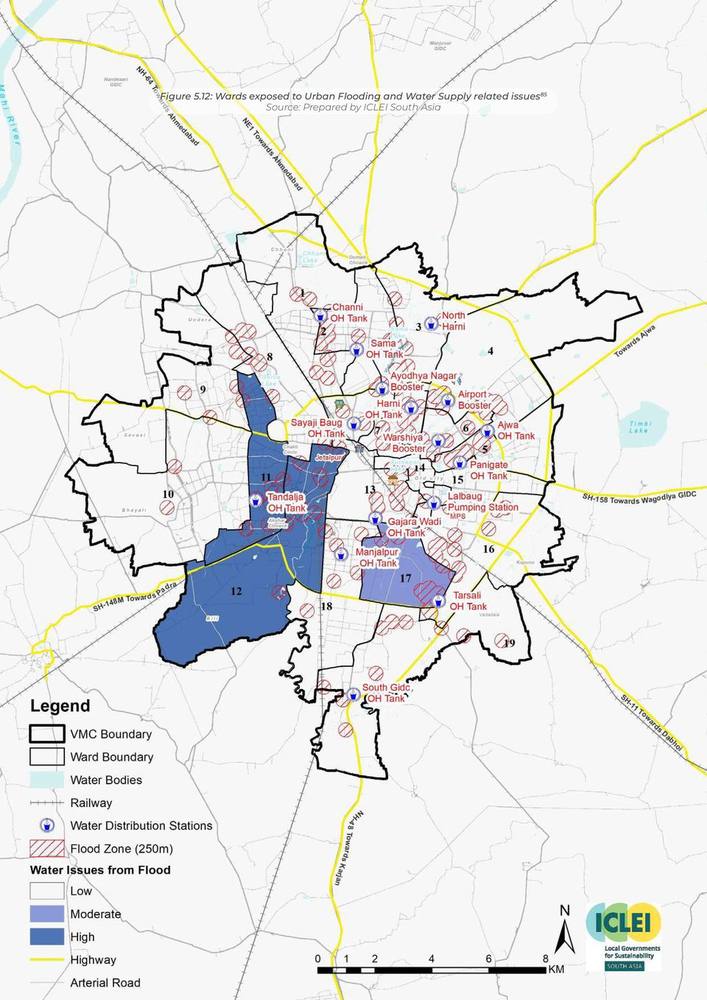
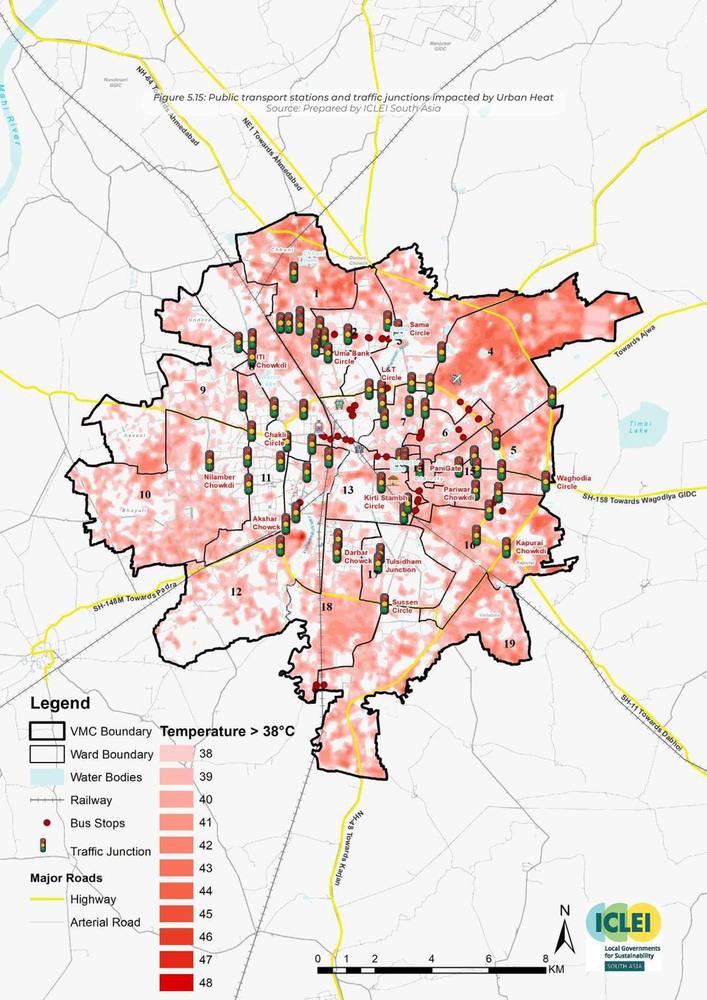
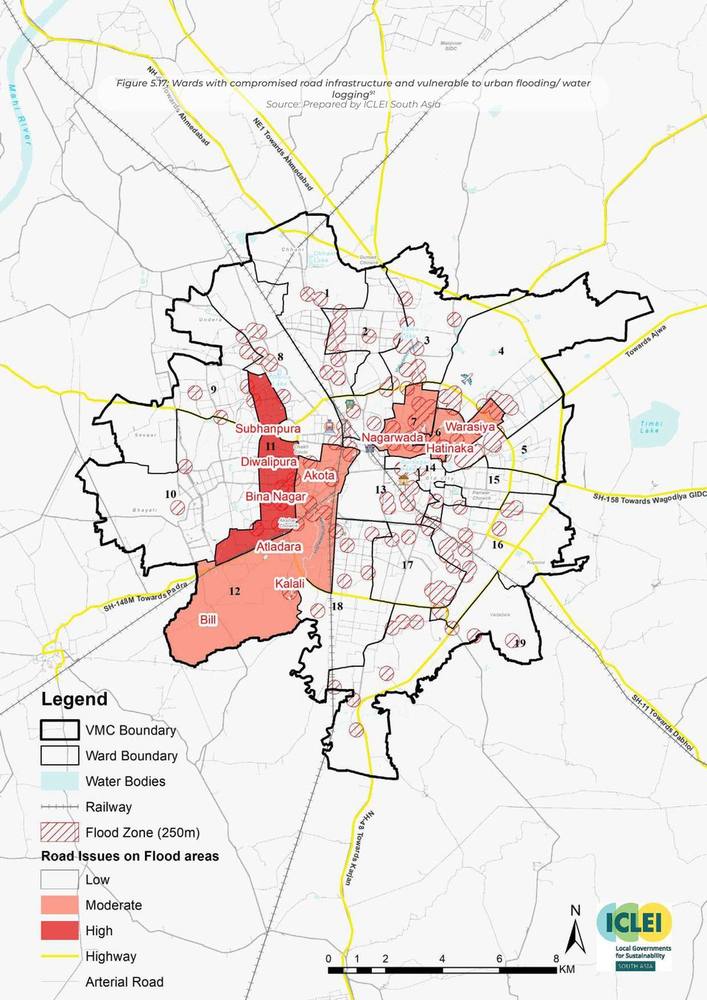
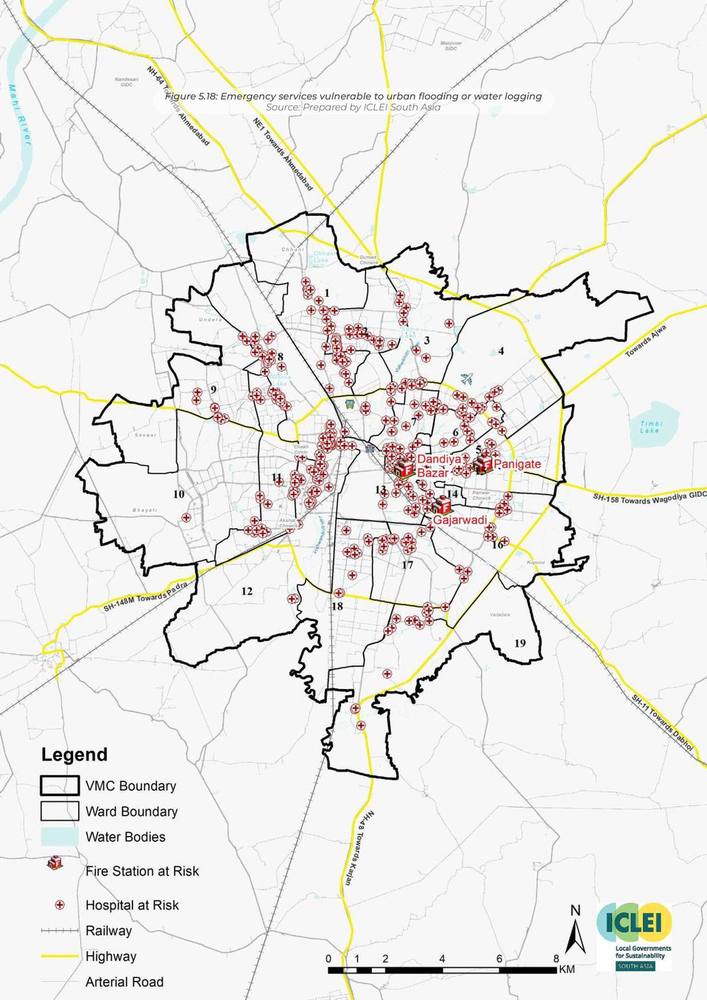
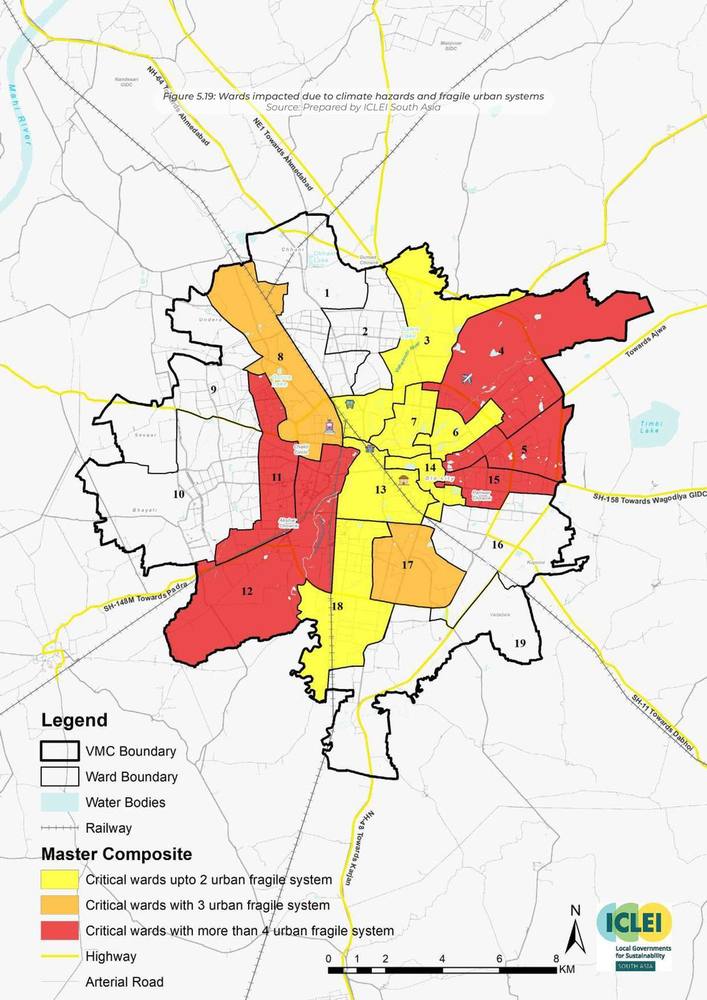
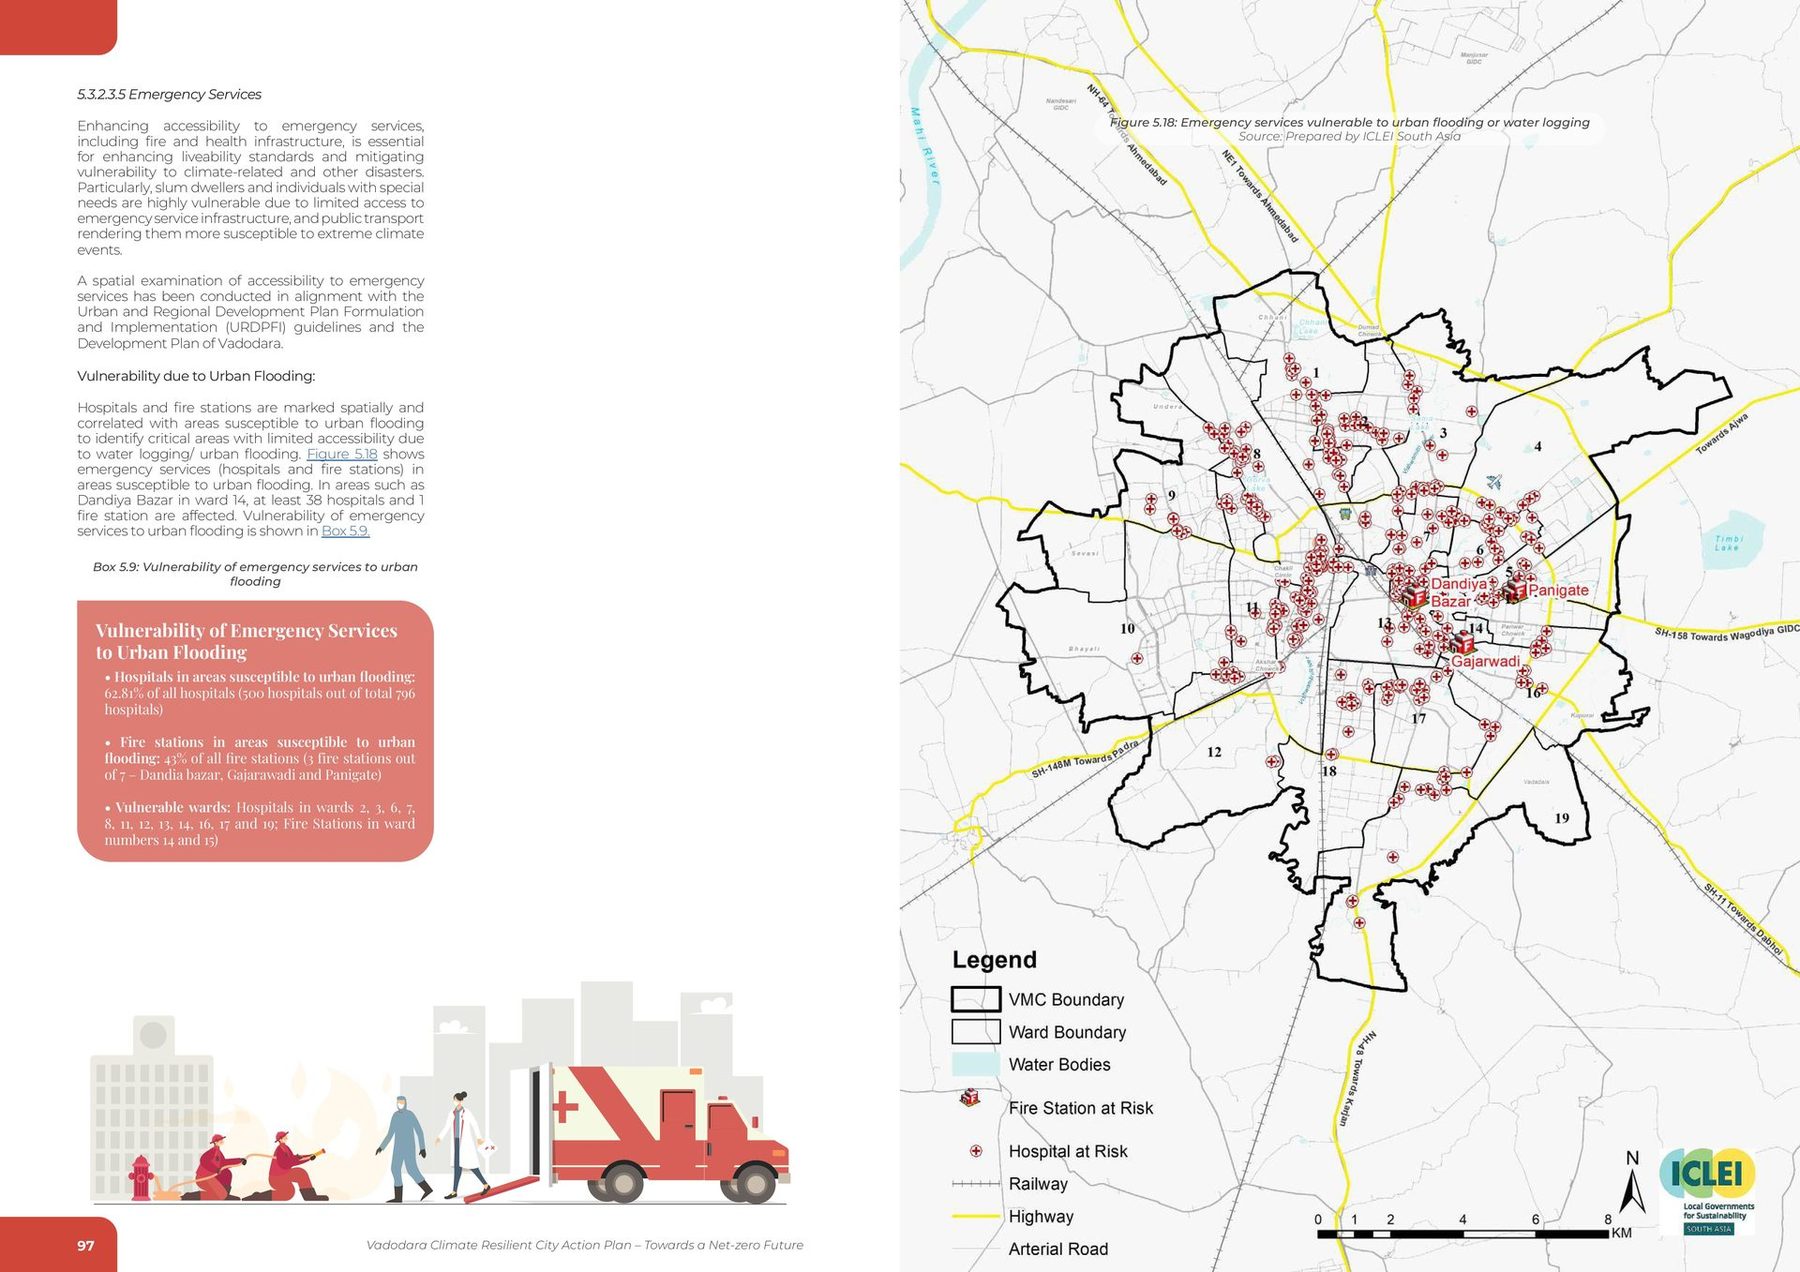
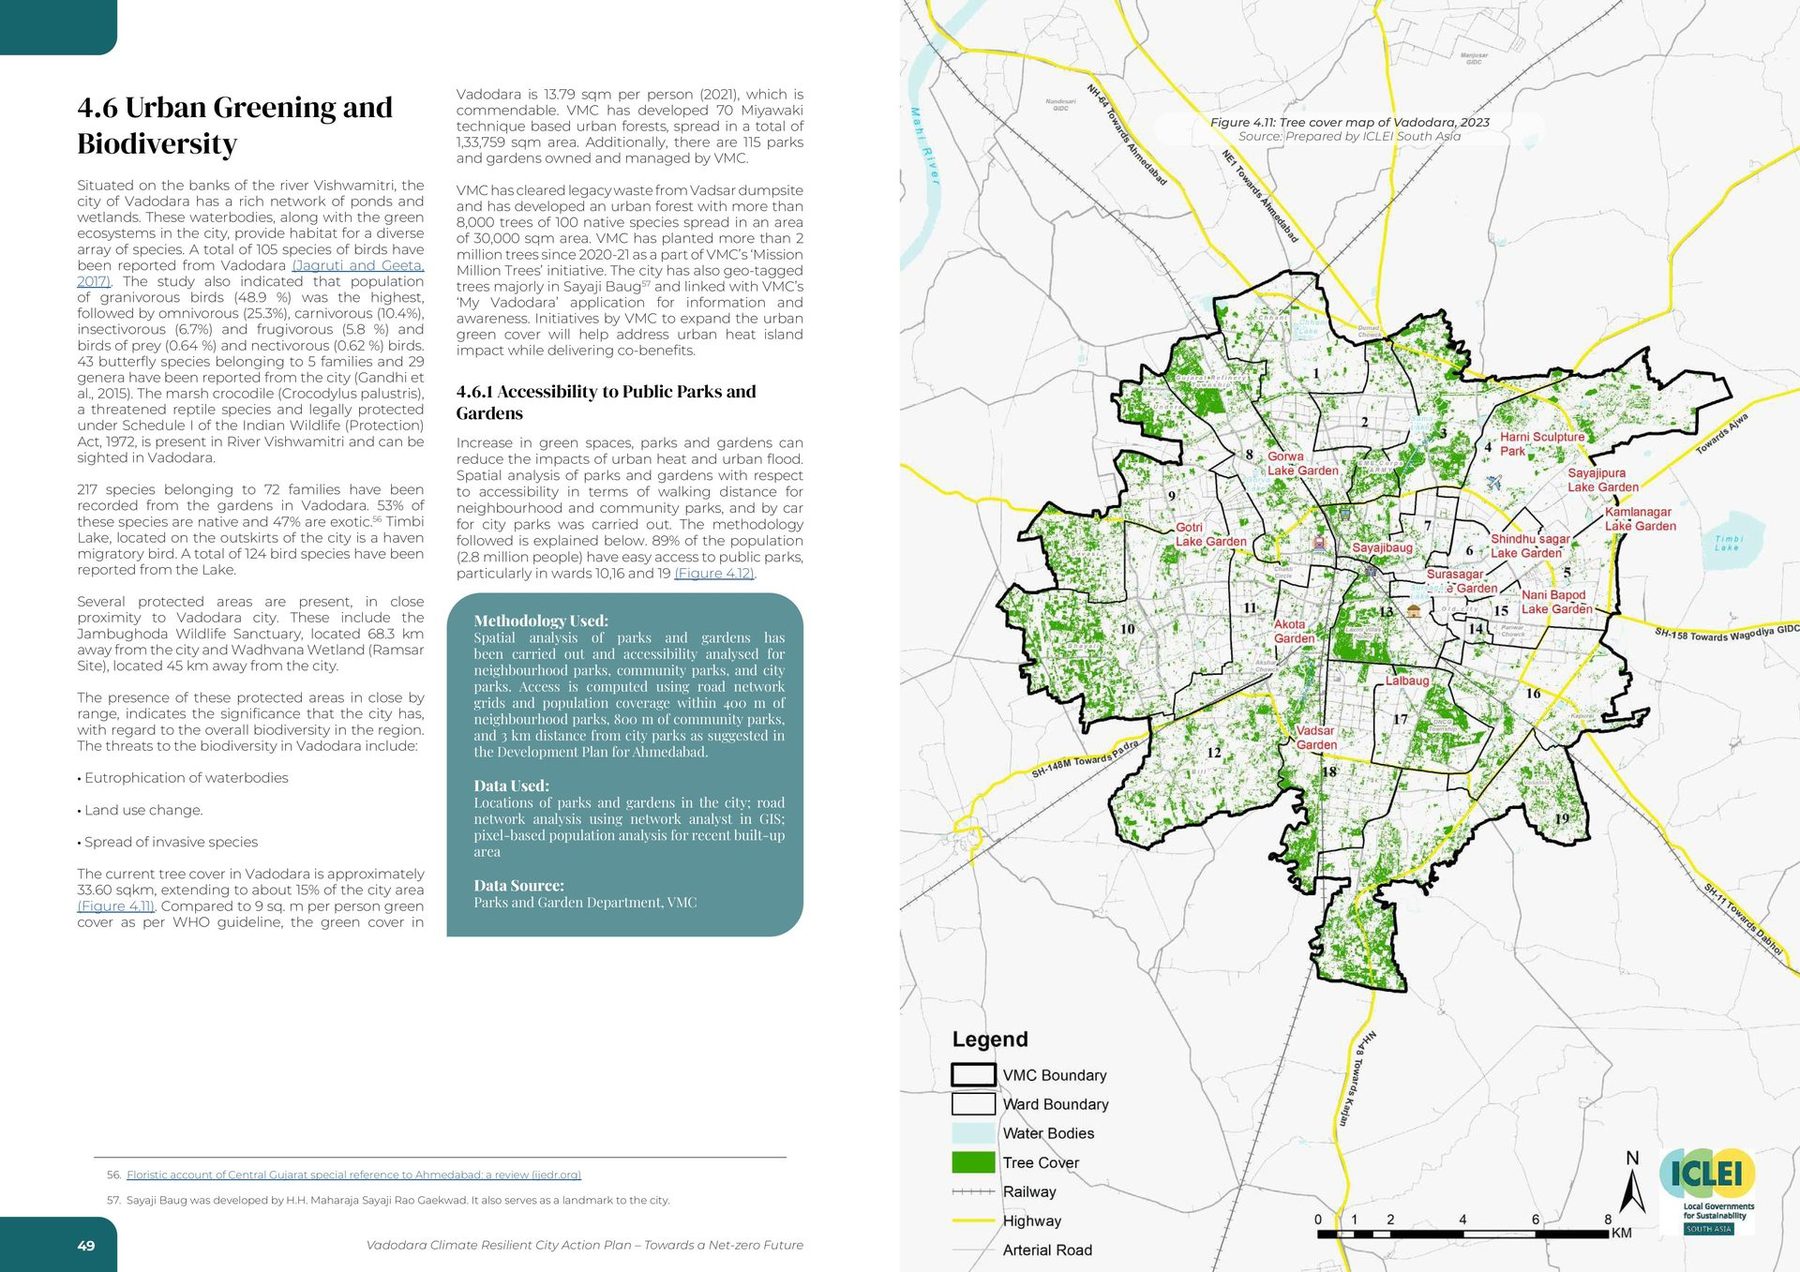
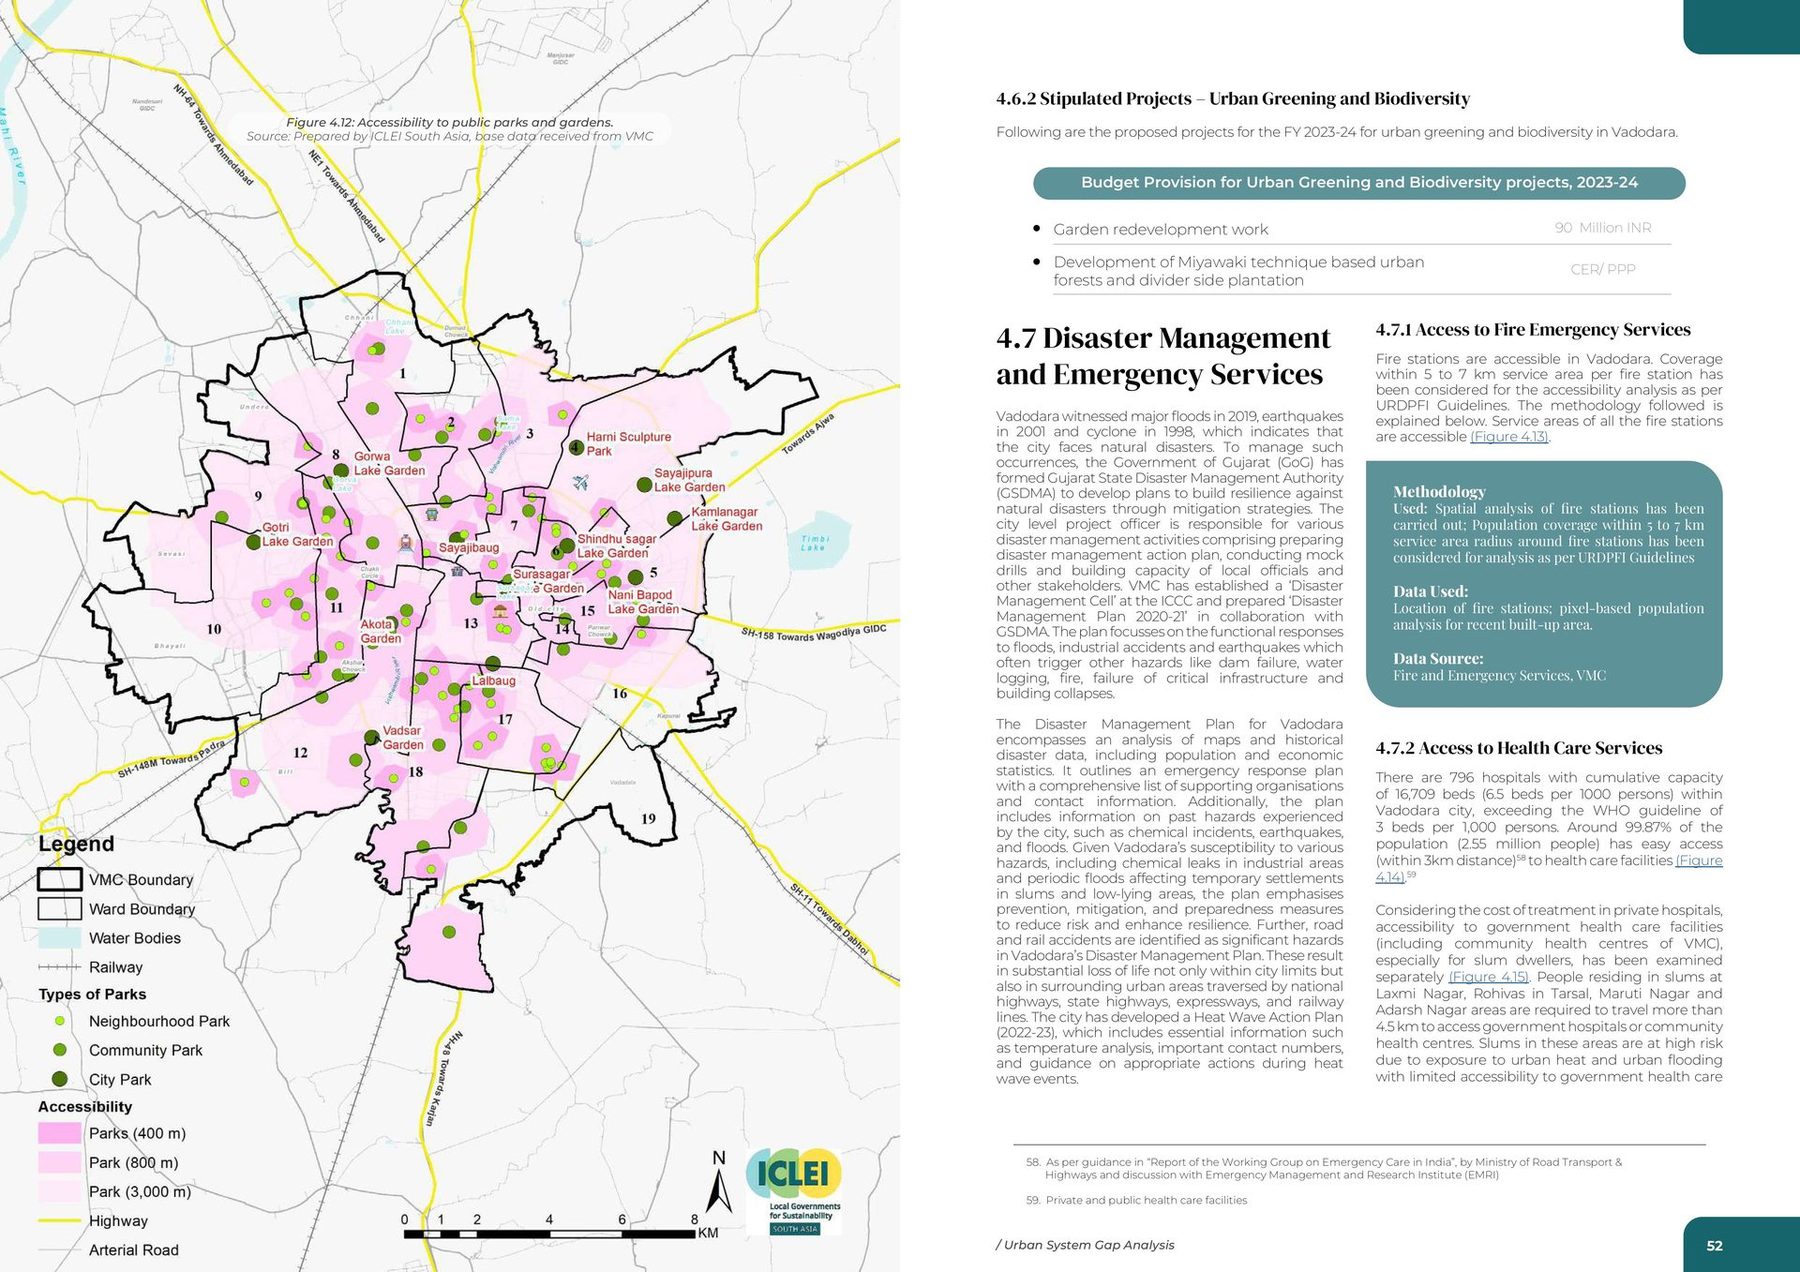
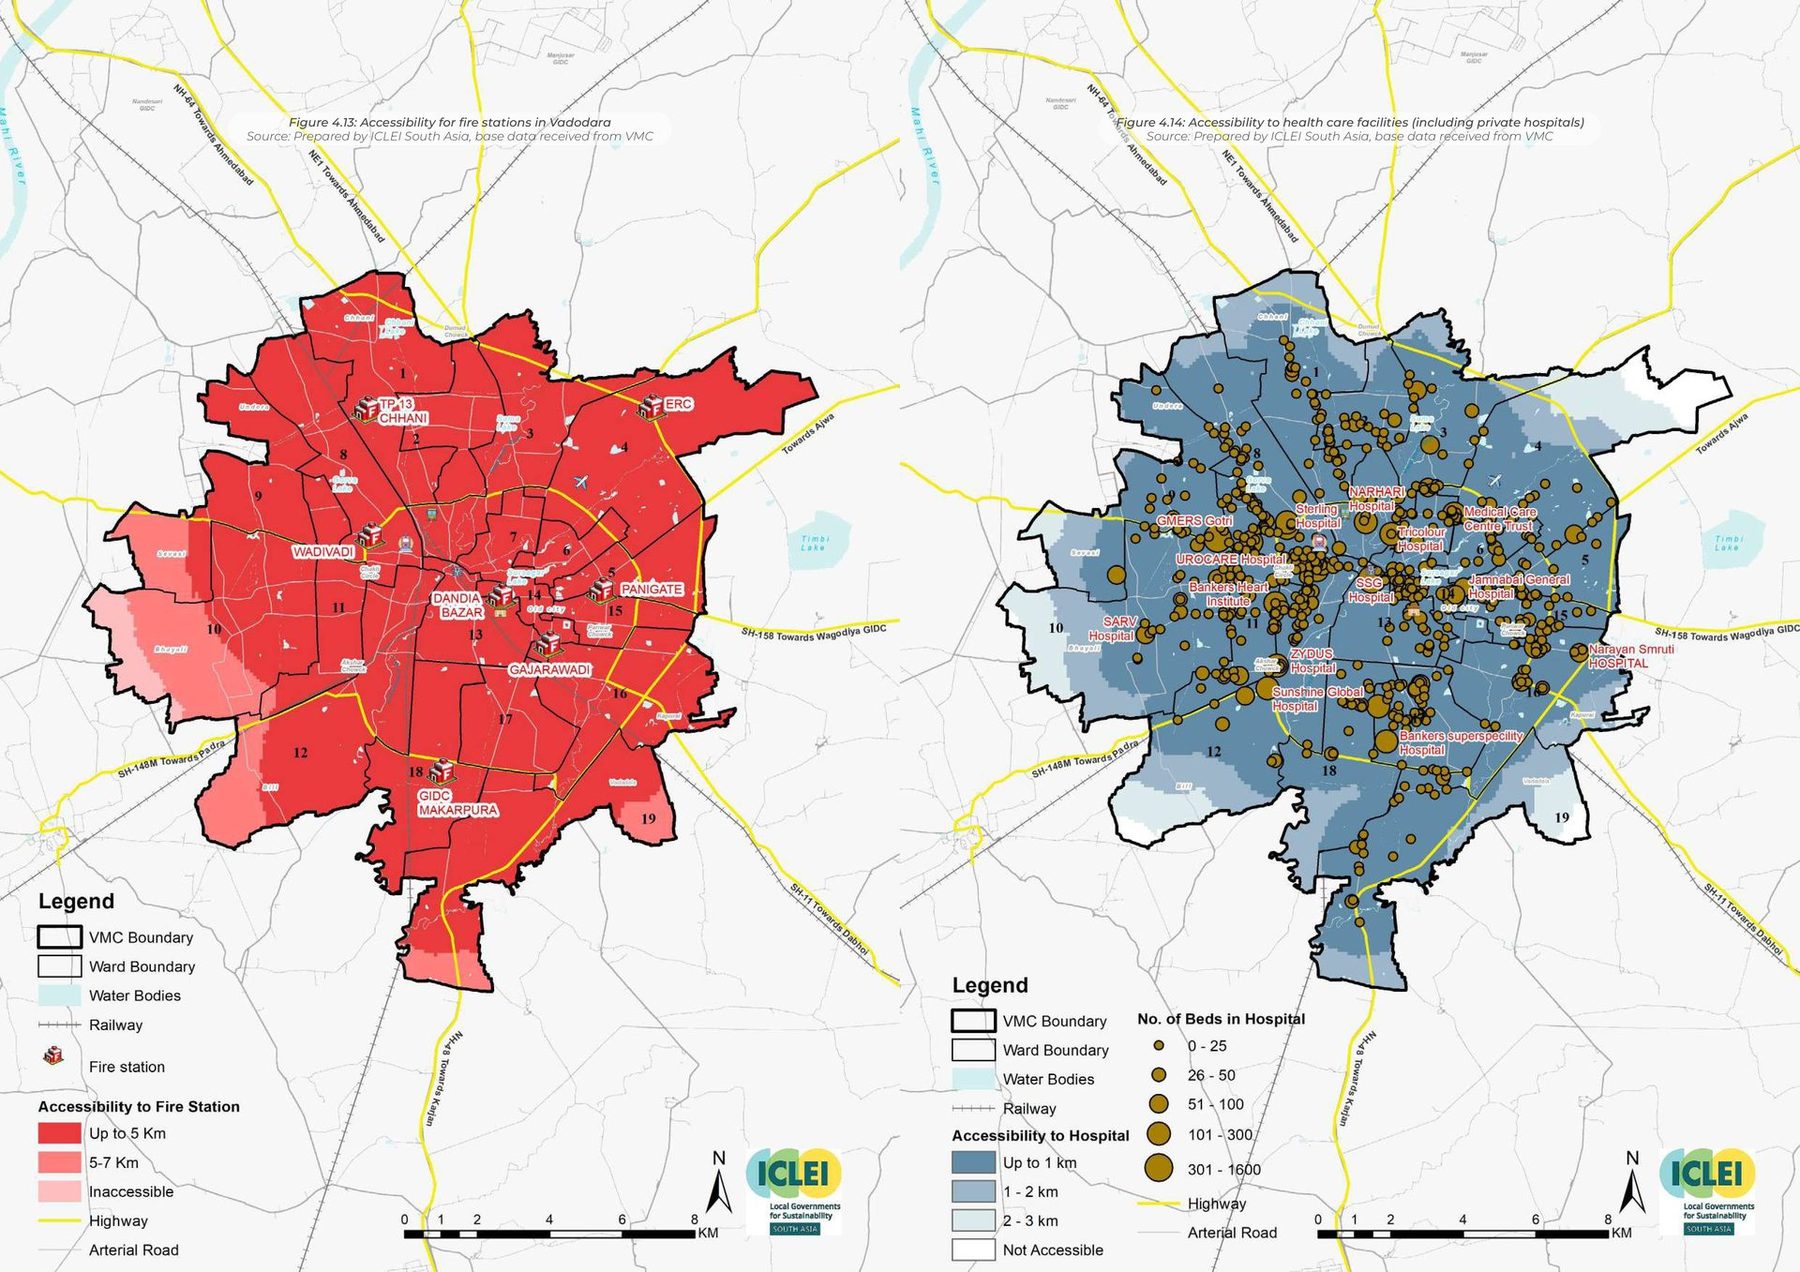
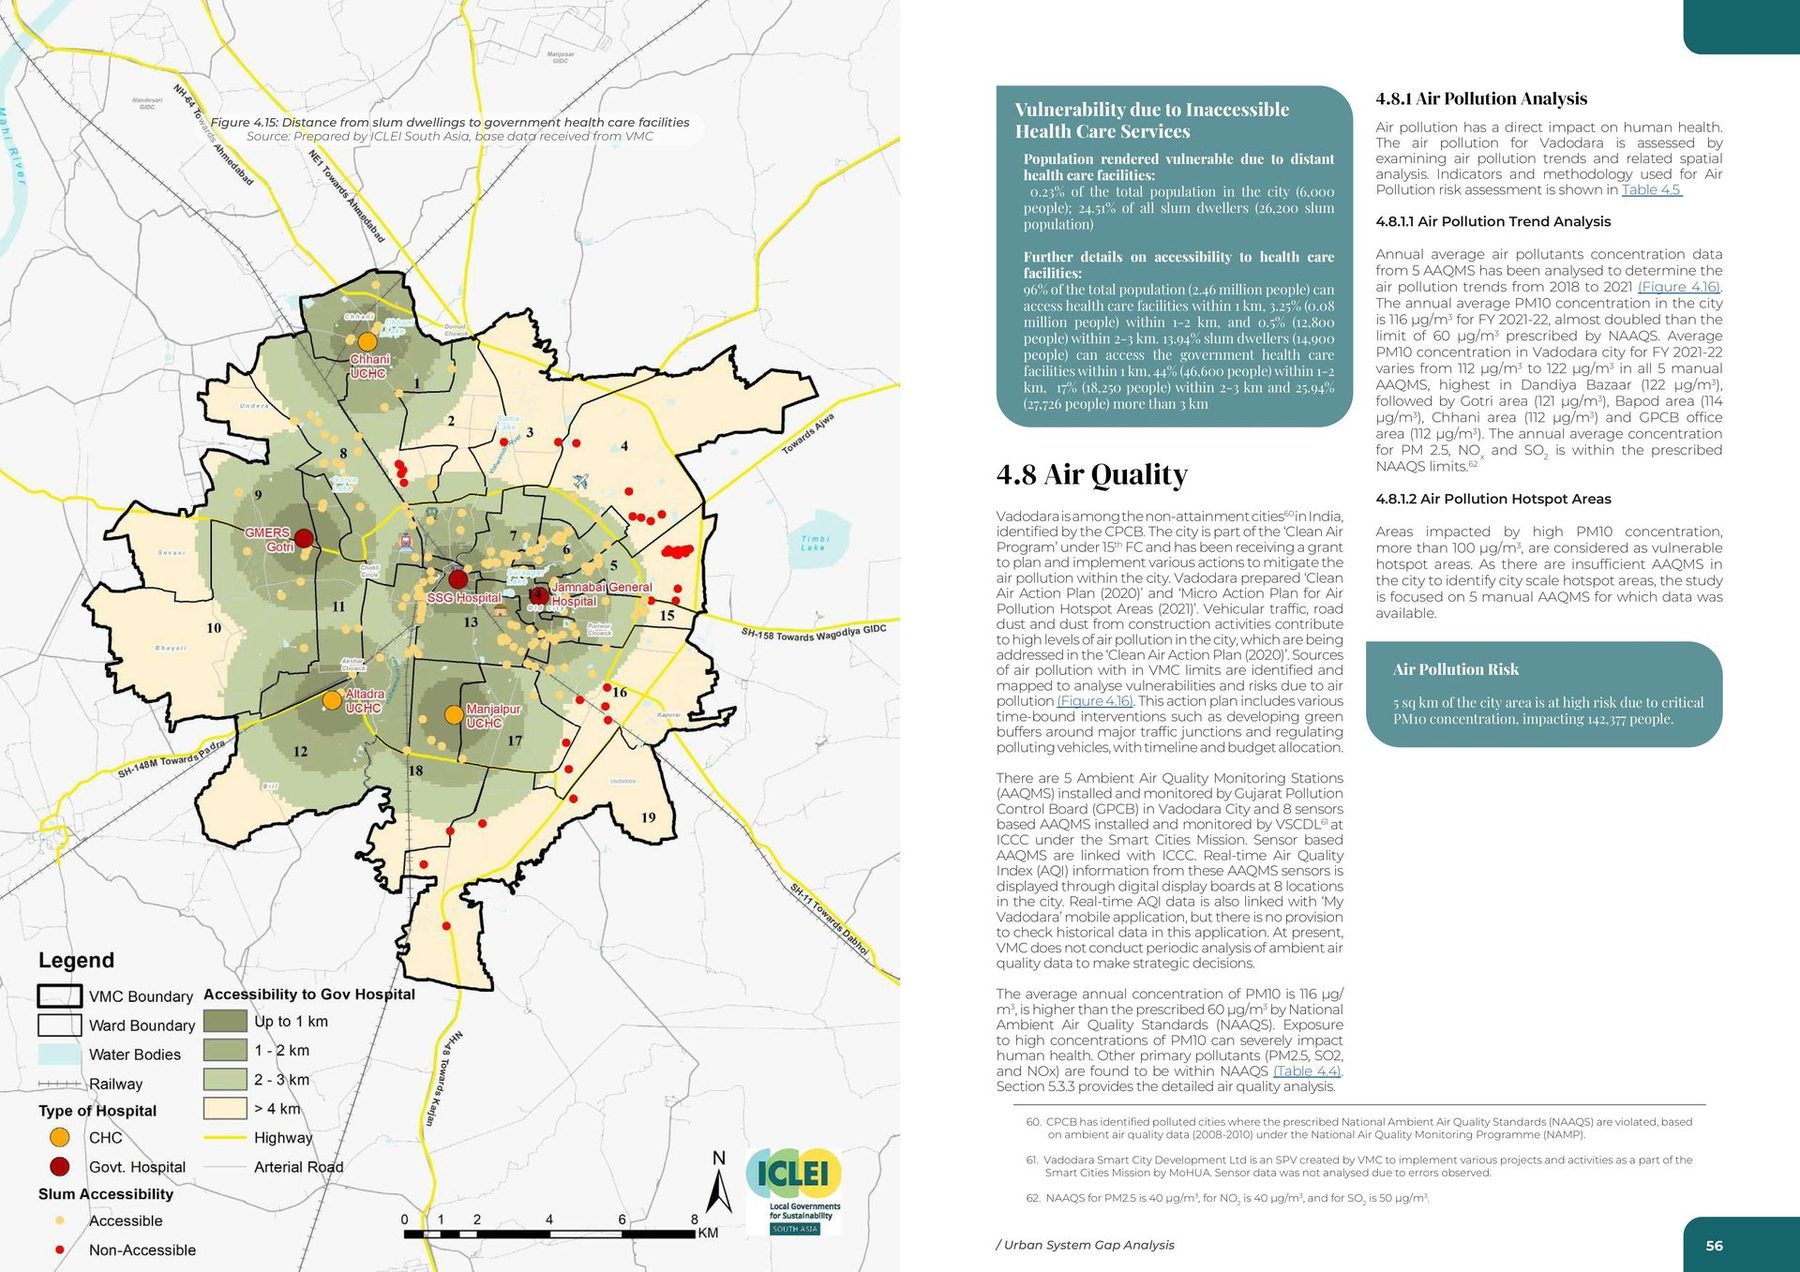
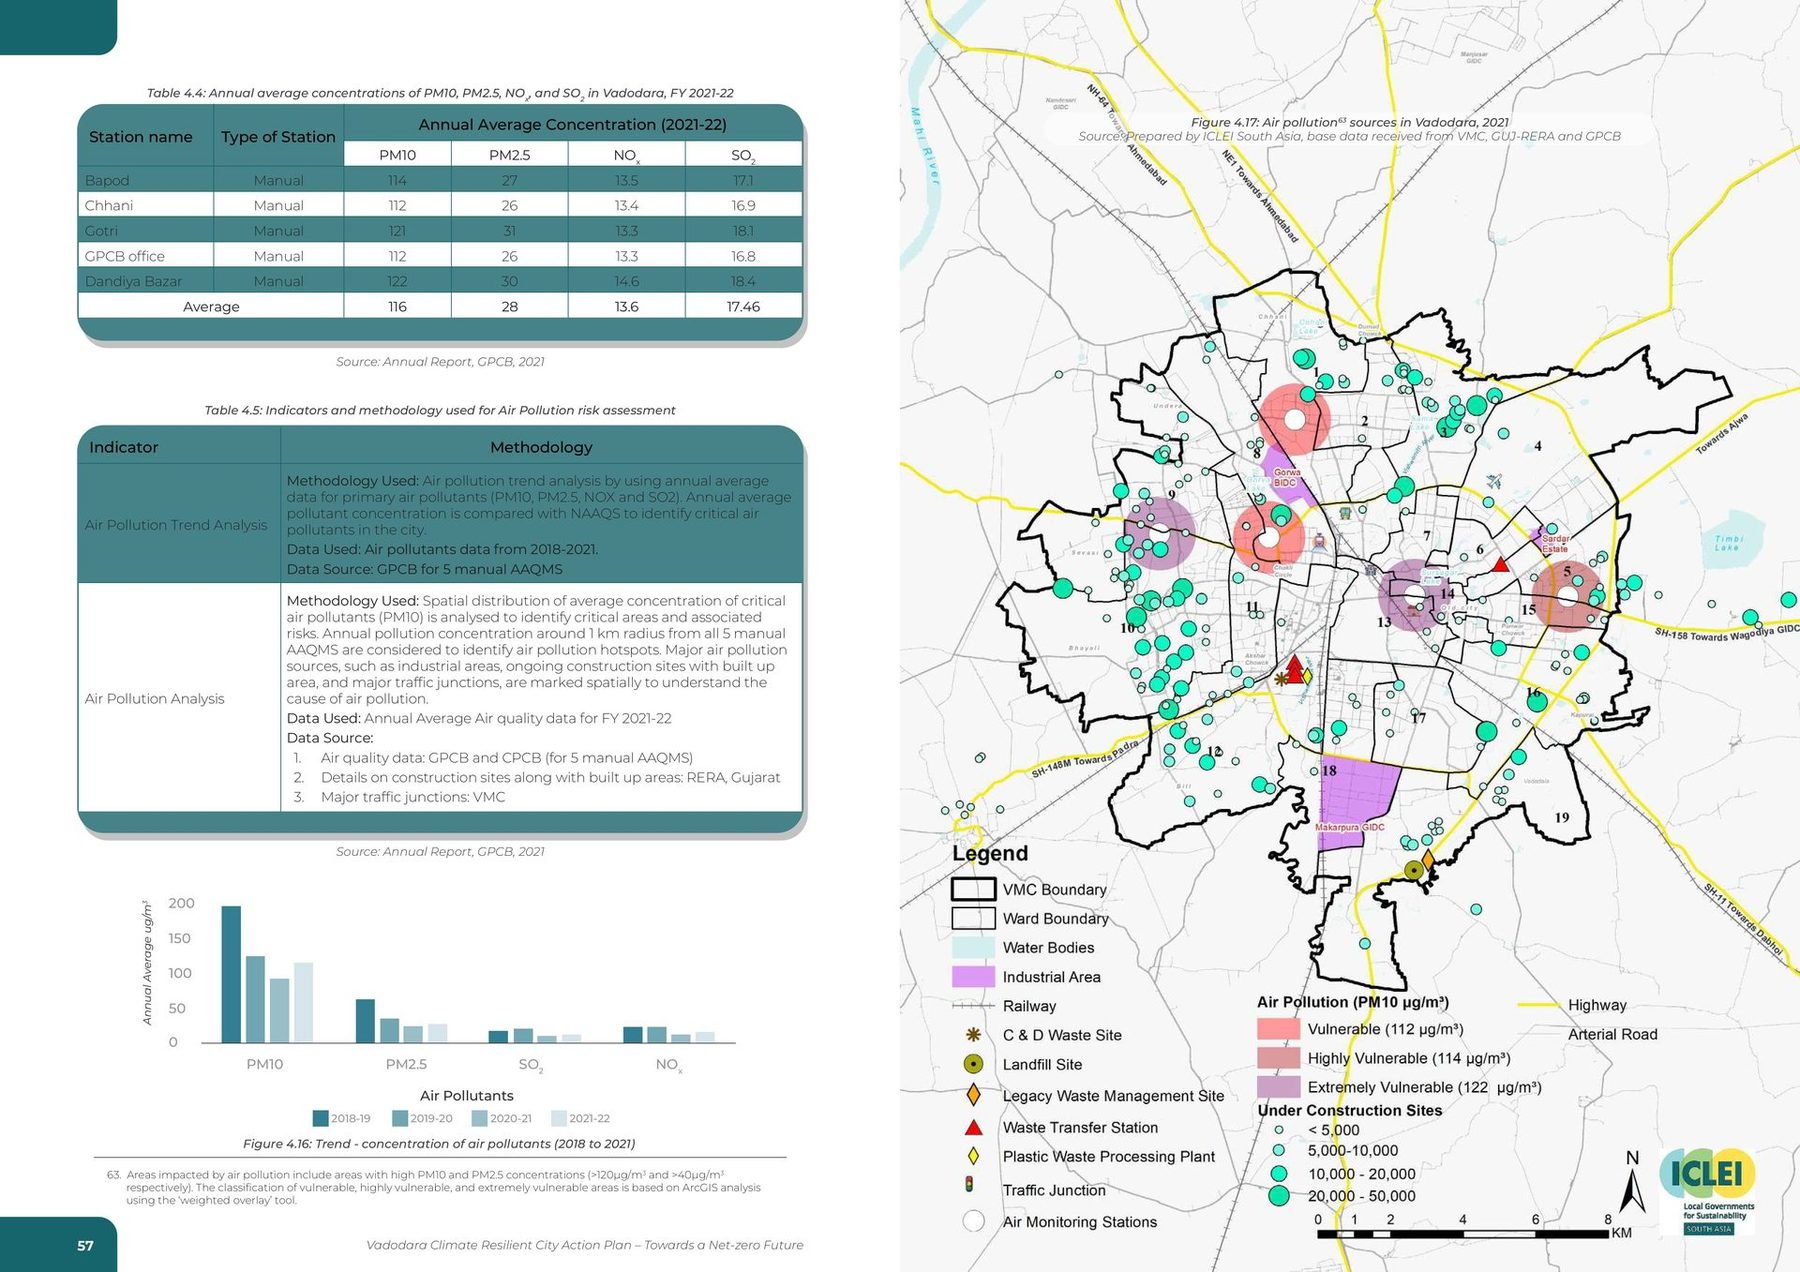
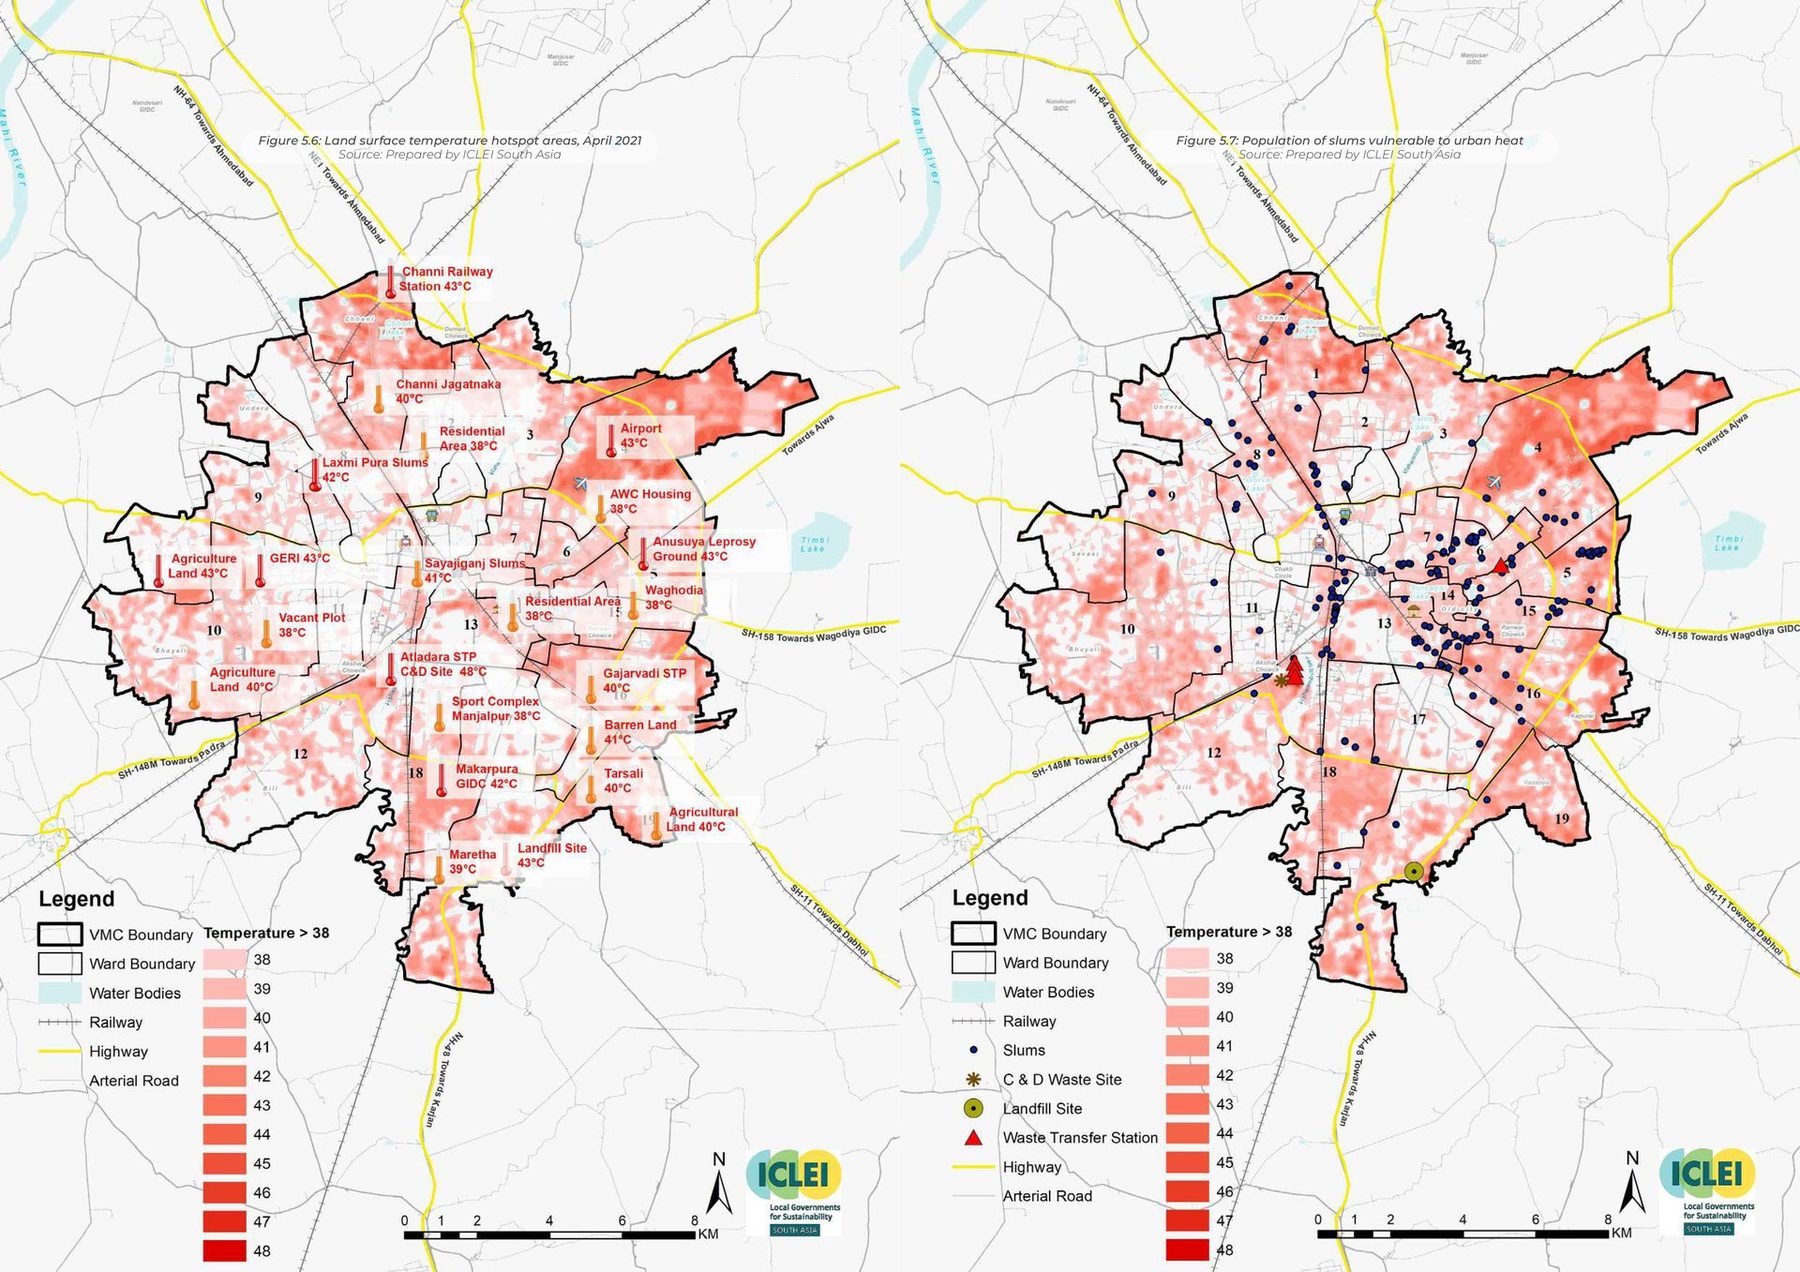
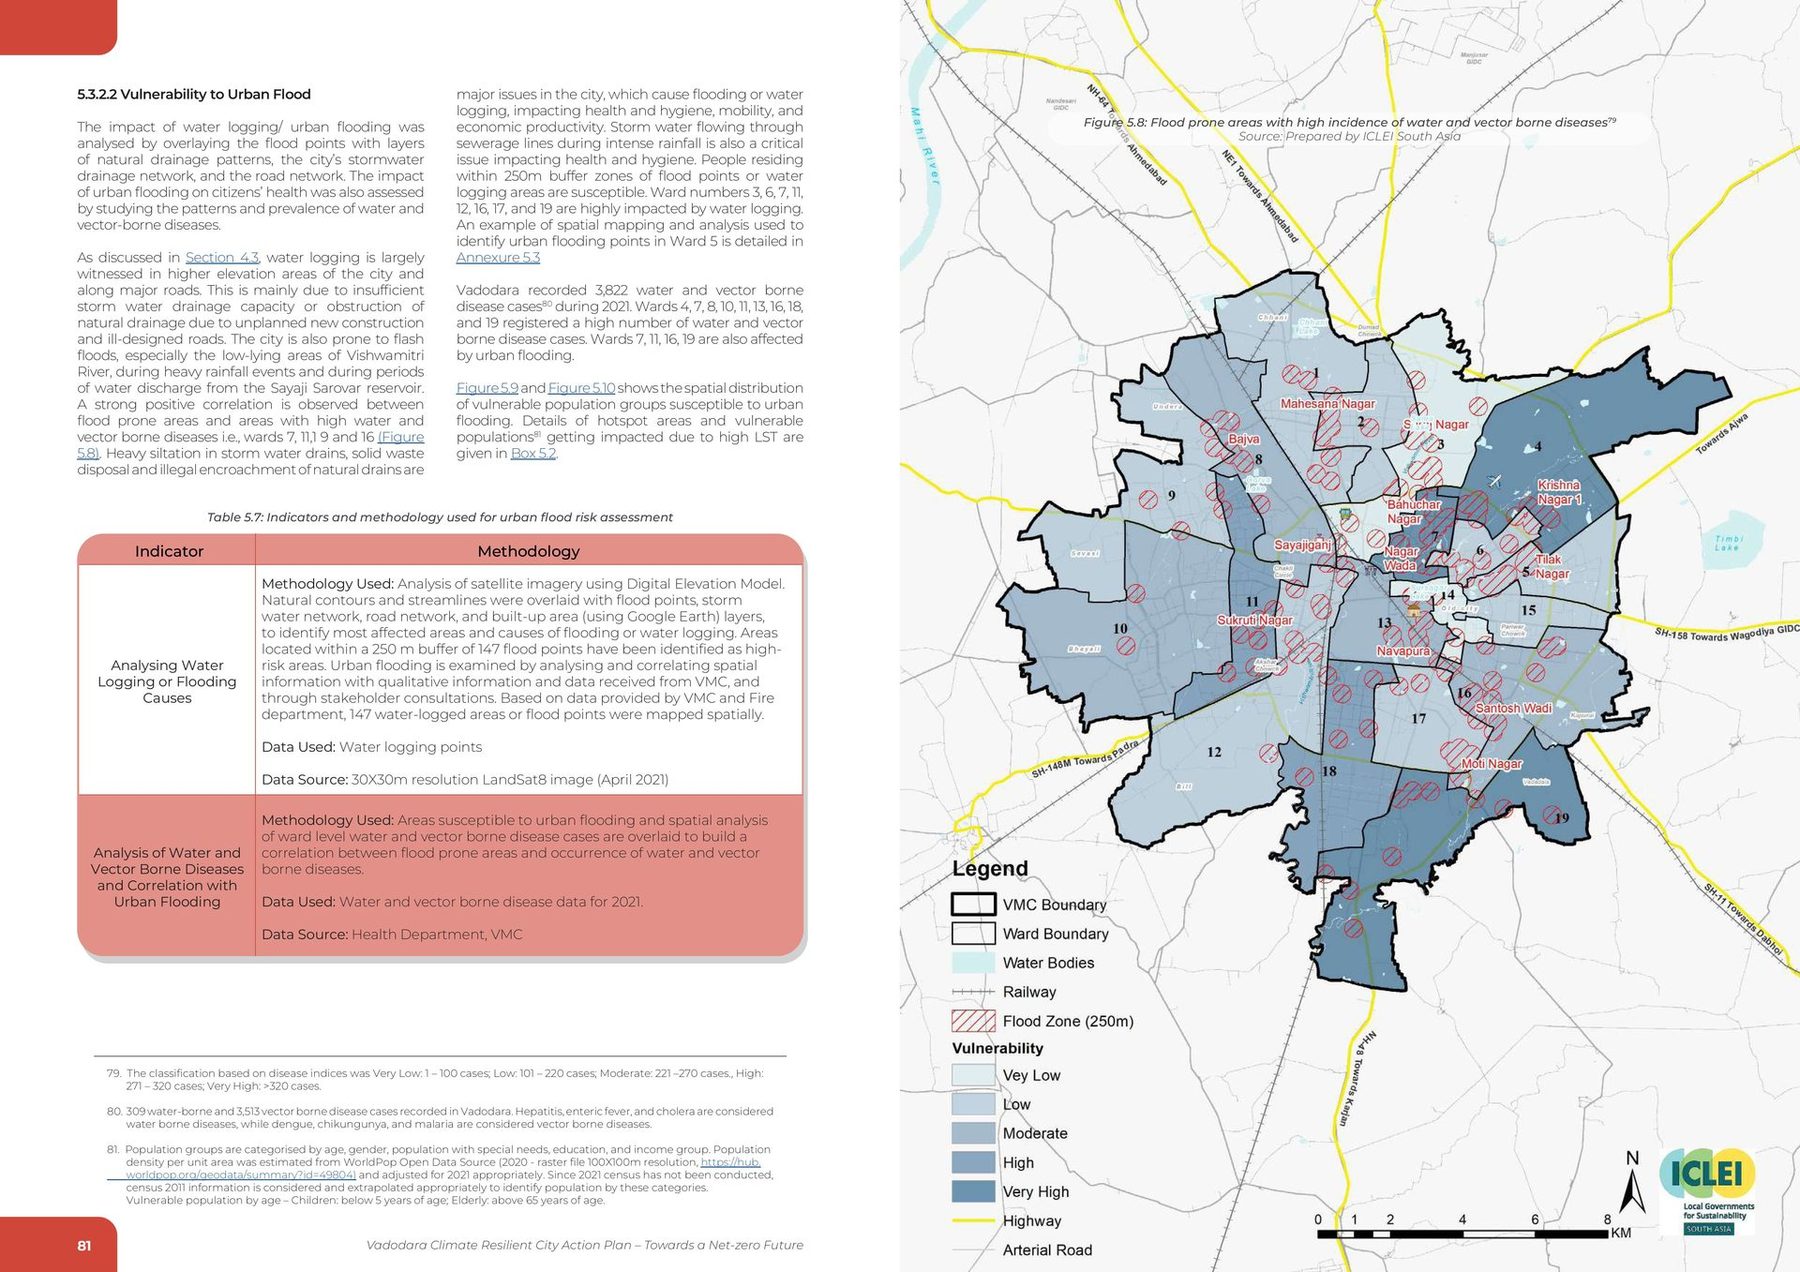
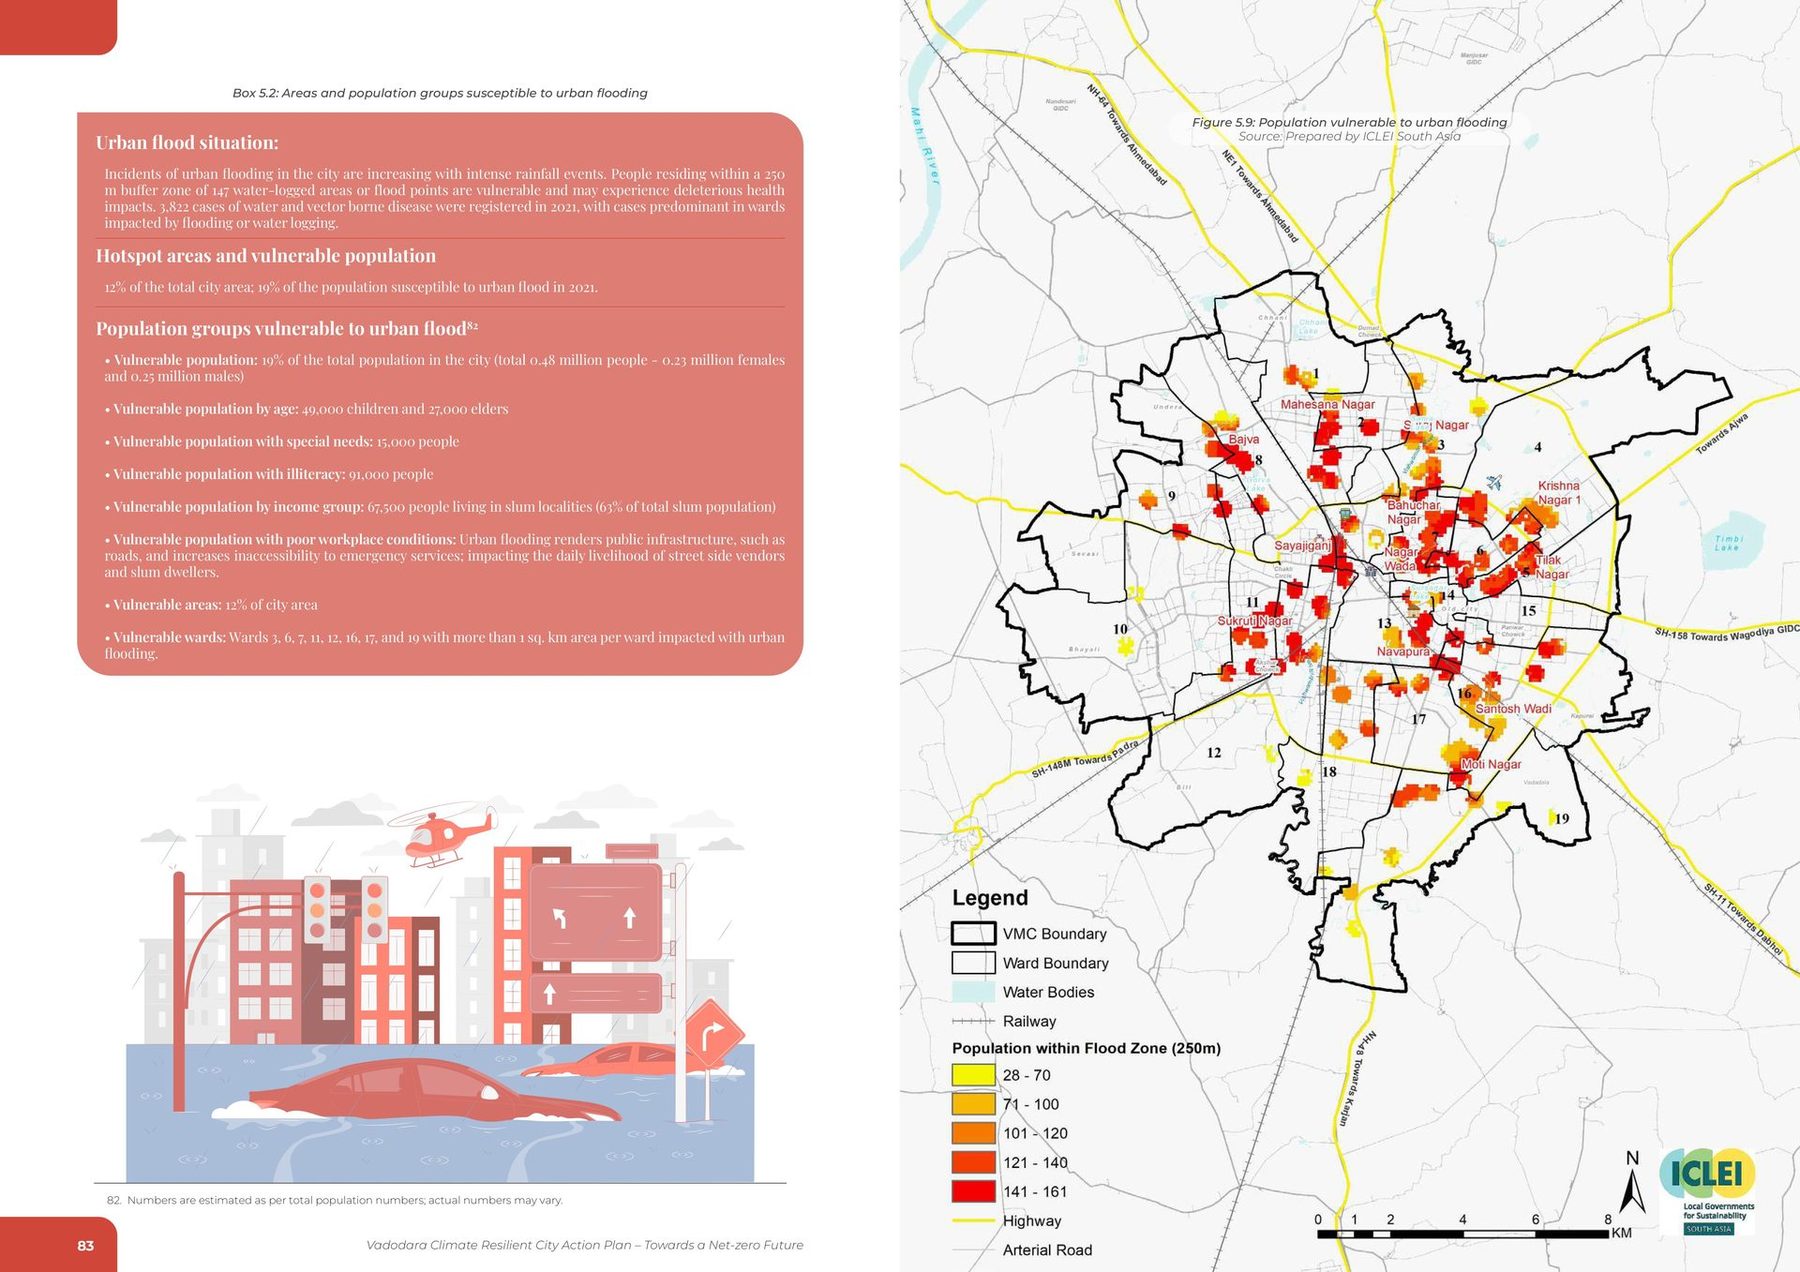
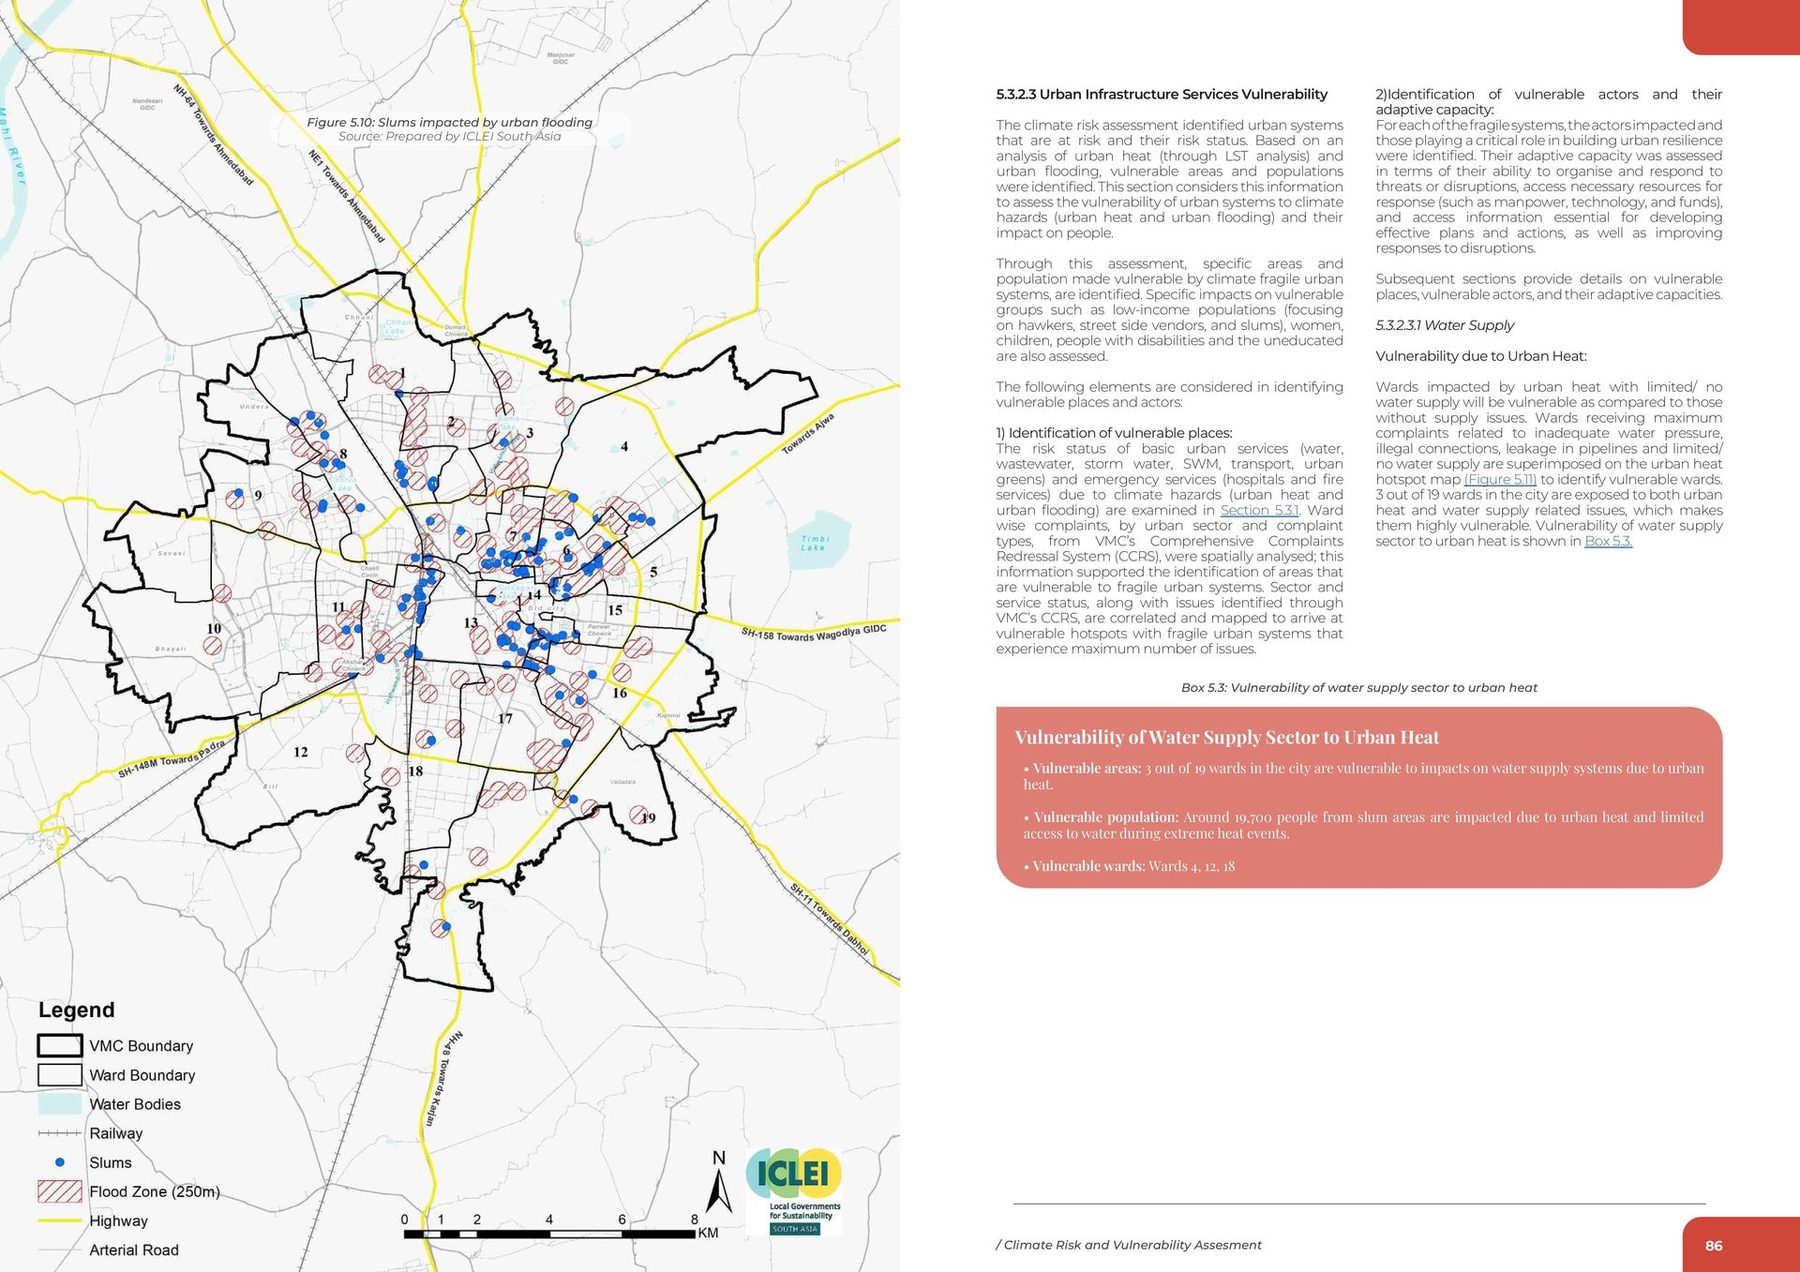
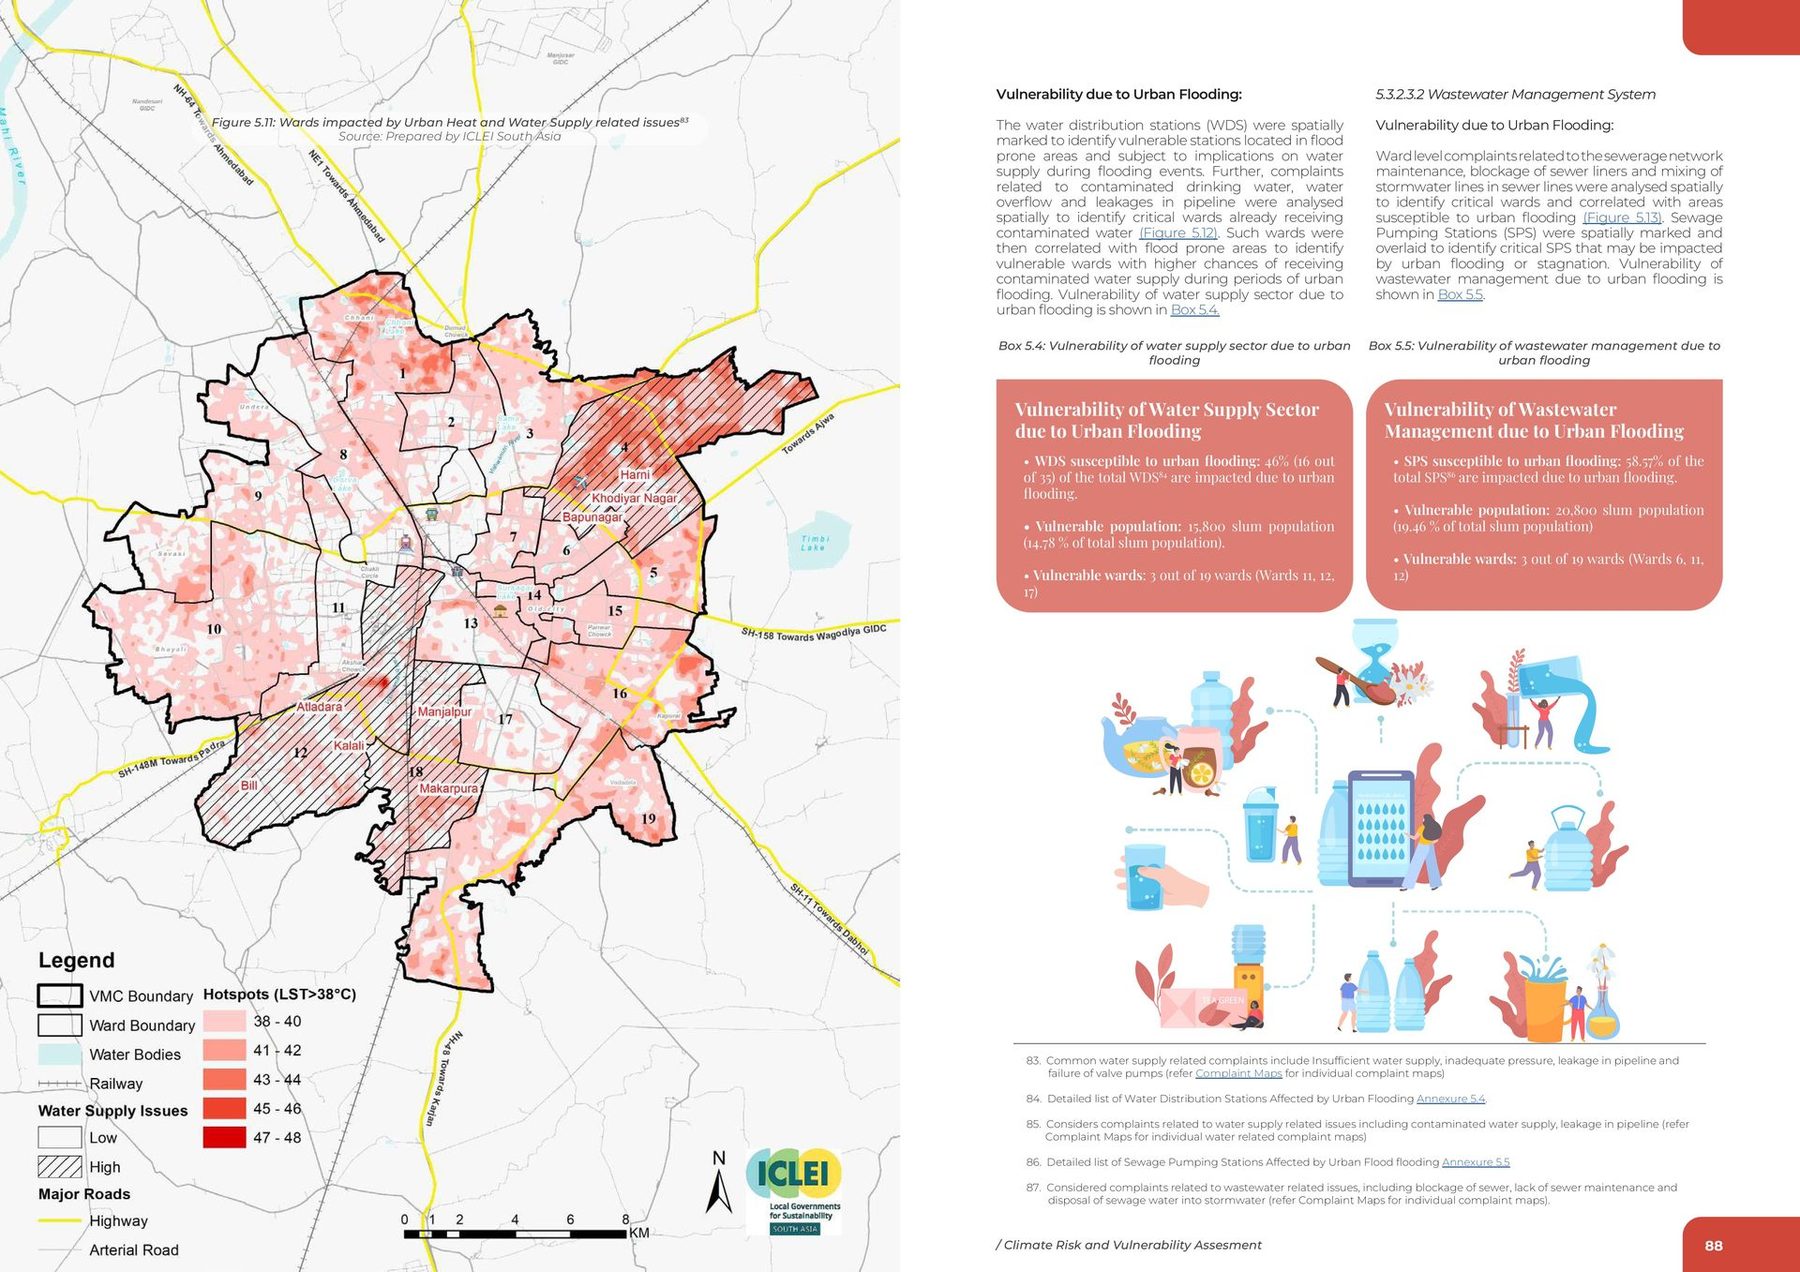
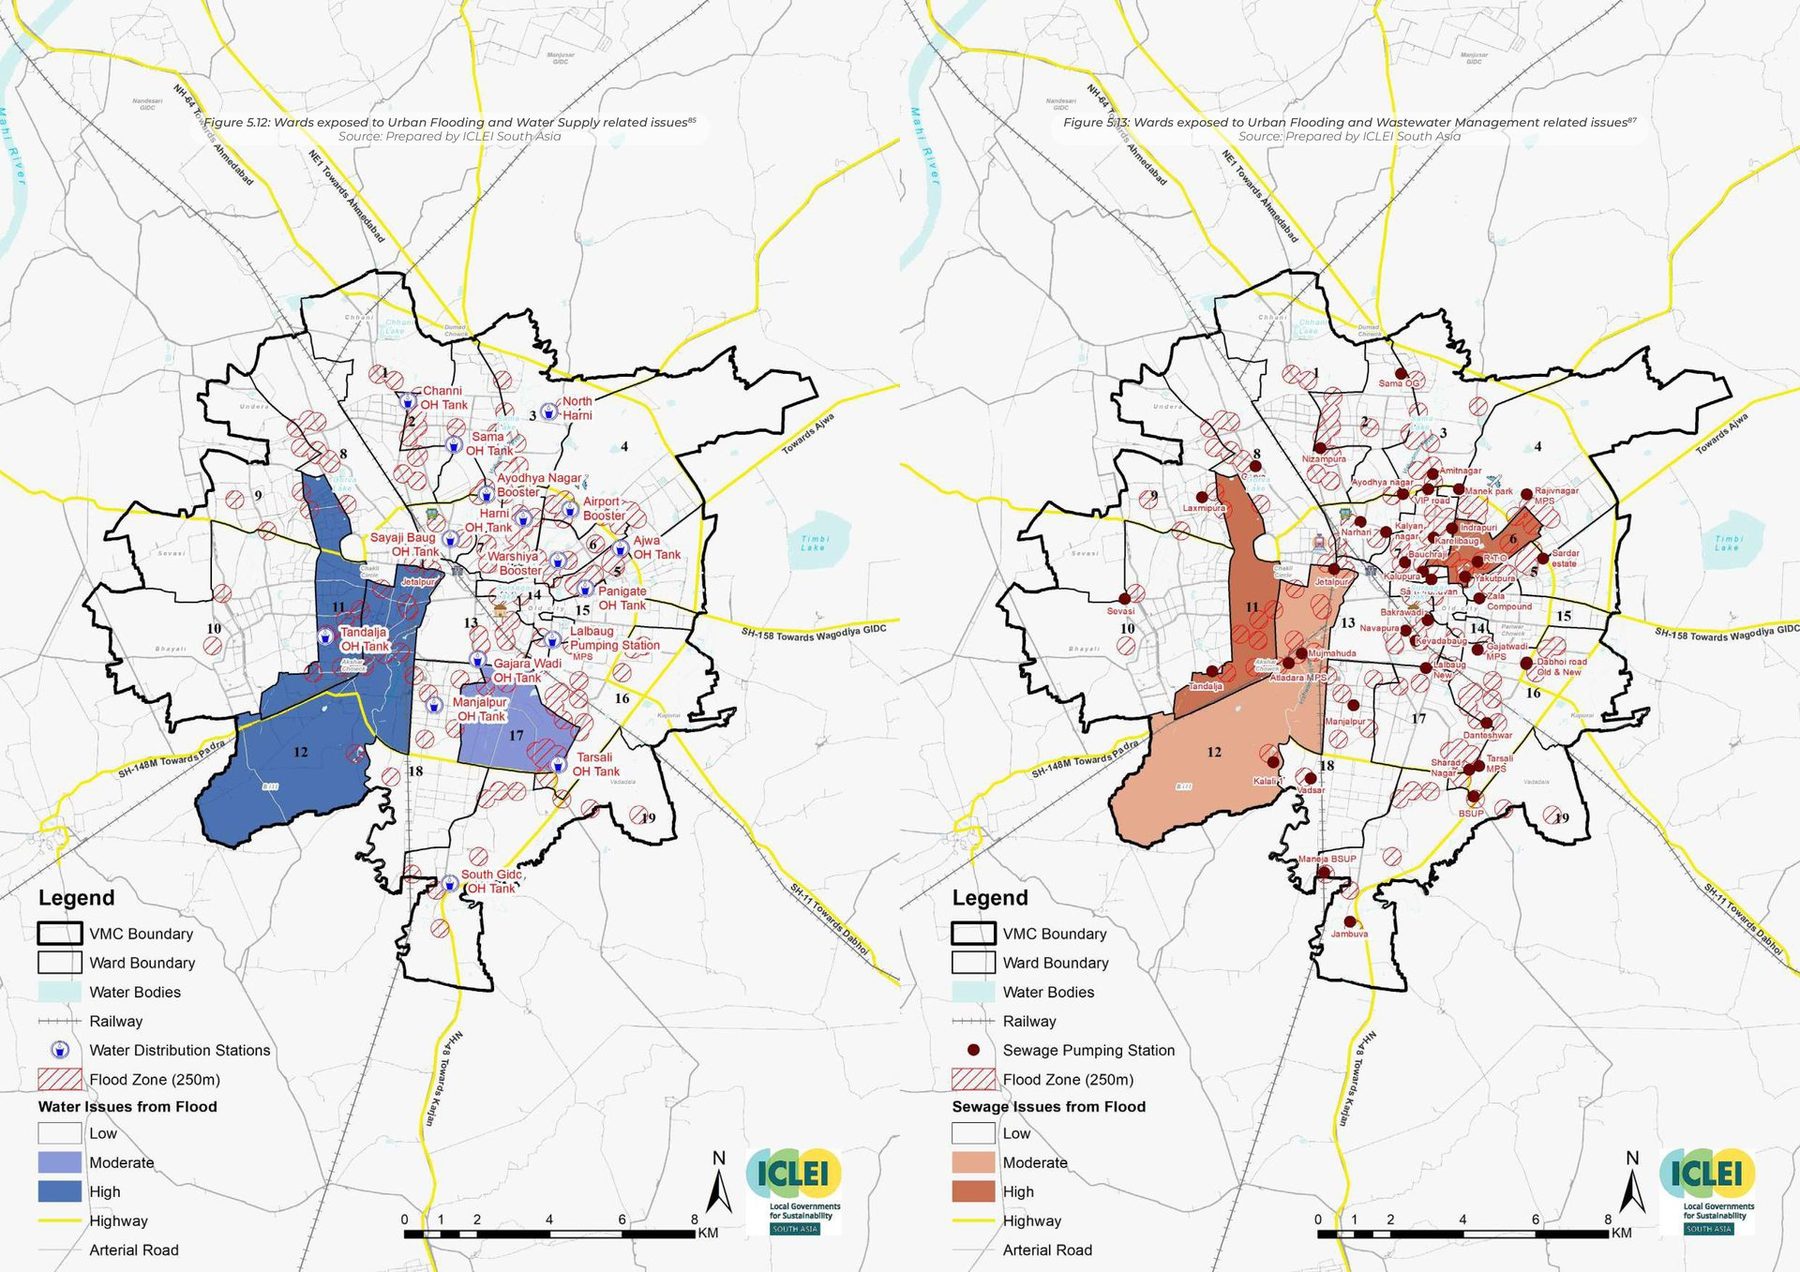
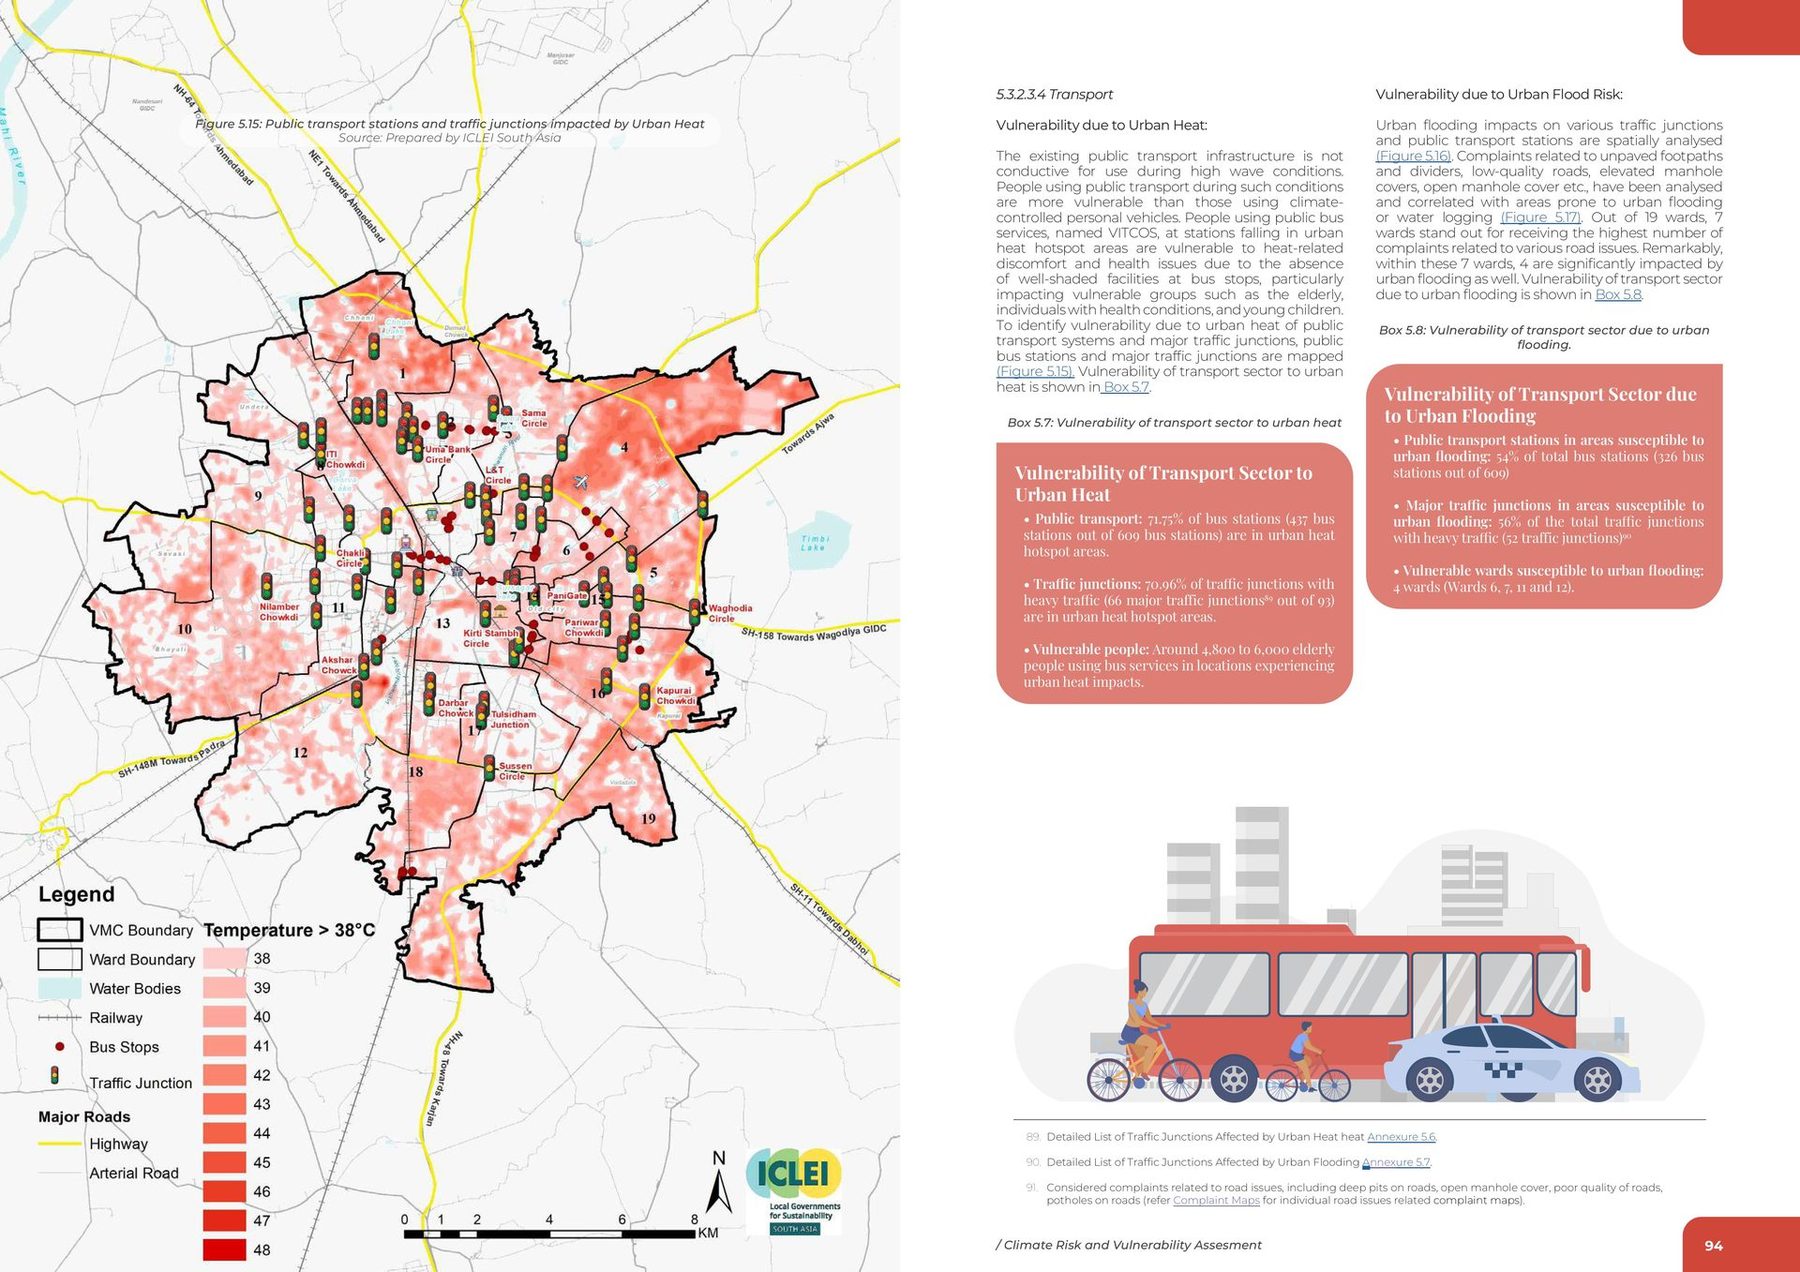
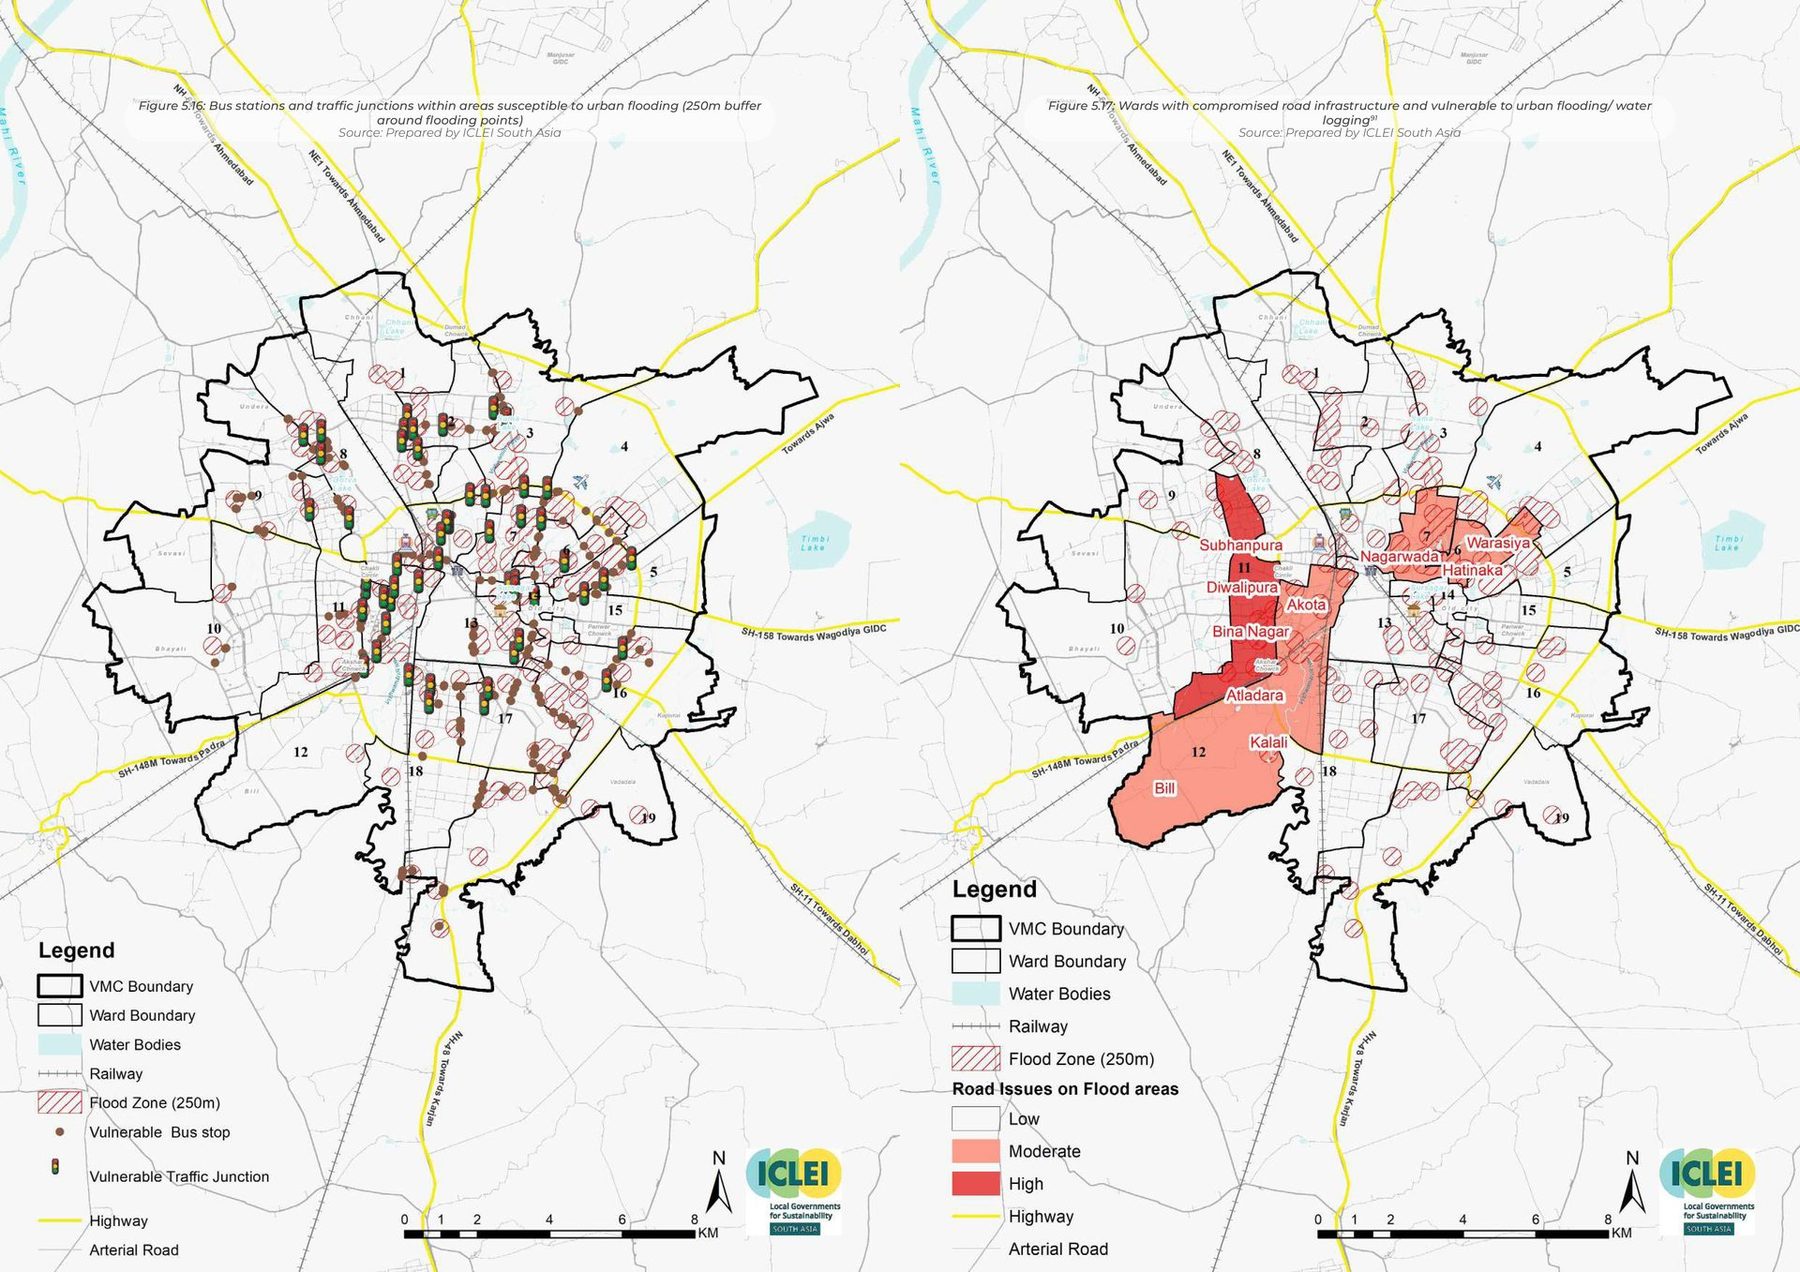
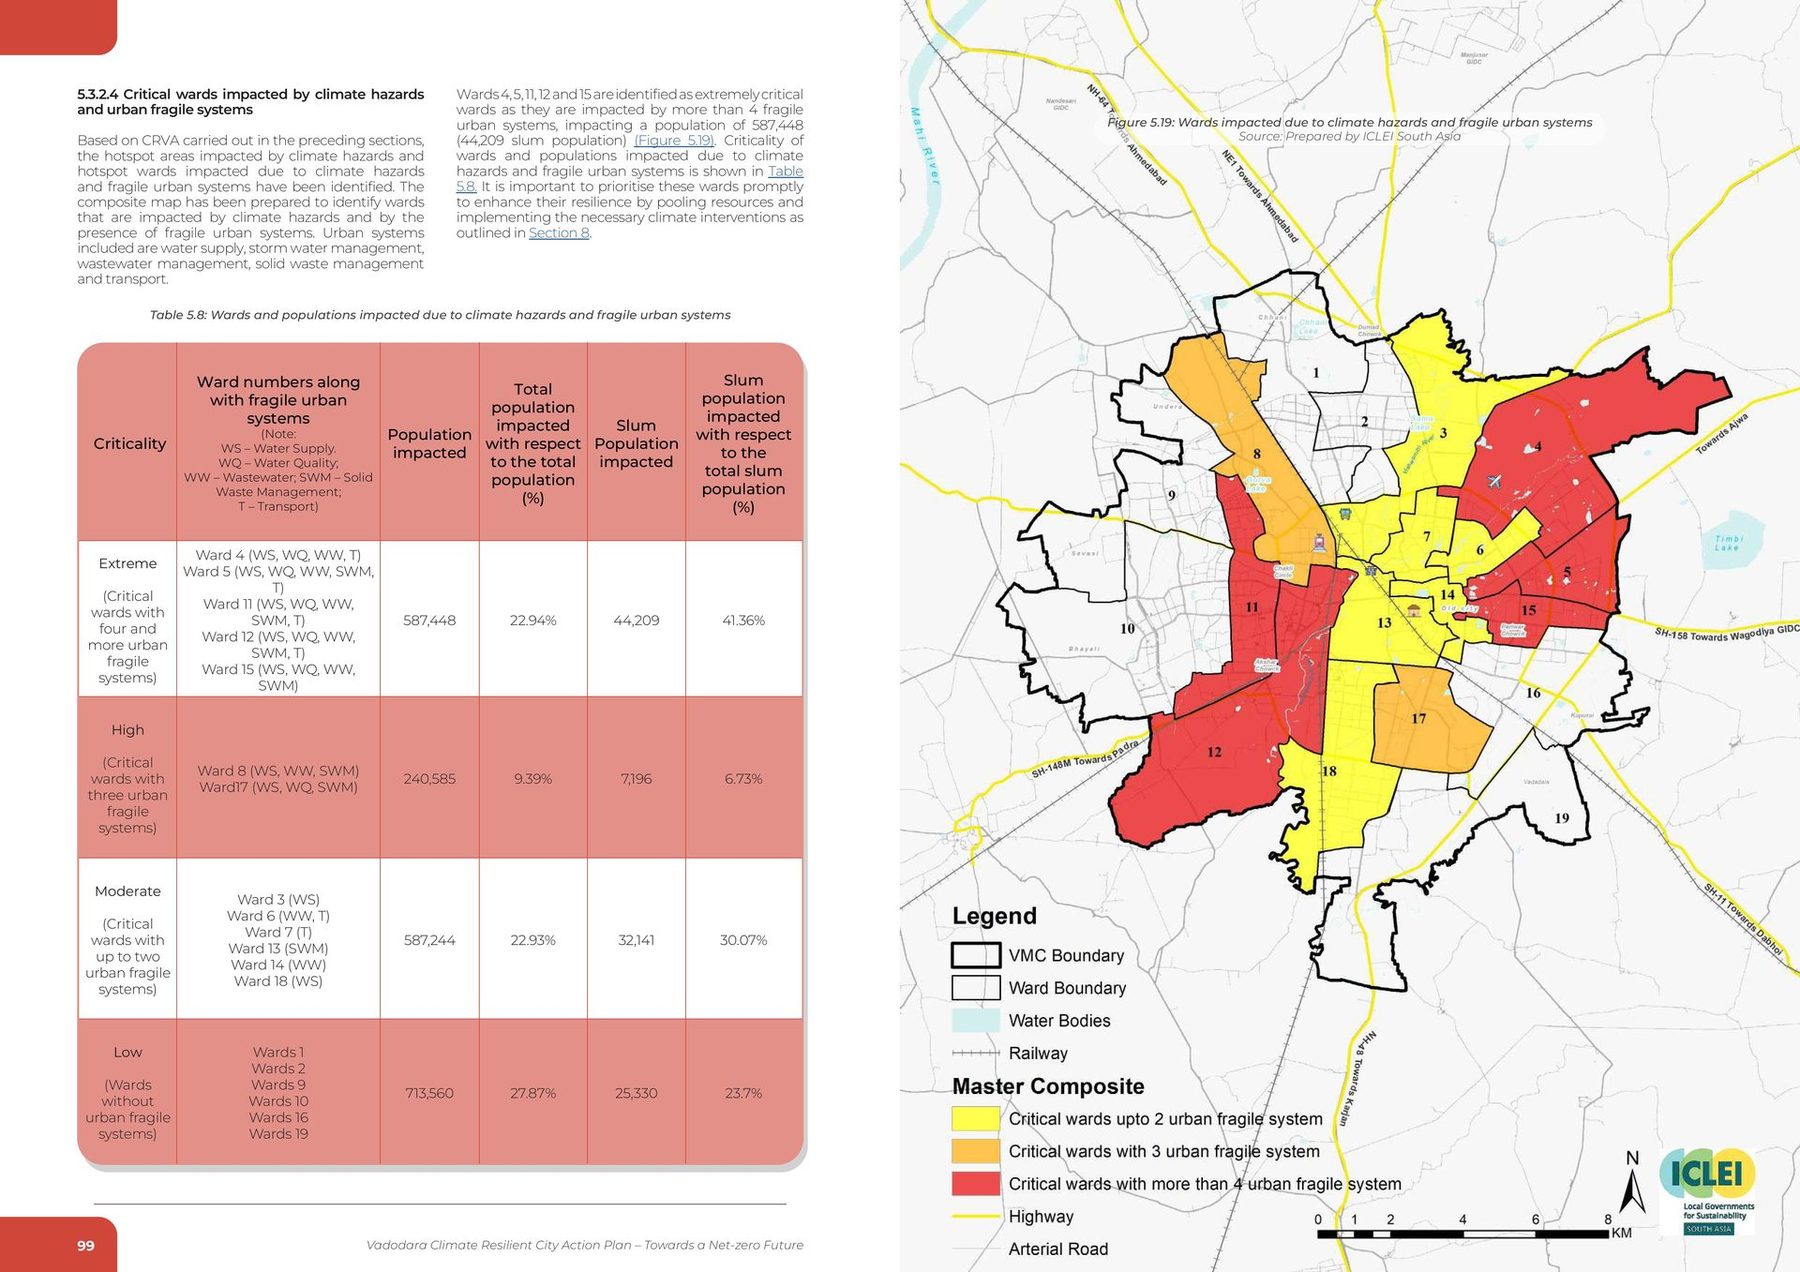
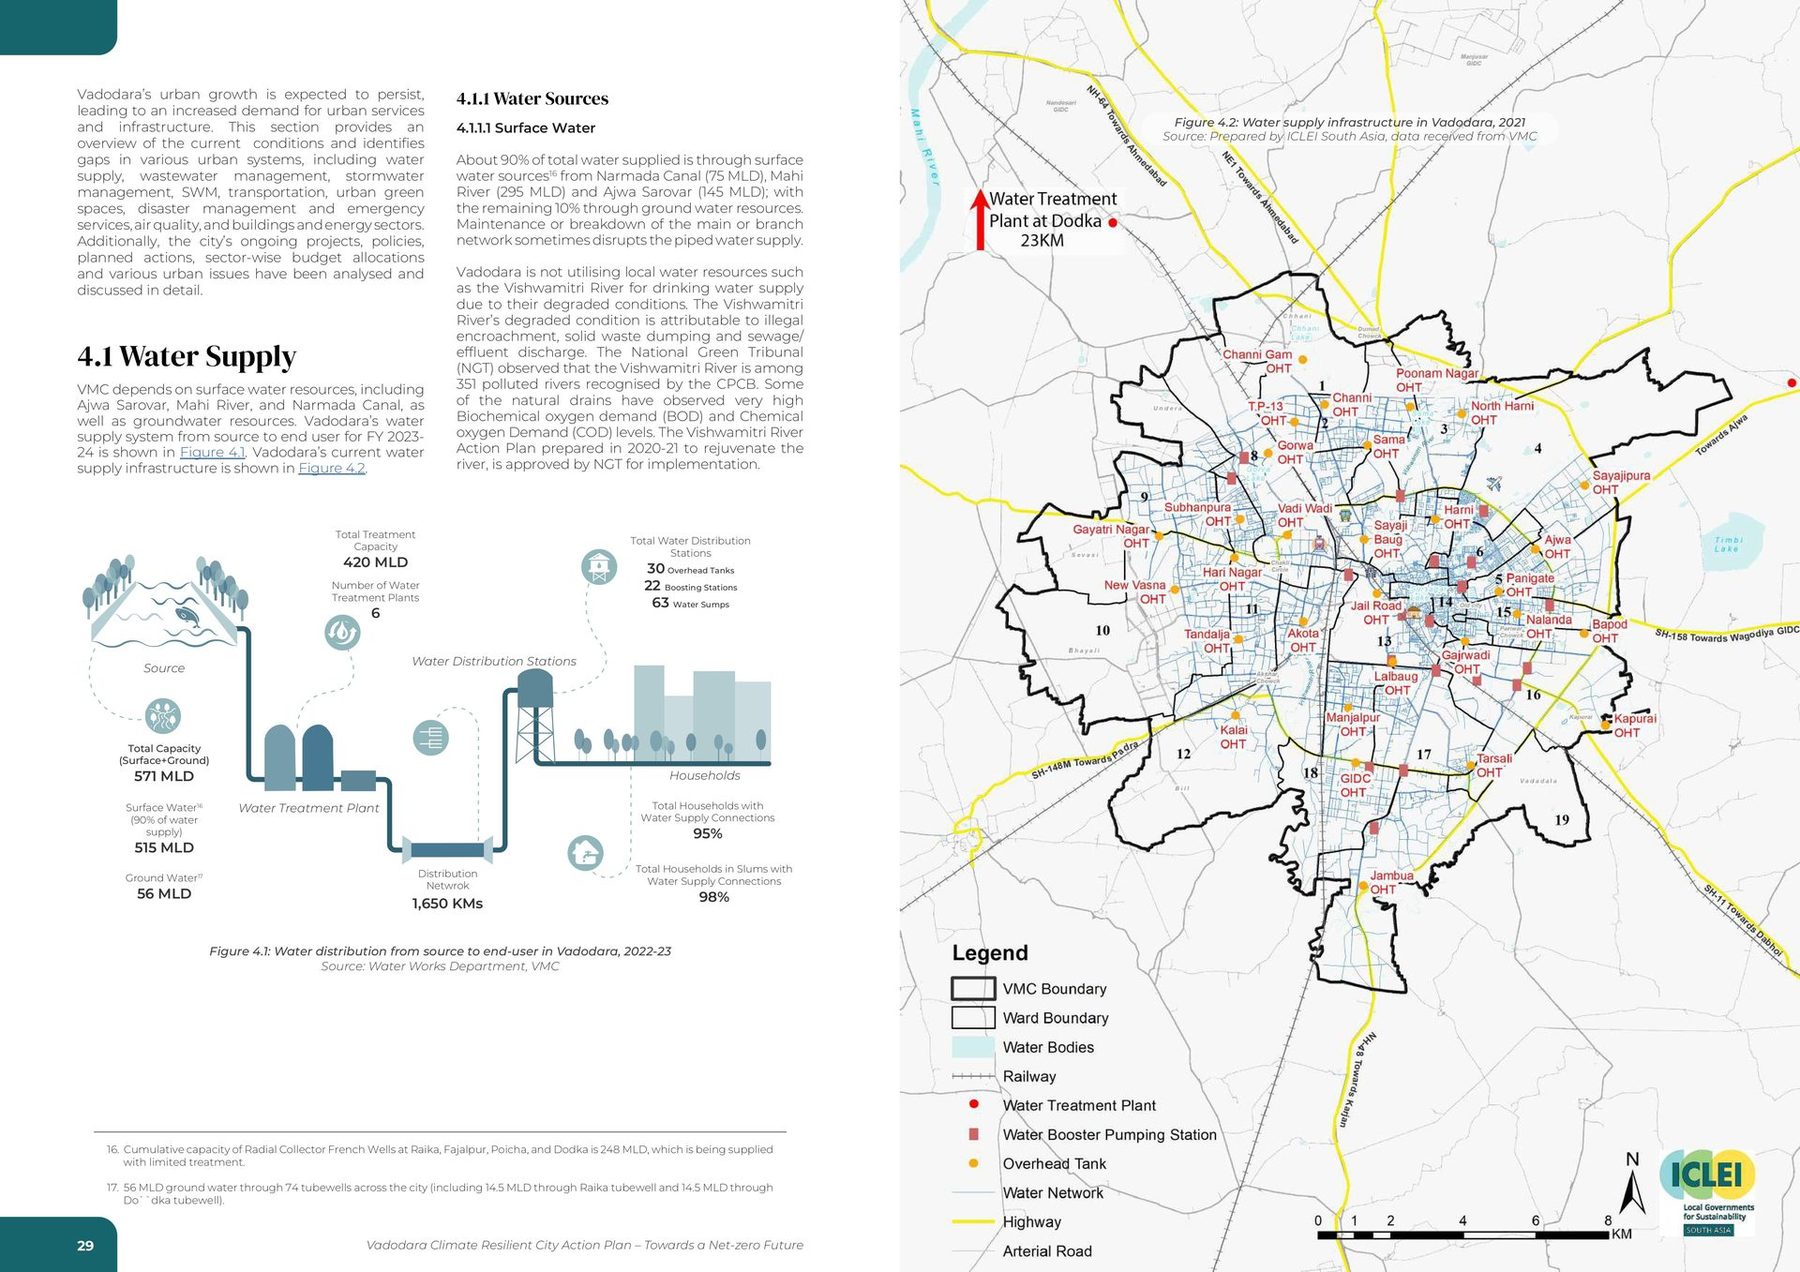
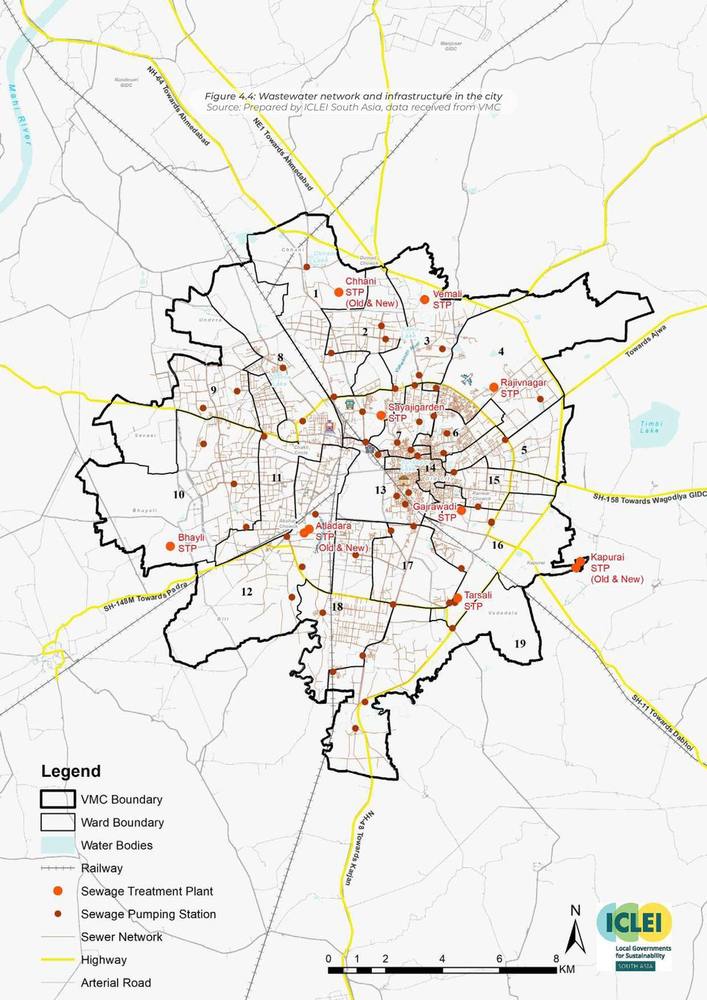
Before the plan proposes anything, it draws. Nineteen maps at ward level, in three passes. First the infrastructure as it stands: wastewater, drainage, waste, transport, tree cover, parks, fire cover, health. Then the hazards: air, the slums inside the heat, the flood-prone areas and the diseases that follow them. Then the cross: heat laid over water supply, flood over water supply, heat over the transport network, flood over the roads and the emergency services that depend on them, and one composite of every hazard against every fragile system.

They are one drawing, not nineteen. The ward boundaries, the water bodies, the railway and the ring of highways sit in the same place on every sheet, so the atlas belongs on one stage rather than in a grid: step through it and what moves is the question, not the city.
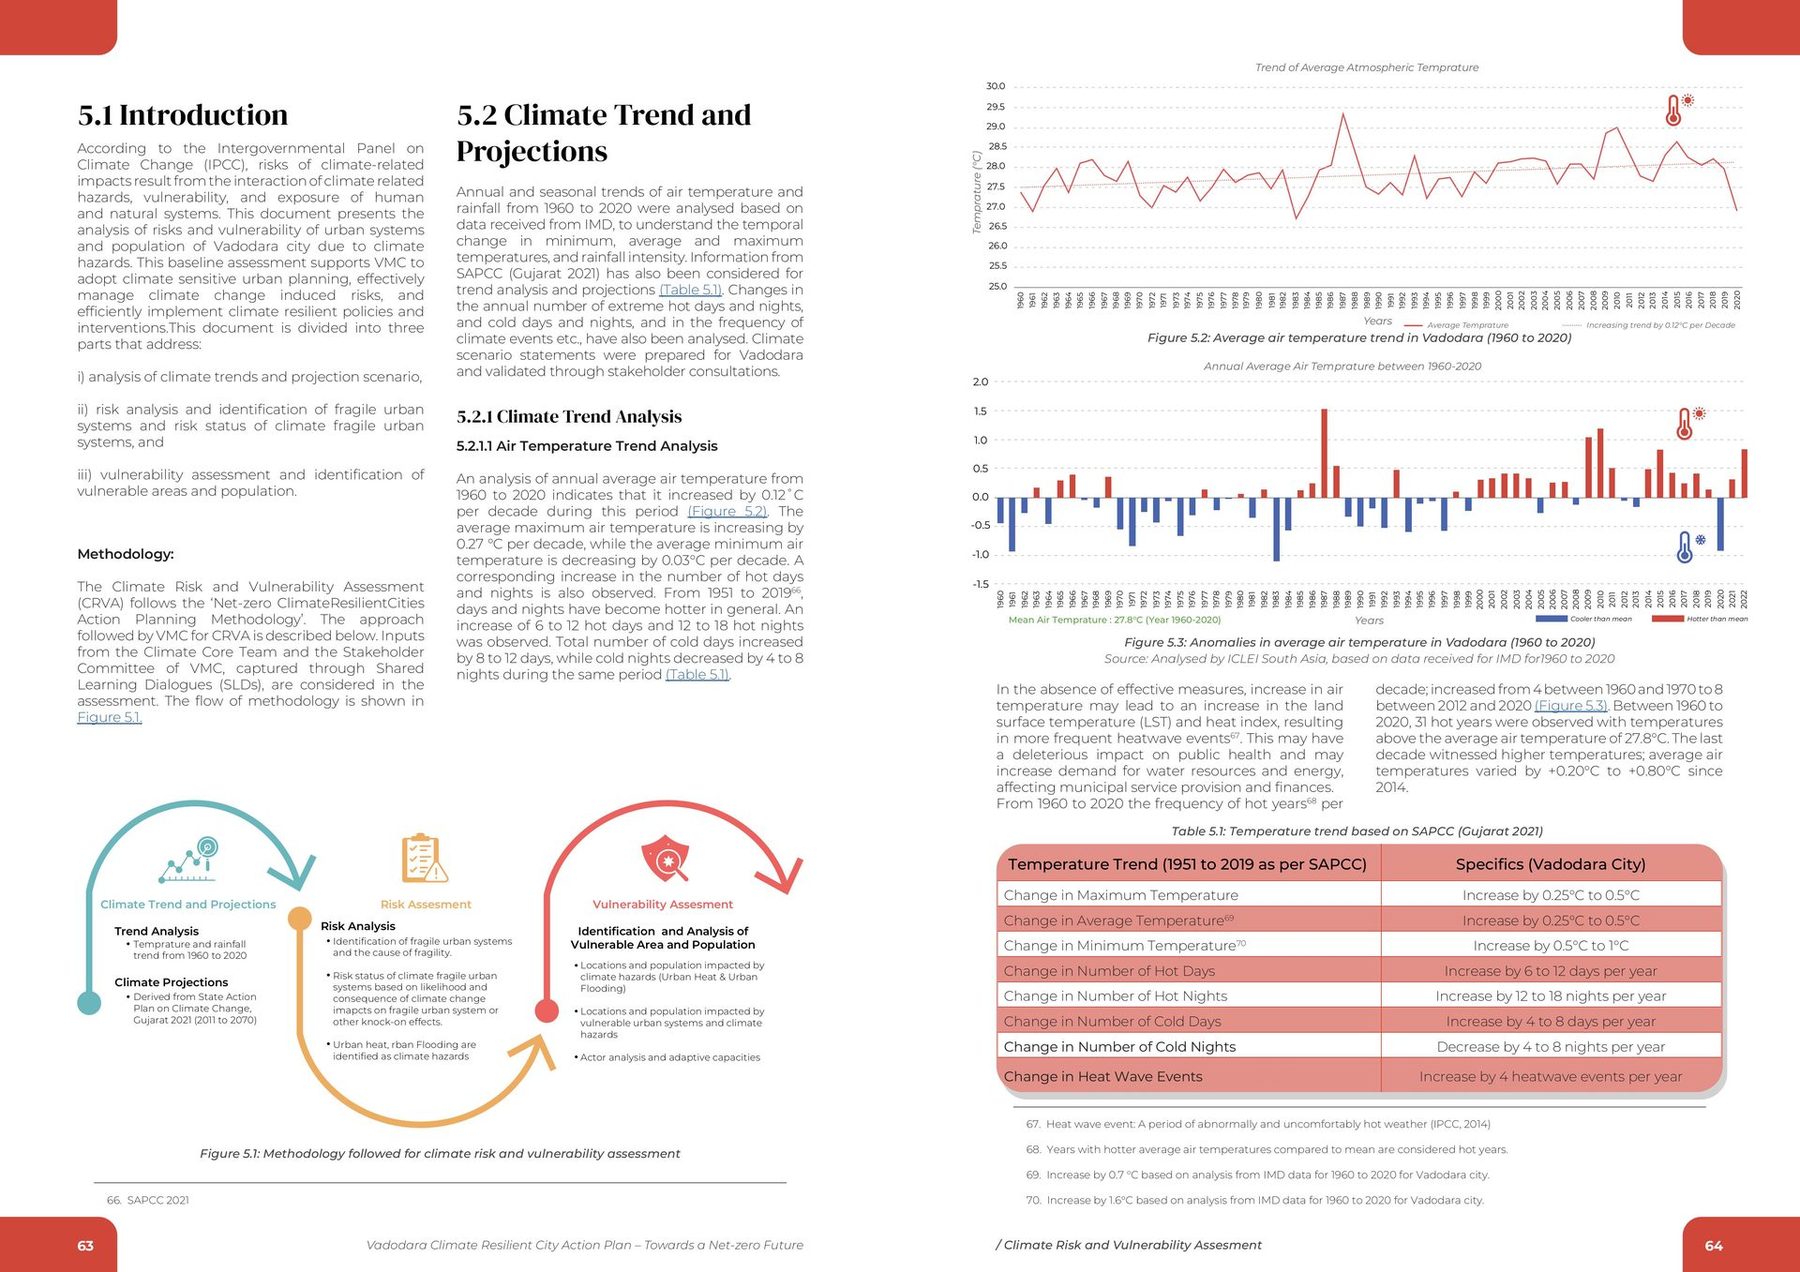
Climate trends. Temperature and rainfall, the record every hazard map in the atlas is scored against.
fig.13Climate trends. Temperature and rainfall, the record every hazard map in the atlas is scored against.
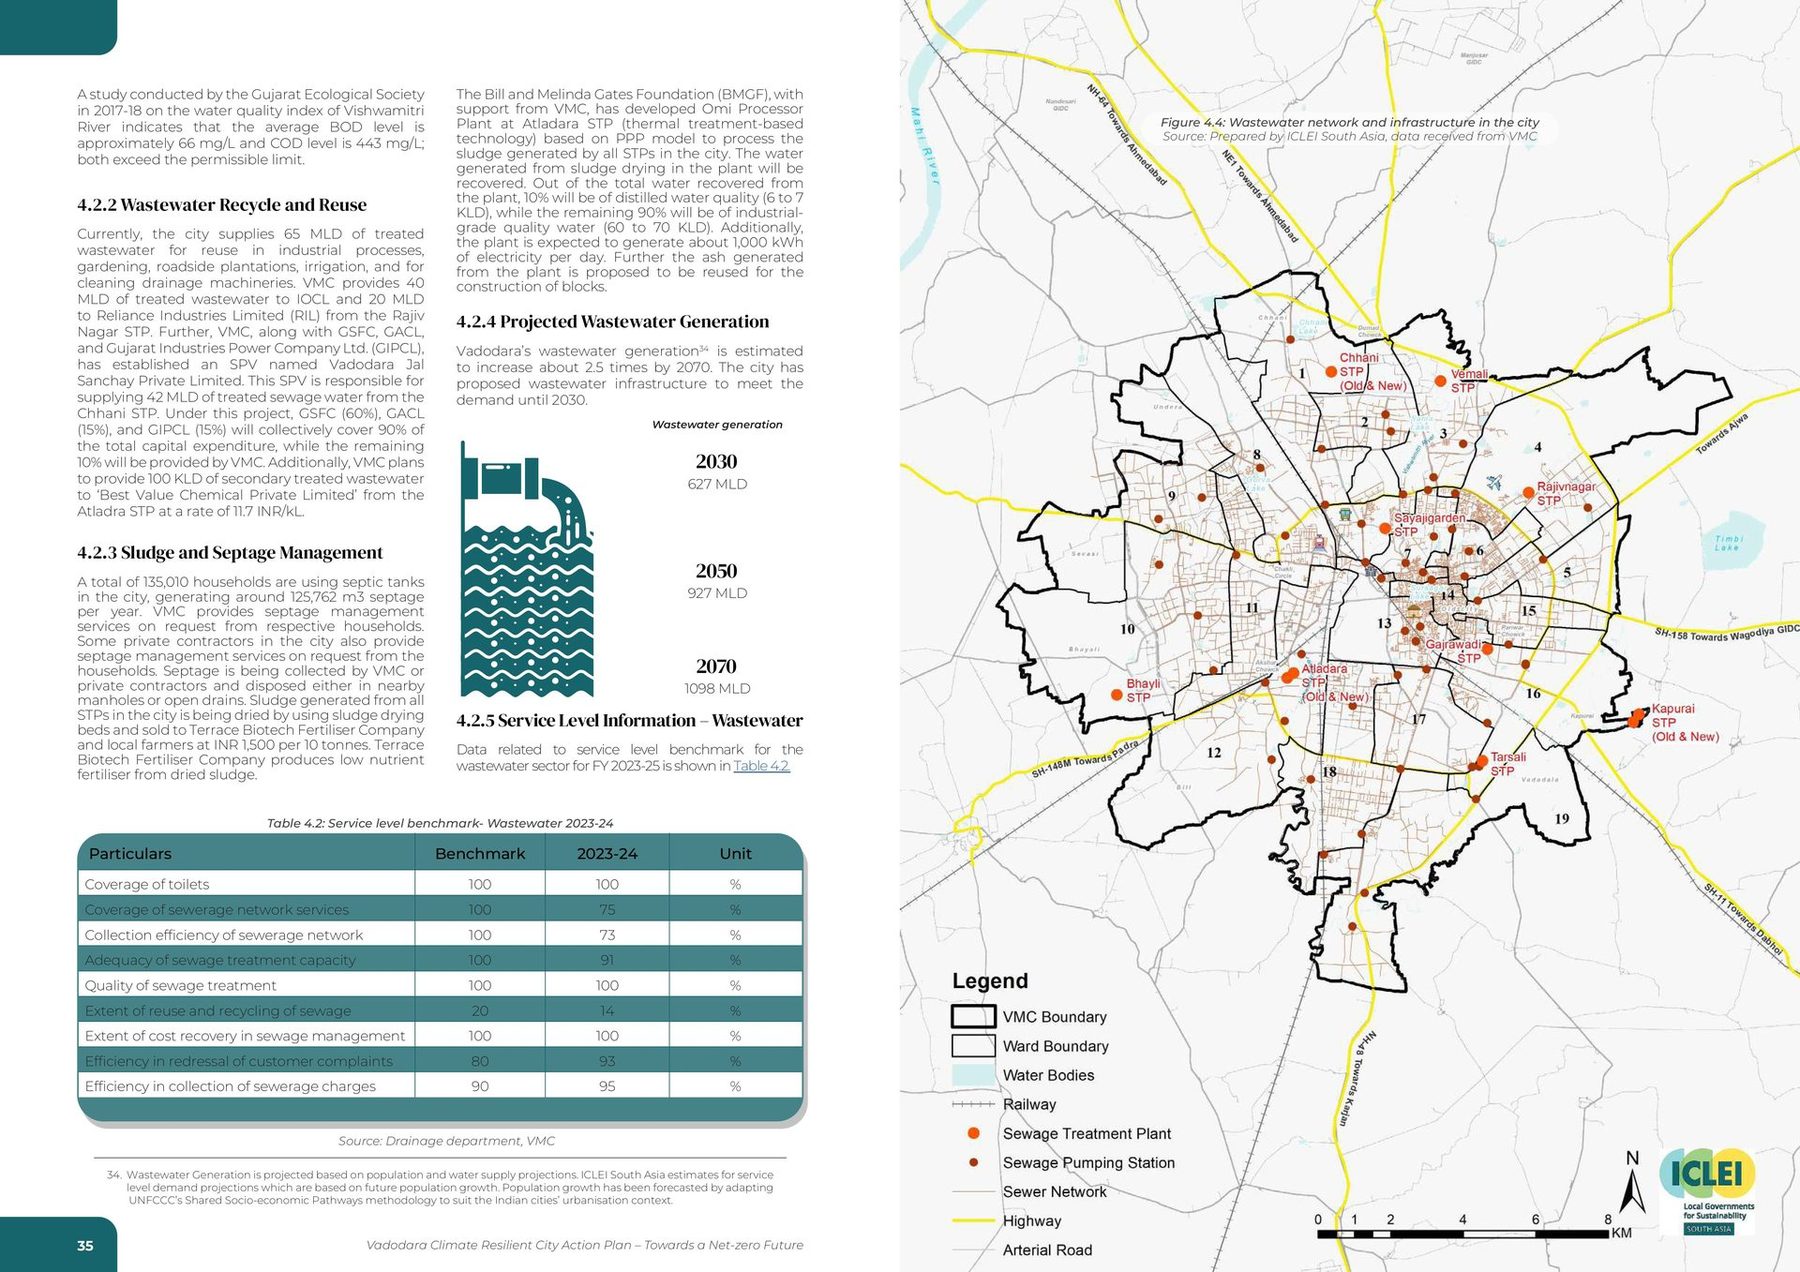
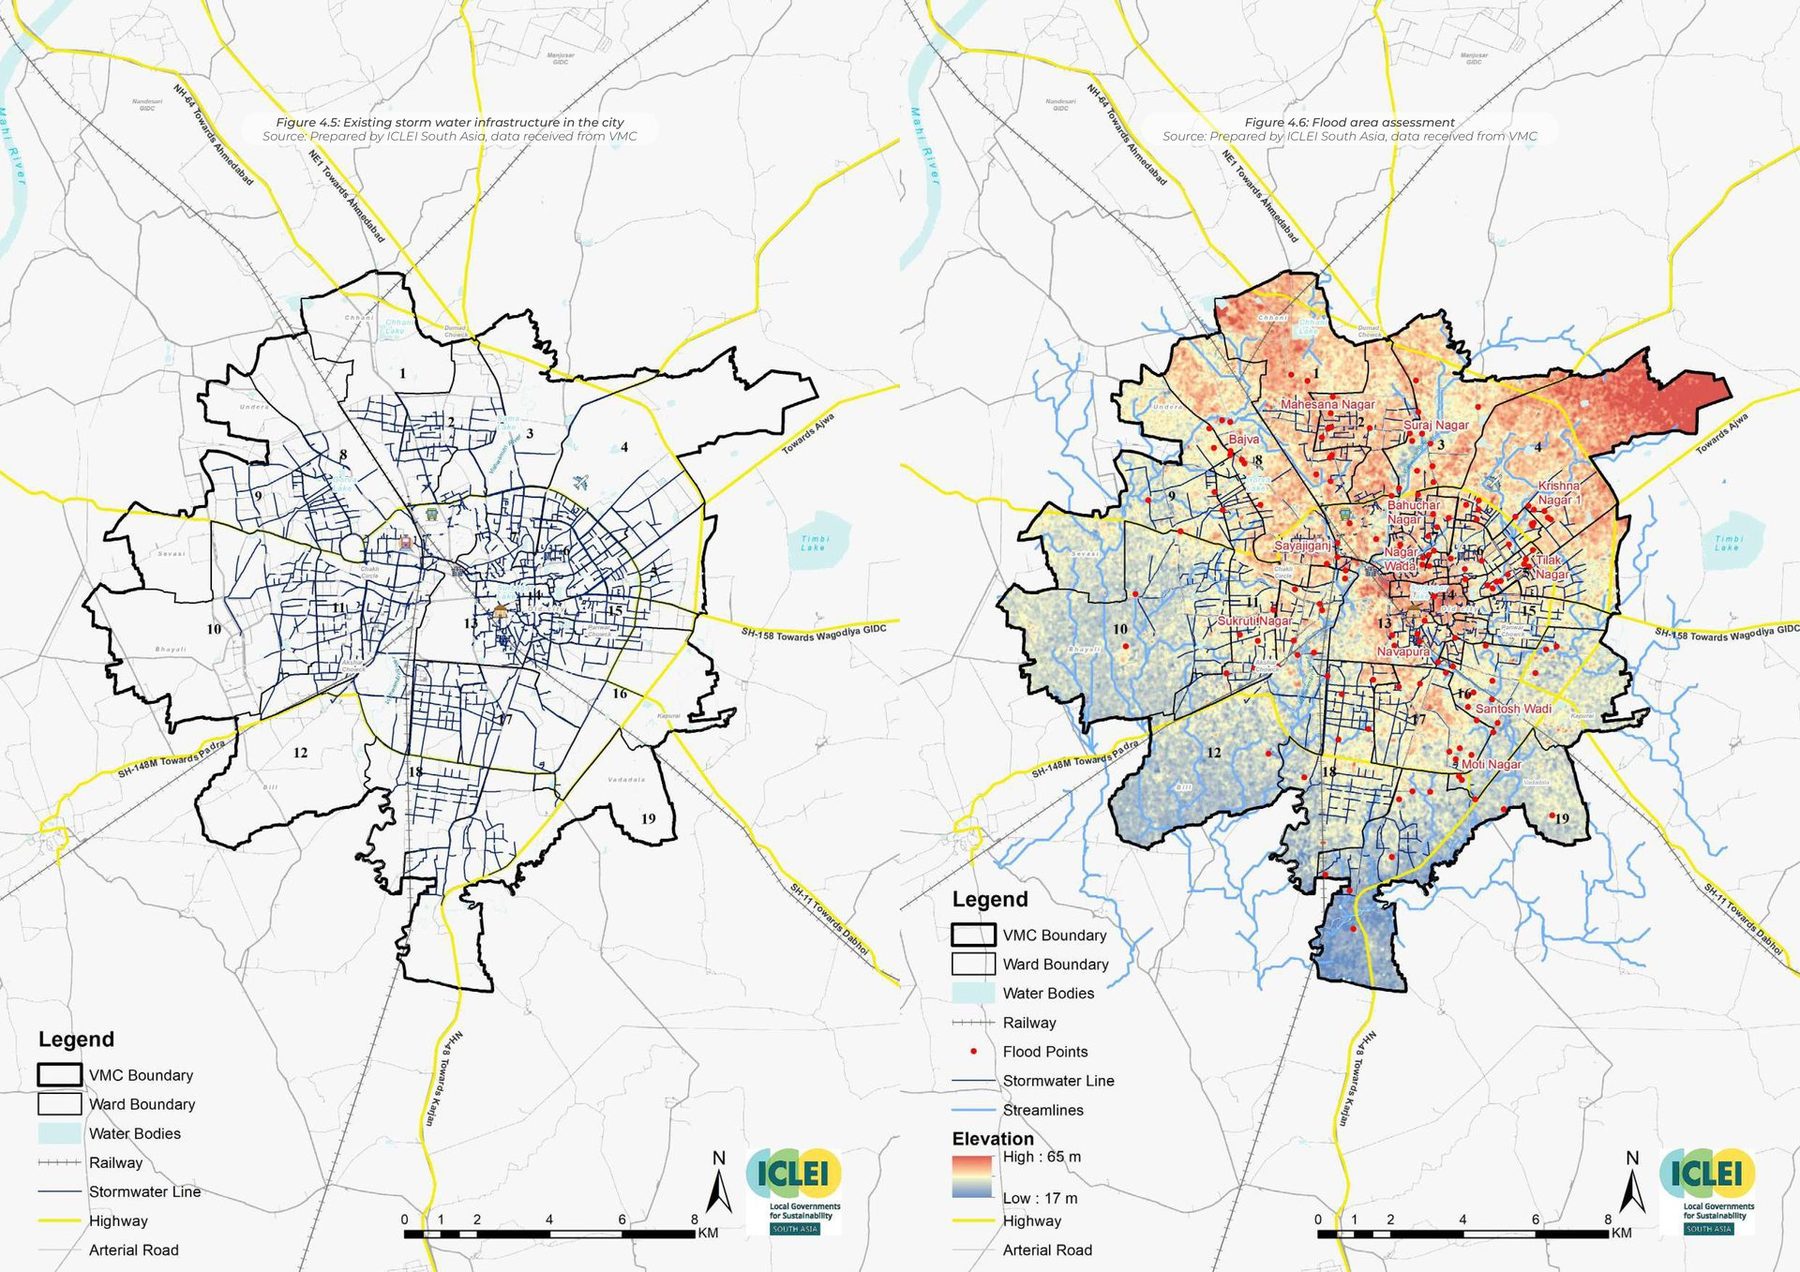
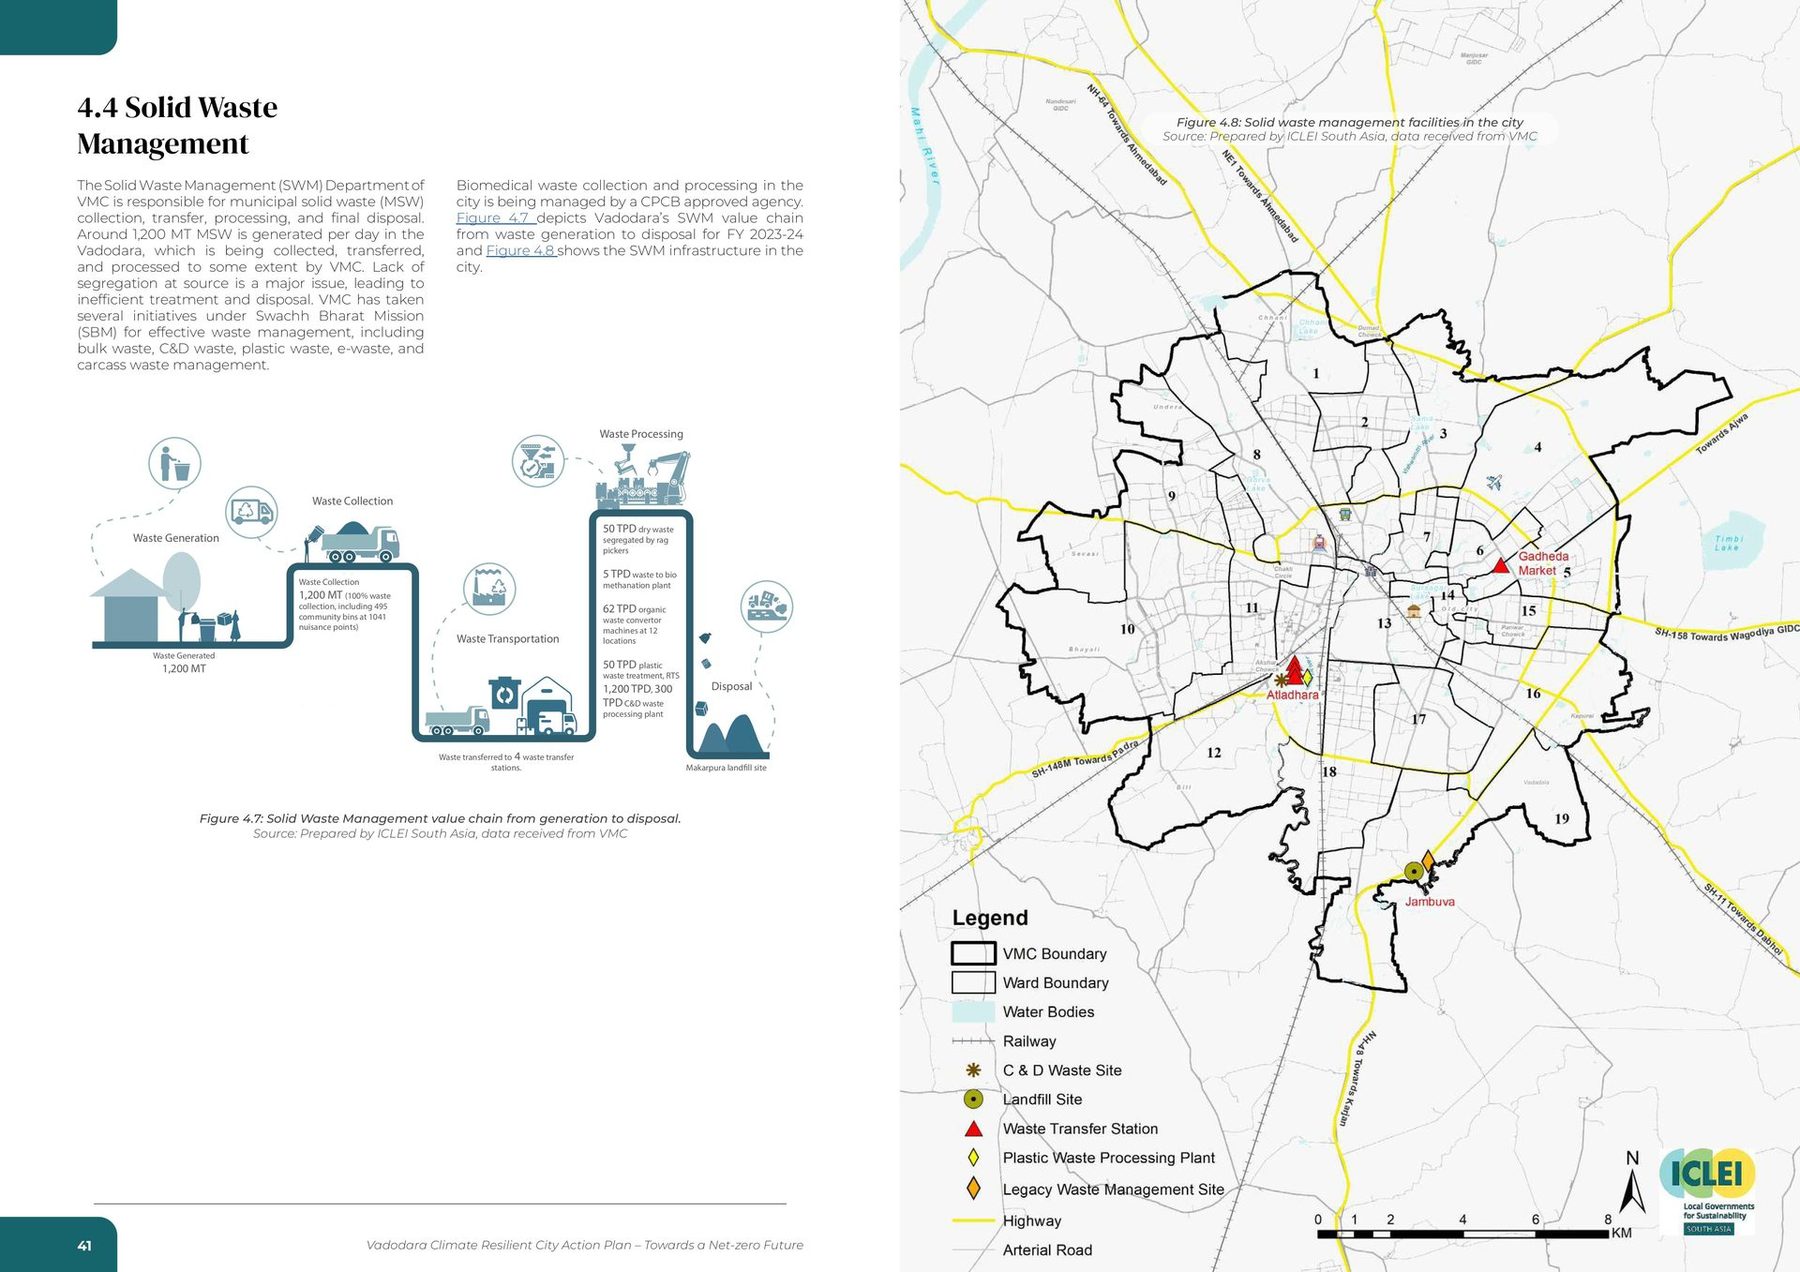
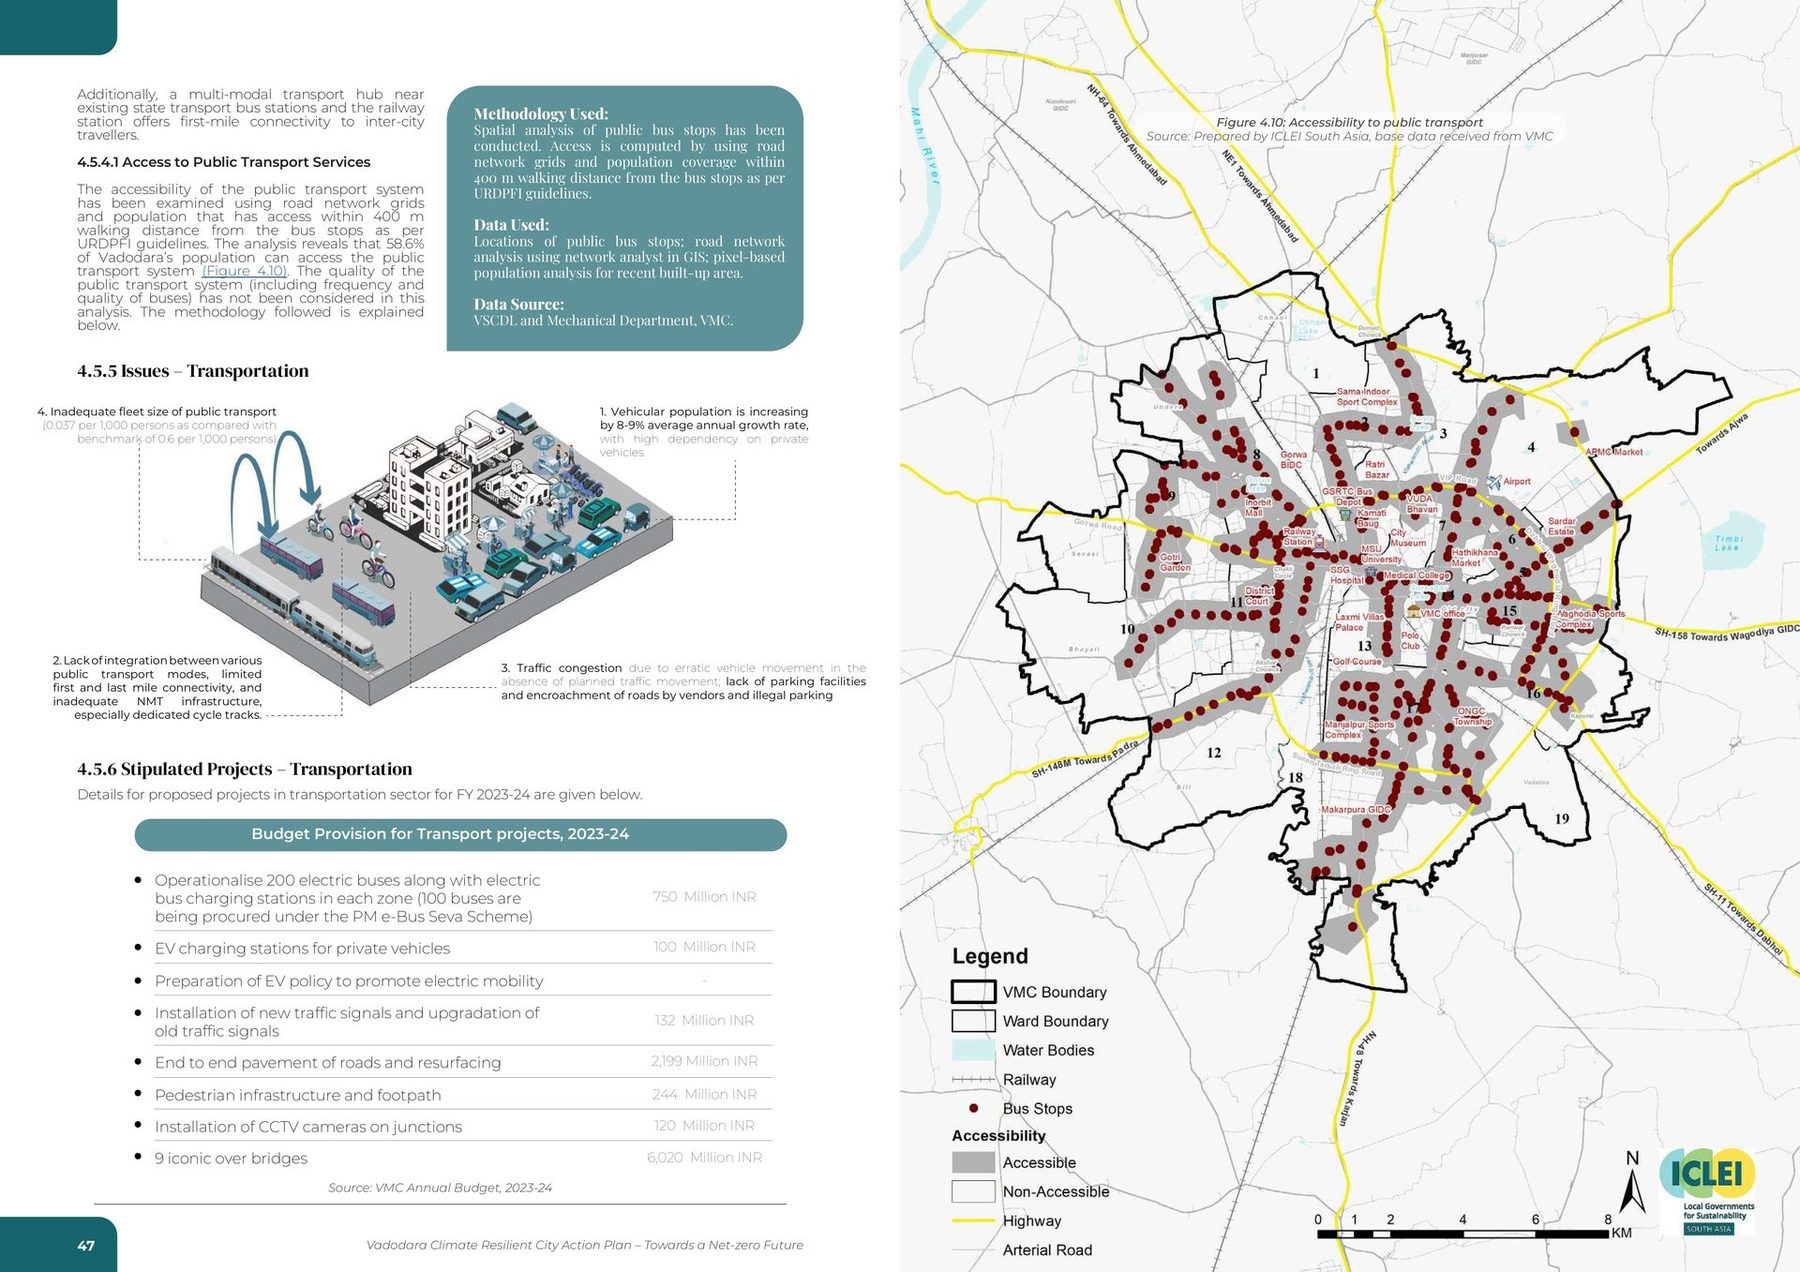
Wastewater network and infrastructure. Sewage treatment plants and the sewer network.Flood area assessment. Waterlogging points against the drainage network.Solid waste management facilities. Transfer stations, processing, the landfill.Accessibility to public transport. Bus stops and the wards beyond their reach.Tree cover map of Vadodara, 2023.Accessibility to public parks and gardens.Accessibility for fire stations. Response reach across the city.Distance from slum dwellings to government health care facilities.Air pollution sources, 2021. Industry, traffic and the monitoring stations.Population of slums vulnerable to urban heat.Flood-prone areas with a high incidence of water- and vector-borne diseases.Population vulnerable to urban flooding.Slums impacted by urban flooding.Wards impacted by urban heat and water supply issues. The first cross: hazard against infrastructure.Wards exposed to urban flooding and water supply issues.Public transport stations and traffic junctions impacted by urban heat.Wards with compromised road infrastructure, vulnerable to urban flooding and waterlogging.Emergency services vulnerable to urban flooding or waterlogging.Wards impacted by climate hazards and fragile urban systems. Every hazard laid over every fragile system: the wards the plan has to answer for first.
fig.23Wards impacted by climate hazards and fragile urban systems. Every hazard laid over every fragile system: the wards the plan has to answer for first.
(02) the inventory

A number the city can be held to

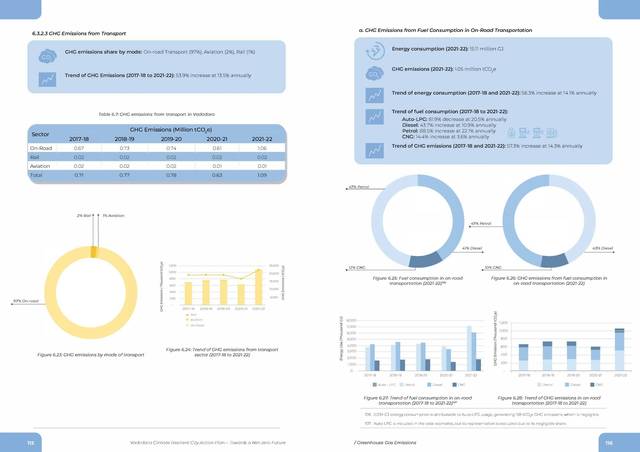
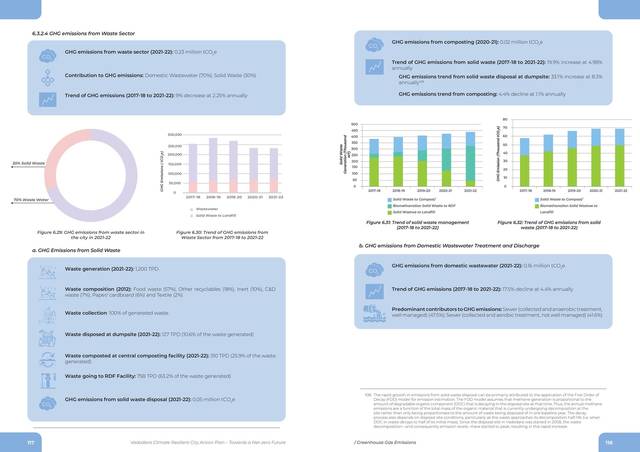
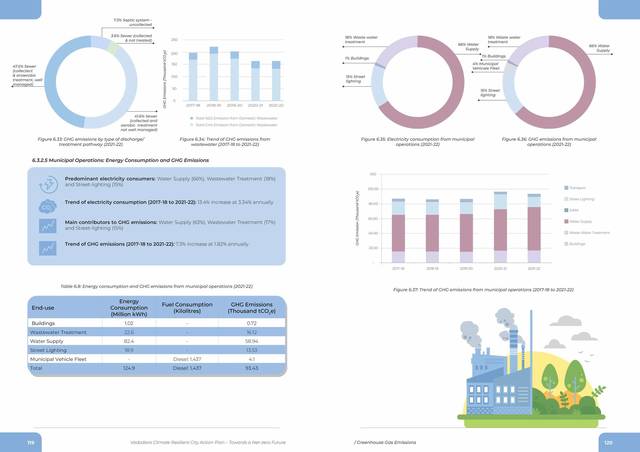
The maps say where; the inventory says how much. Every activity number has a named source (the electricity utility, the oil and gas companies, the corporation's own fleet and plants, the railway, the airport) and the sum is a number the city can be held to: 3.04 million tonnes of CO₂e in a year, 1.25 tonnes per person. Vadodara's profile is the reverse of Ahmedabad's: transport first at 36%, homes second at 32%, industry only 14%.

Five years of the same accounting, 2017–18 to 2021–22, give the trend: 16.7% up, 4.2% a year, with the pandemic dip in between. That is the business-as-usual line the rest of the plan argues against.
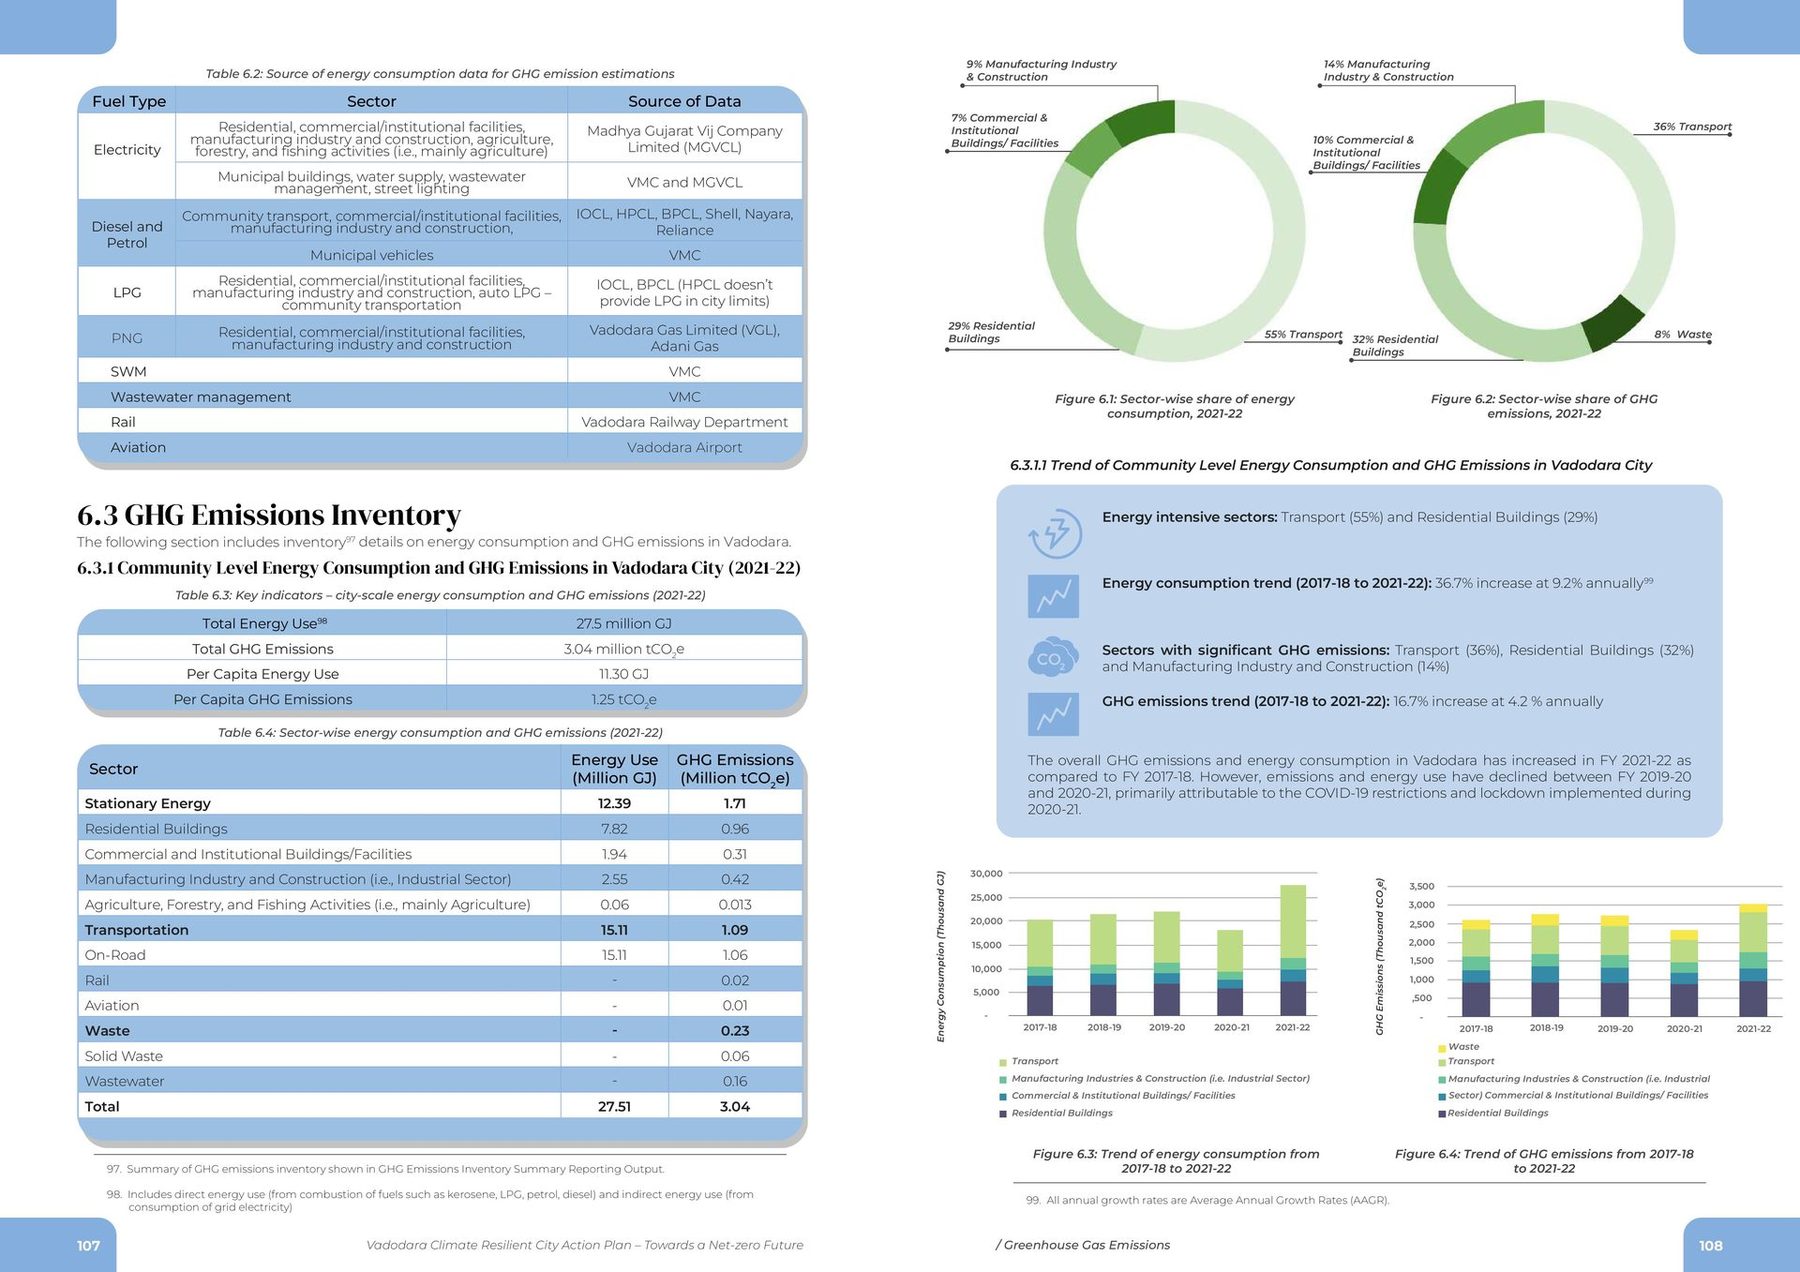
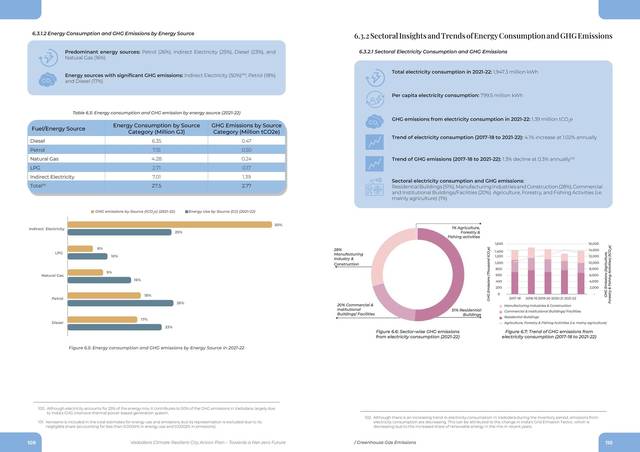
The inventory. Where every activity number comes from (MGVCL, the oil companies, the gas utilities, the corporation itself), and what it adds up to: 3.04 million tCO₂e in 2021–22, transport first, homes second.
fig.24The inventory. Where every activity number comes from (MGVCL, the oil companies, the gas utilities, the corporation itself), and what it adds up to: 3.04 million tCO₂e in 2021–22, transport first, homes second.
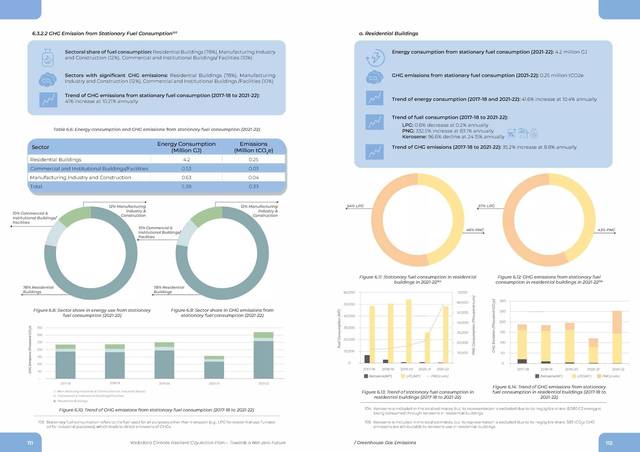
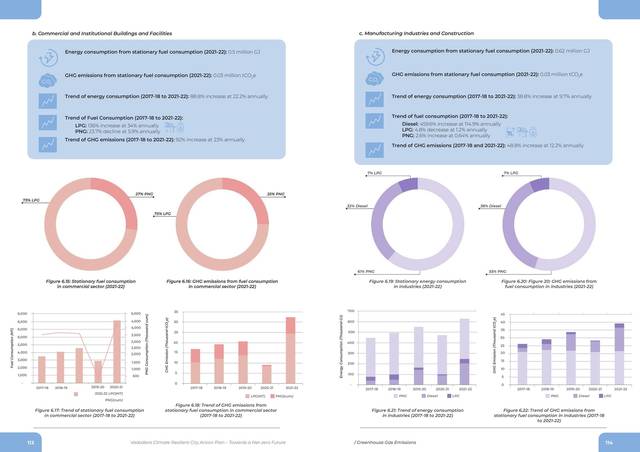
Inventory detail. Energy use and emissions by sector, 2017–18 to 2021–22.
fig.25–30Sector by sector. Energy use and emissions, 2017–18 to 2021–22: stationary, residential, commercial, industry, transport, waste.
3.04 Mt
(CO₂e · 2021–22)
27.5 M GJ
(energy use)
1.25 t
(CO₂e per person)
36%
(from transport)
Vadodara CRCAP, GHG emissions inventory 2021–22 · sources: MGVCL, VMC, IOCL/HPCL/BPCL, Vadodara Gas, Adani Gas, Vadodara Railway, Vadodara Airport
(03) the pathway

Three lines to 2070

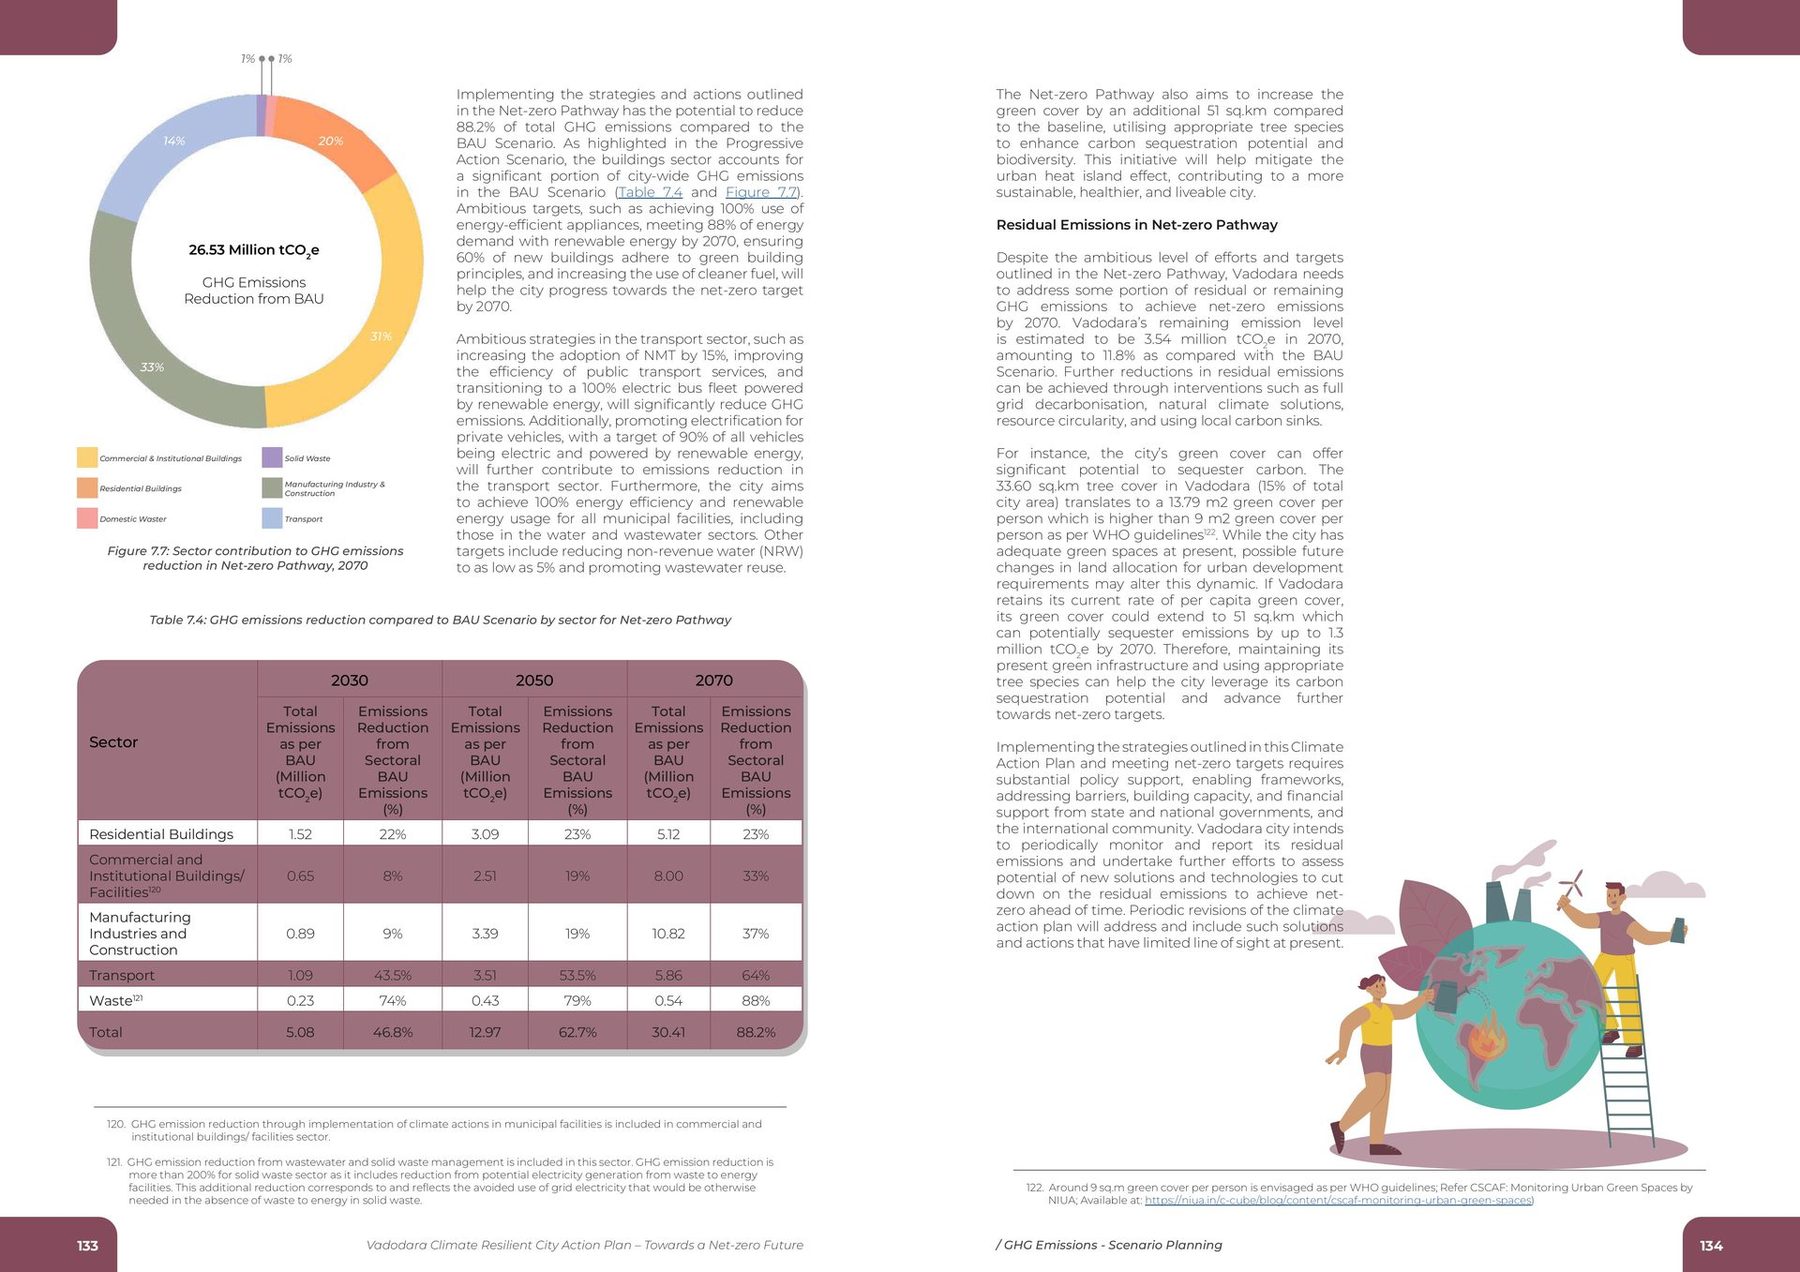
Three lines to 2070. Business as usual, rising to thirty million tonnes. The progressive action scenario, every scheme and target already on the books at the state and the centre pushed as far as they go, which cuts 59.9% from BAU and leaves twelve million tonnes on the table. And the net-zero pathway, which extends each of those actions until the remaining line meets the target: 46.8% below BAU in 2030, 62.7% in 2050, 88.2% in 2070.

Buildings do most of the work: 78.9% of BAU emissions come from stationary energy, and efficiency plus renewables in homes, offices and industry can halve the BAU line on their own. The corporation proposes two hundred electric buses by 2025 as a start.
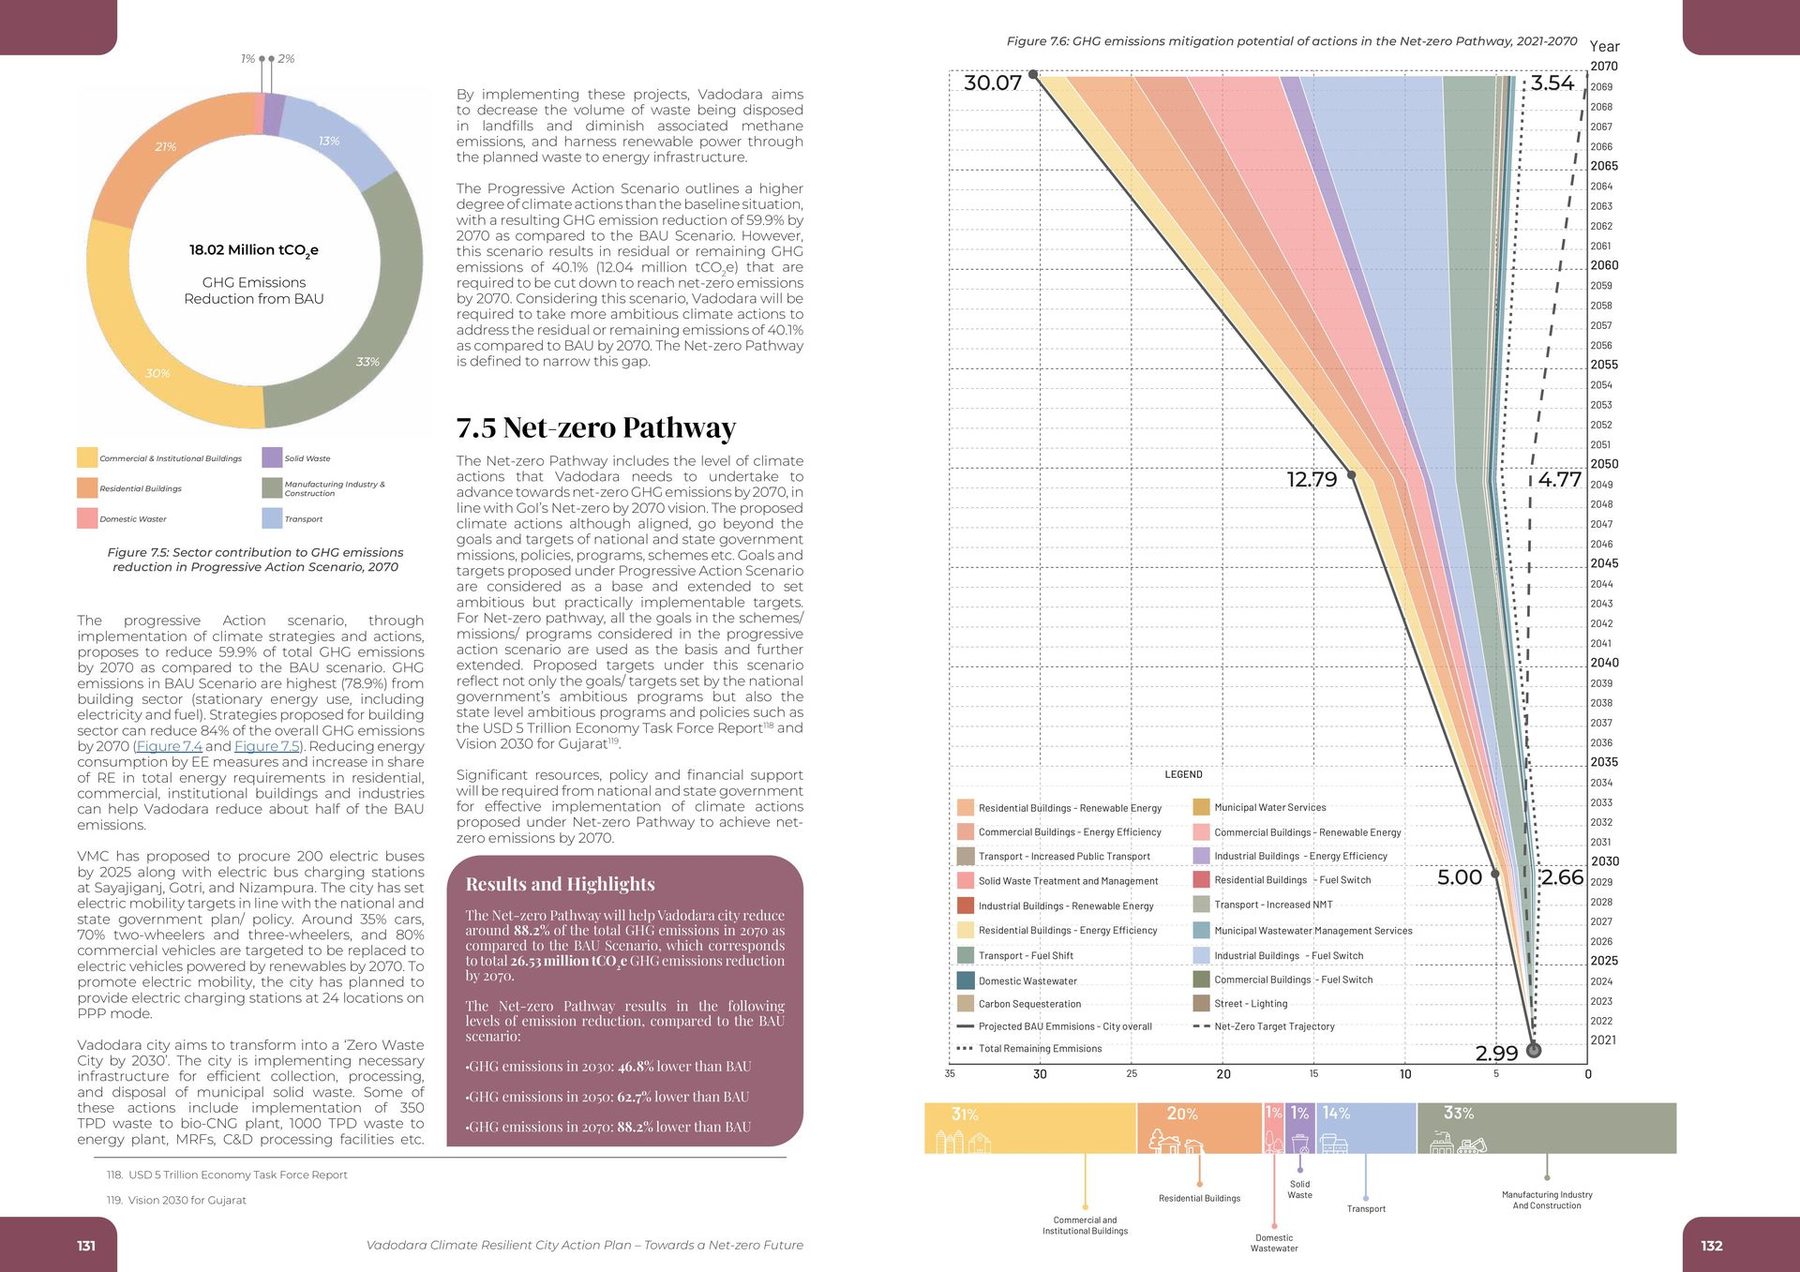
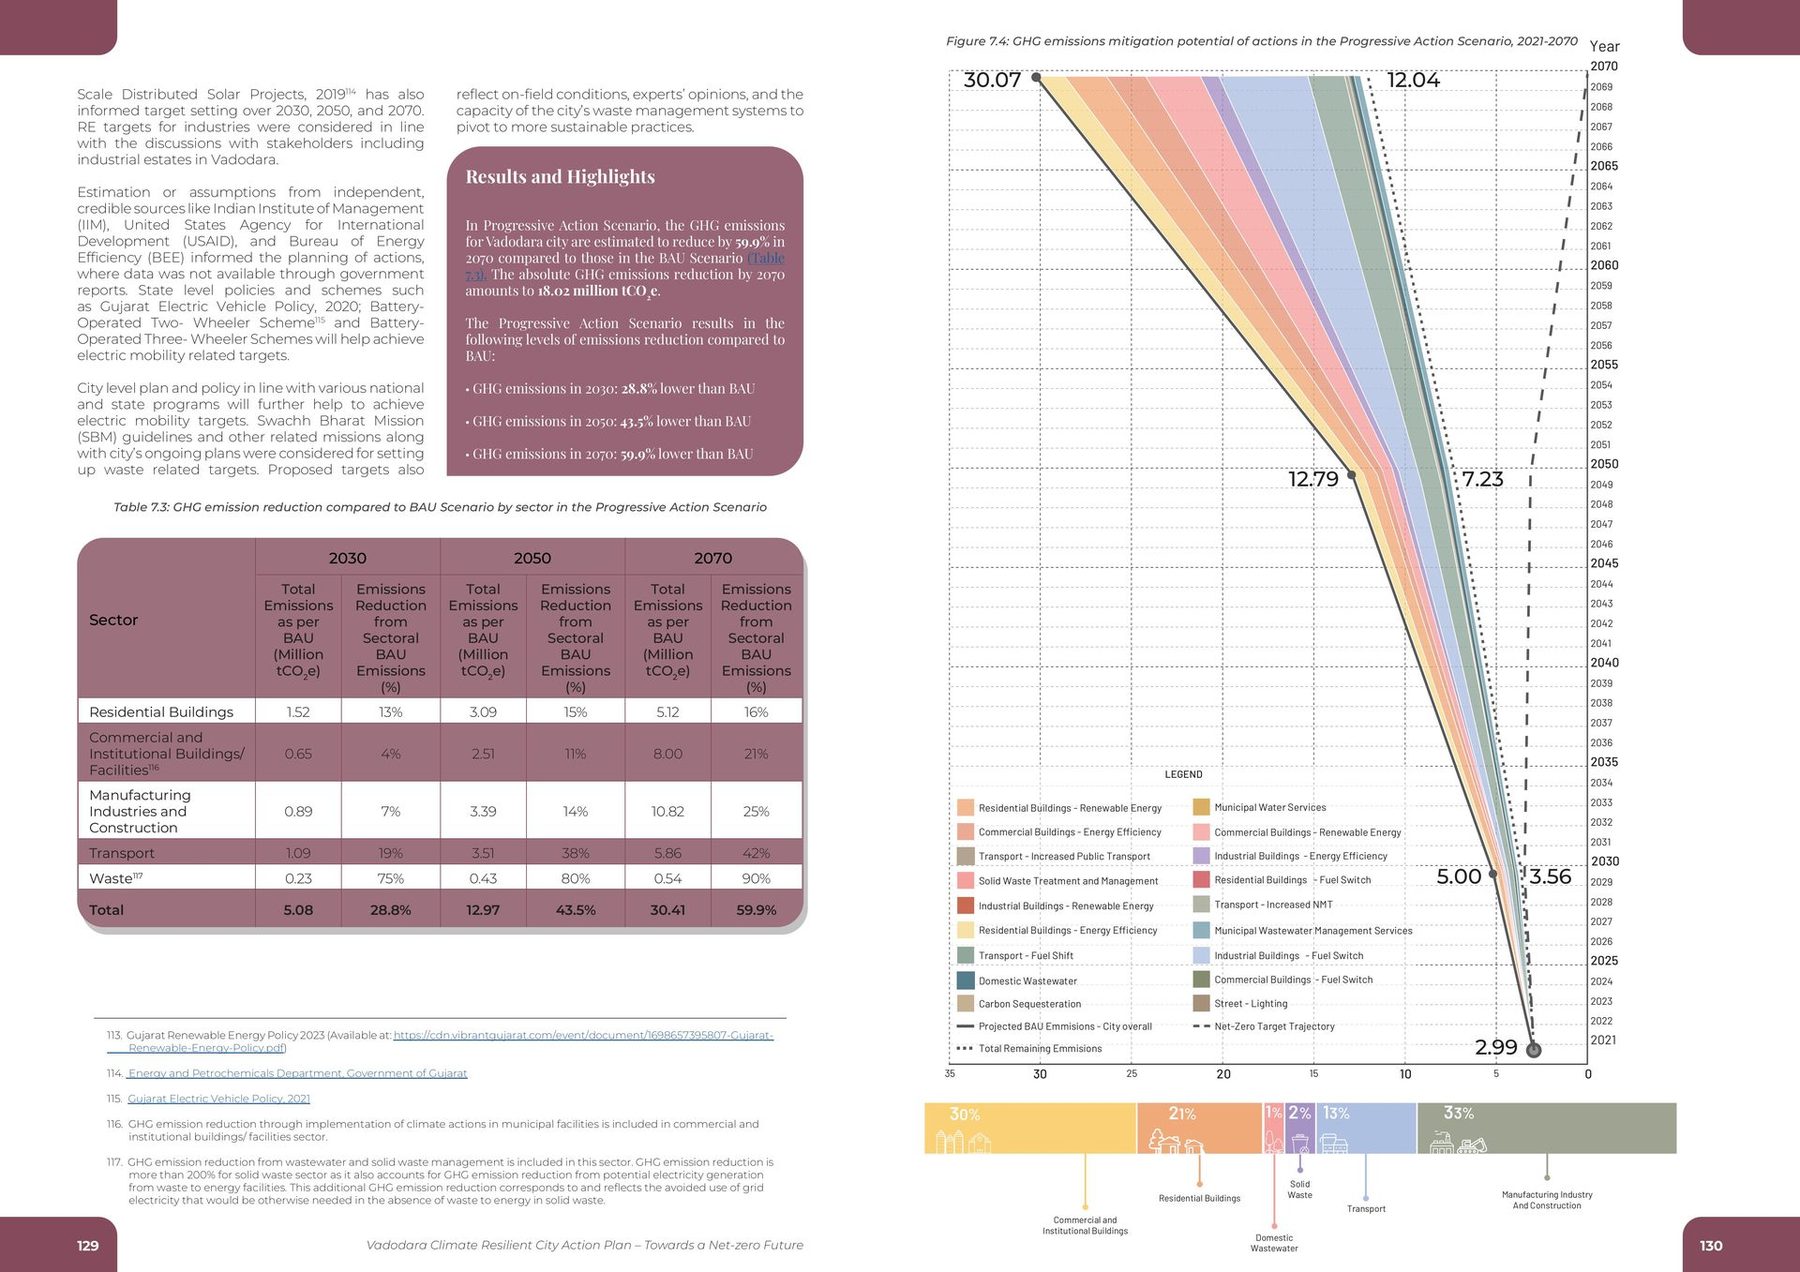
The pathway, whole. Mitigation potential of every action in the net-zero pathway, 2021–2070: 46.8% below BAU in 2030, 62.7% in 2050, 88.2% in 2070.
fig.31The pathway, whole. Mitigation potential of every action in the net-zero pathway, 2021–2070: 46.8% below BAU in 2030, 62.7% in 2050, 88.2% in 2070.
The progressive action scenario. Every scheme already on the books, pushed as far as it goes: 59.9% below BAU, and 12 million tonnes still on the table.
fig.32The progressive action scenario. Every scheme already on the books, pushed as far as it goes: 59.9% below BAU, and 12 million tonnes still on the table.
The targets, by sector and by decade. What each strategy has to deliver for the line to hold.
fig.33The targets, by sector and by decade. What each strategy has to deliver for the line to hold.
(04) strategies

Eight sectors, one goal each

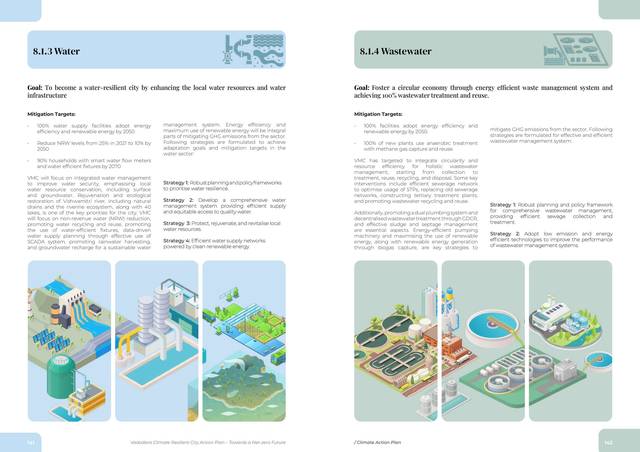
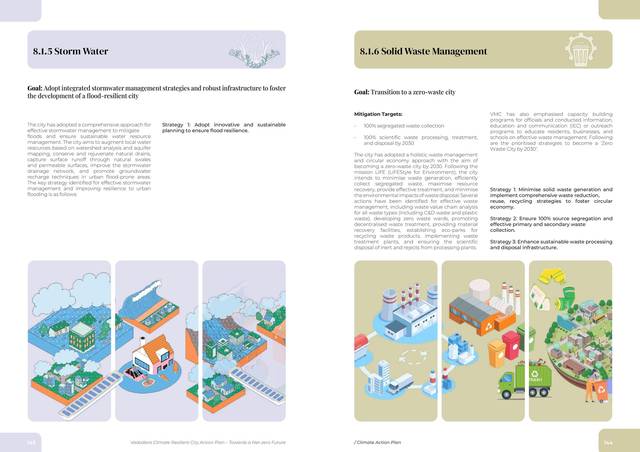
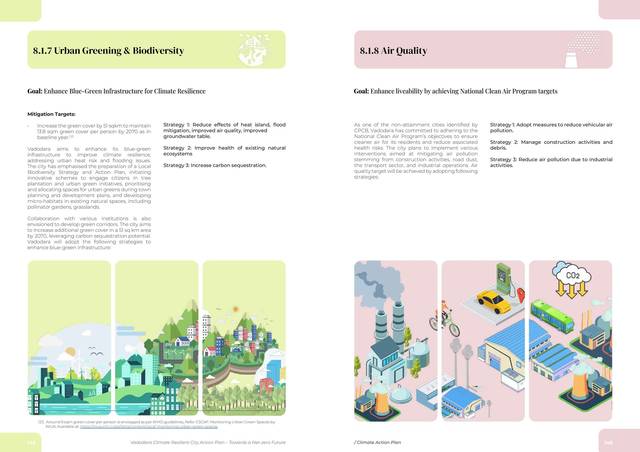
Eight sectors, each with one goal, a handful of strategies, and targets by decade: a zero-waste city by 2030, 100% wastewater treated and reused, the National Clean Air Programme met. My part of the book begins here: the strategies were drawn before they were tabulated, so that a department head could see the piece of city each one changes.
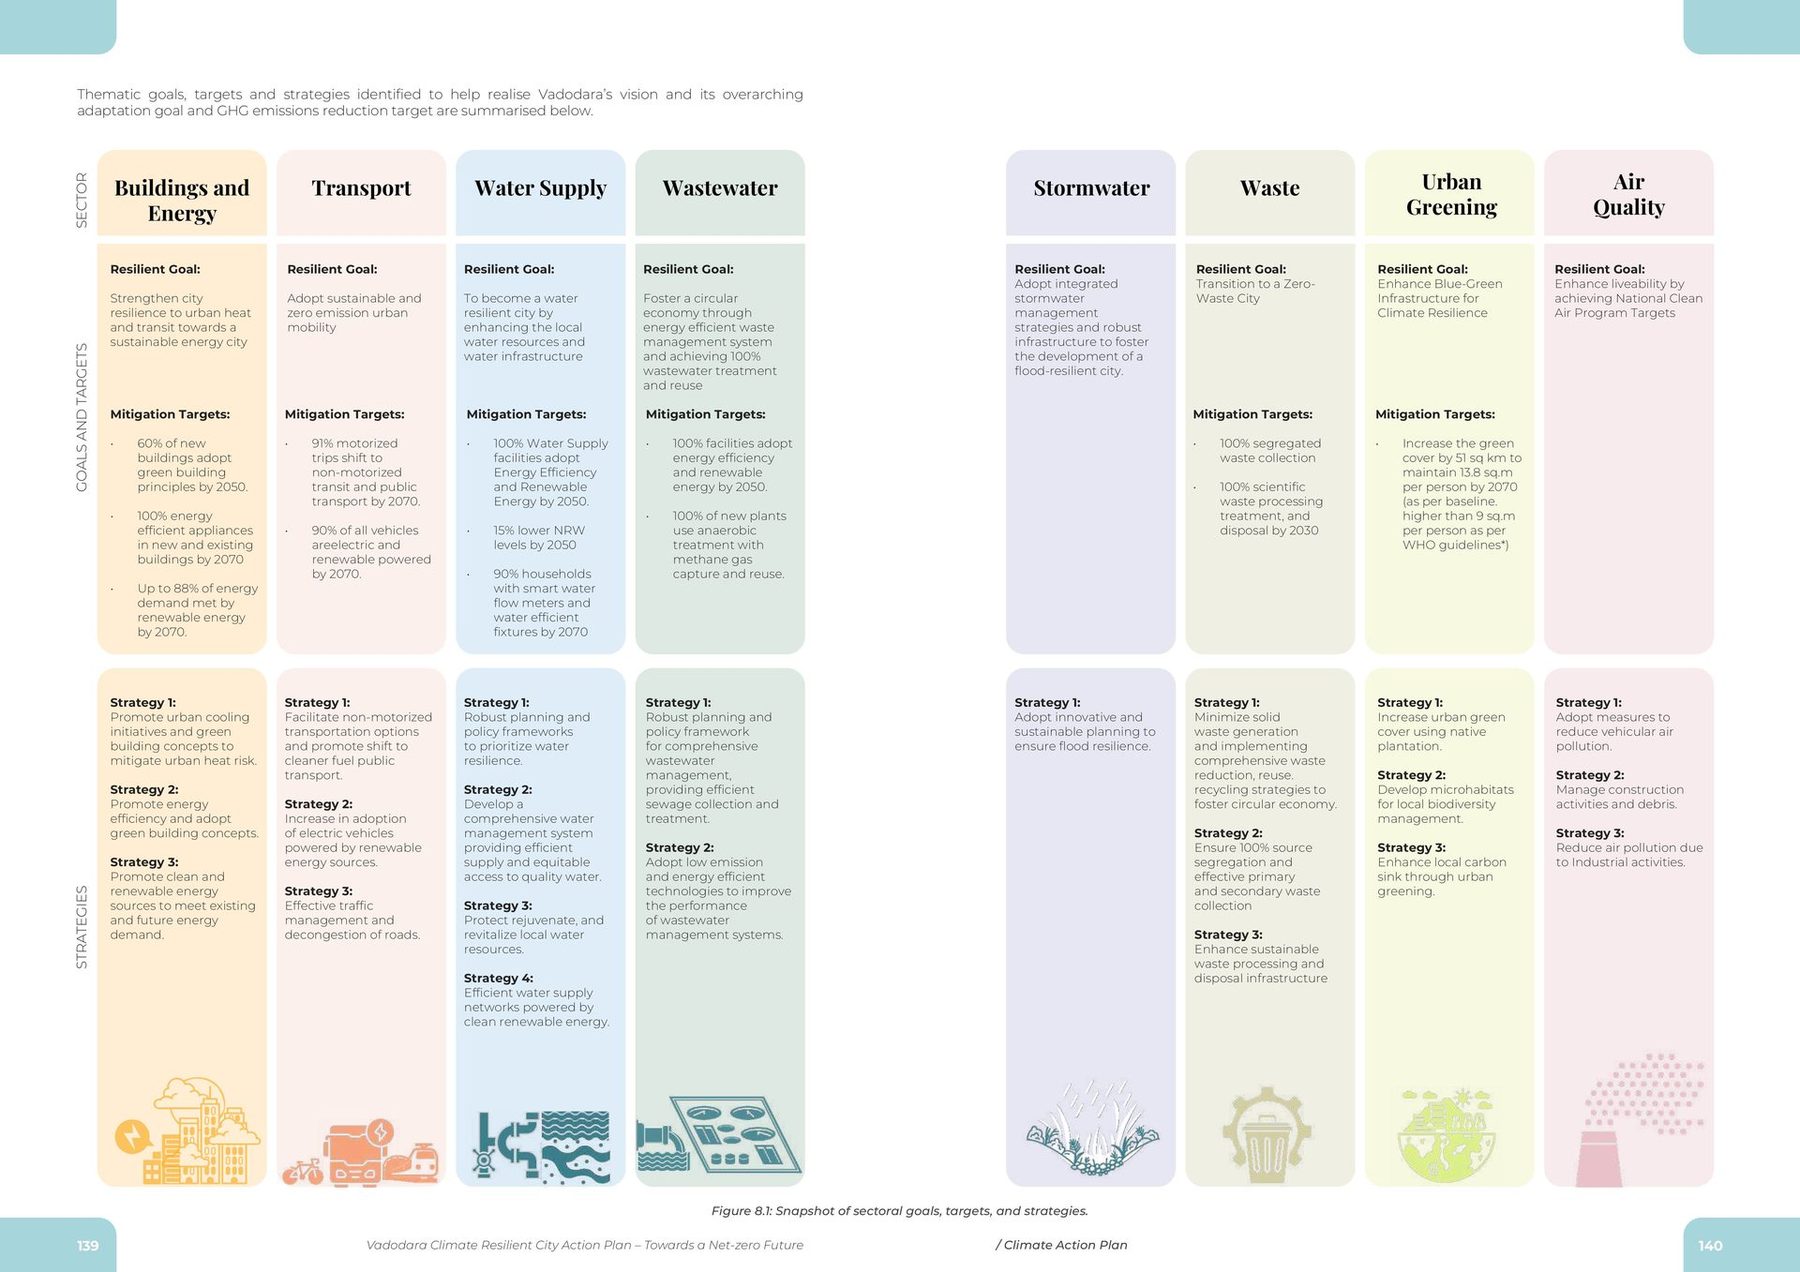
The strategy sheet. Eight sectors across the page, goals, strategies and targets in one reading.
fig.34The strategy sheet. Eight sectors across the page, goals, strategies and targets in one reading.
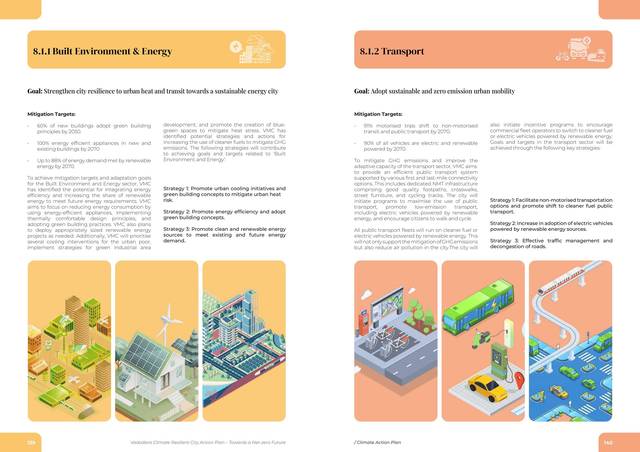
Sector goals, drawn. Built environment and energy; transport.
Sector goals, drawn. Water; wastewater.
Sector goals, drawn. Stormwater; solid waste.
Sector goals, drawn. Urban greening and biodiversity; air quality.
fig.35–38The sector goals, drawn. Two sectors to a spread.
(05) actions

Sheets a department can pick up

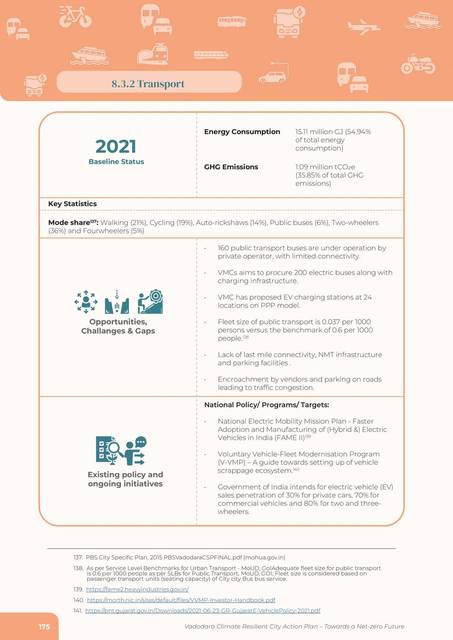
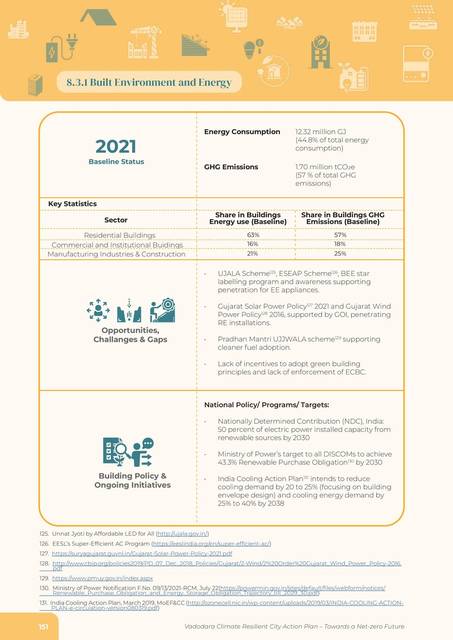
The action sheets are the part of the plan that gets picked up. Each sector opens with its 2021 baseline and the gaps the audit found; each action follows with its target, the entity that implements it, the financing mode, the indicative cost and timeline, and a resilience score. A sheet is what a department takes to a budget meeting.
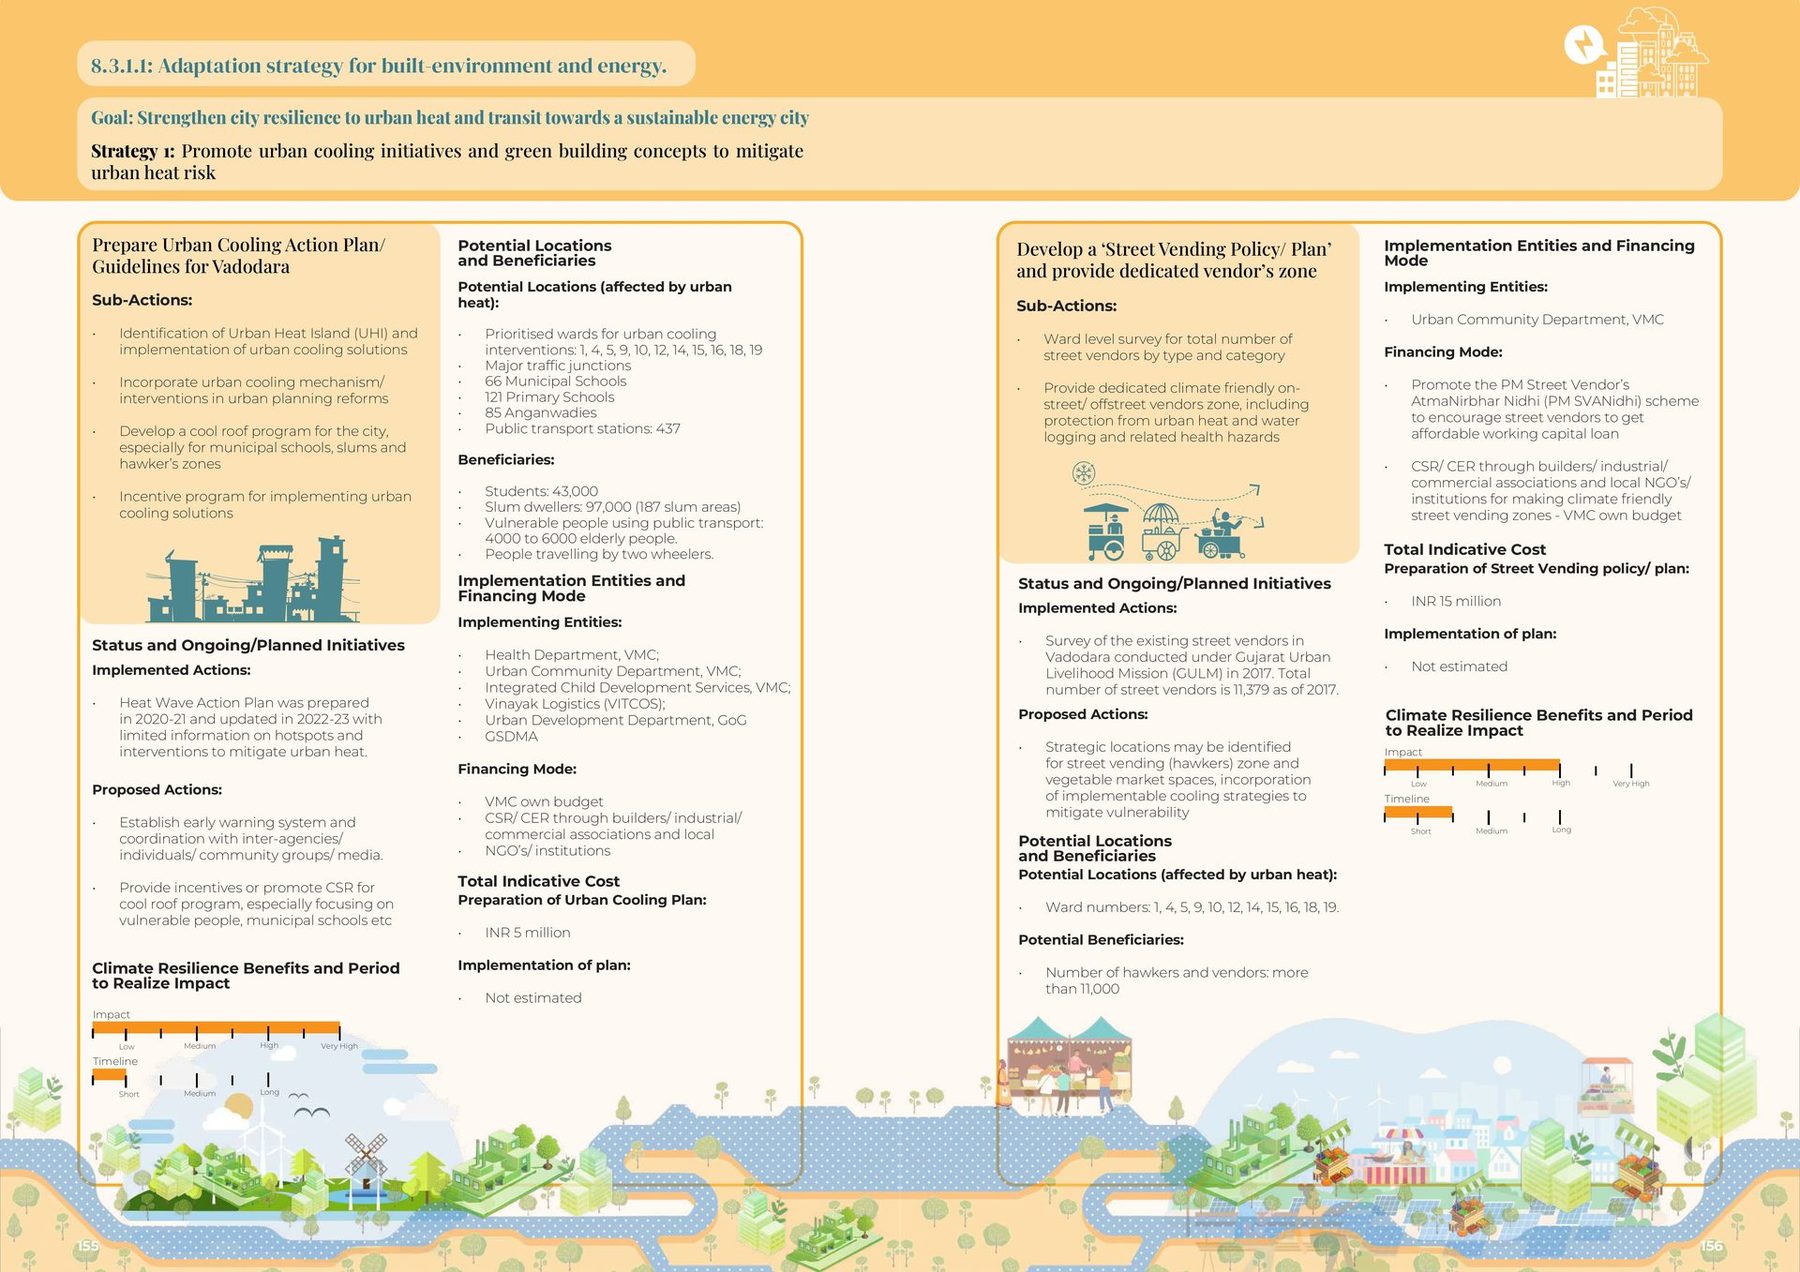
An action sheet. Built environment: strategies and actions with their targets, implementing entities, financing modes, indicative costs and resilience impact.
fig.39An action sheet. Built environment: strategies and actions with their targets, implementing entities, financing modes, indicative costs and resilience impact.
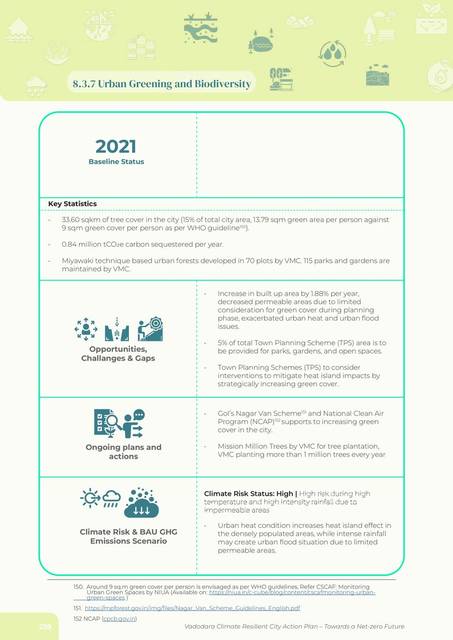
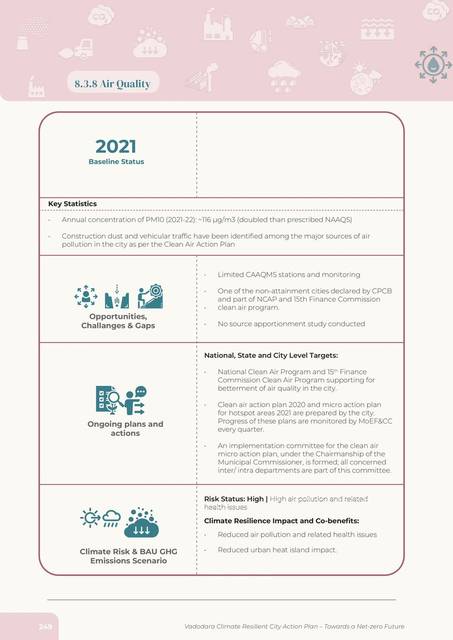
Built environment and energy. The sector sheet: 2021 baseline, key statistics, opportunities and gaps.
Transport. Sector sheet.
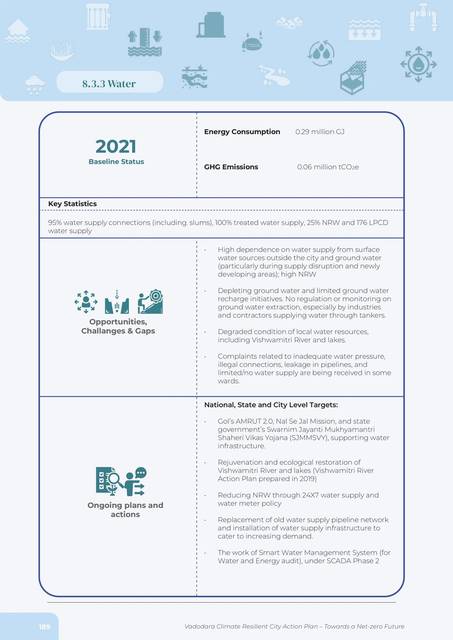
Water. Sector sheet.
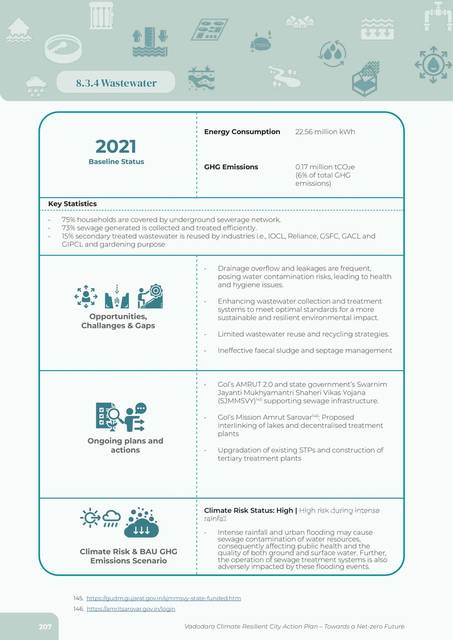
Wastewater. Sector sheet.
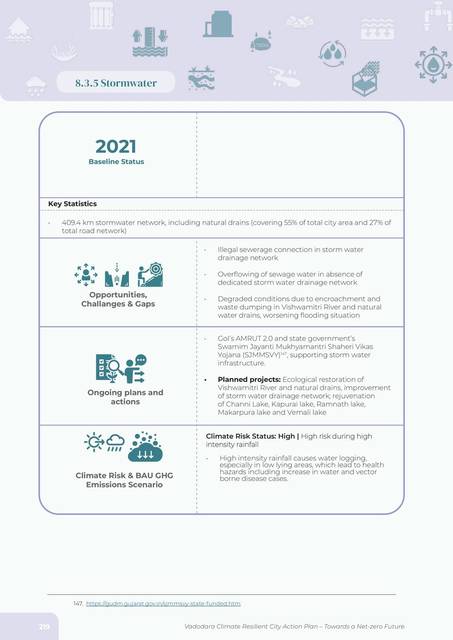
Stormwater. Sector sheet.
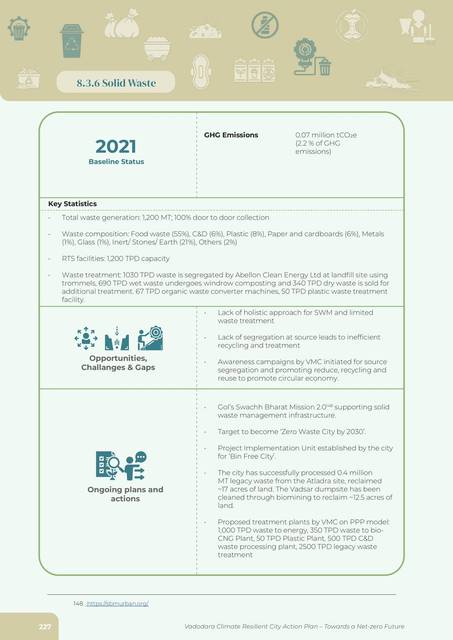
Solid waste. Sector sheet.
Urban greening and biodiversity. Sector sheet.
Air quality. Sector sheet.
fig.40–47One sheet per sector. The 2021 baseline, key statistics, and the opportunities and gaps the actions answer.
(outcome)
Vadodara Climate Resilient City Action Plan. Towards a Net Zero Future, August 2024. Published by the Vadodara Municipal Corporation and the Government of Gujarat under CapaCities (Swiss Agency for Development and Cooperation), with ICLEI South Asia, South Pole, econcept and NIUA. The second of the three Gujarat plans, between Ahmedabad and Surat.
(what I'd do next)
Rebuild the inventory as a living thing: the same ward maps and the same sector numbers, refreshed from the utilities' data every year, so the city can watch its own line instead of waiting for the next plan.
(next) Surat Climate Action Plan · the same instrument, net zero by 2047 →